

Key Insights
The Southeast Asia food service market, encompassing key economies such as Indonesia, Malaysia, Philippines, Singapore, Thailand, and Vietnam, is projected to experience significant expansion. The market size is estimated at $223.8 billion in 2025, with a projected Compound Annual Growth Rate (CAGR) of 13.2% from 2025 to 2033. Key growth drivers include a growing young demographic with increasing disposable incomes, rapid urbanization fostering demand for convenient dining solutions, and a rising appetite for diverse culinary experiences. The expanding quick-service restaurant (QSR) and café sectors, alongside the proliferation of international food brands, are major contributors to this growth. Despite challenges like fluctuating food prices and intense competition, the market outlook remains highly positive. Segments such as cafés, bars, and QSRs offering diverse cuisines are anticipated to exhibit particularly strong performance. The prevalence of chained outlets underscores the significance of brand recognition and operational efficiency in this competitive environment. Regional variations in consumer preferences and economic conditions will shape individual country growth trajectories. Strategic expansion by major entities like Jollibee Foods Corporation, McDonald's Corporation, and Starbucks Corporation, coupled with the rise of local brands, will continue to influence market dynamics.
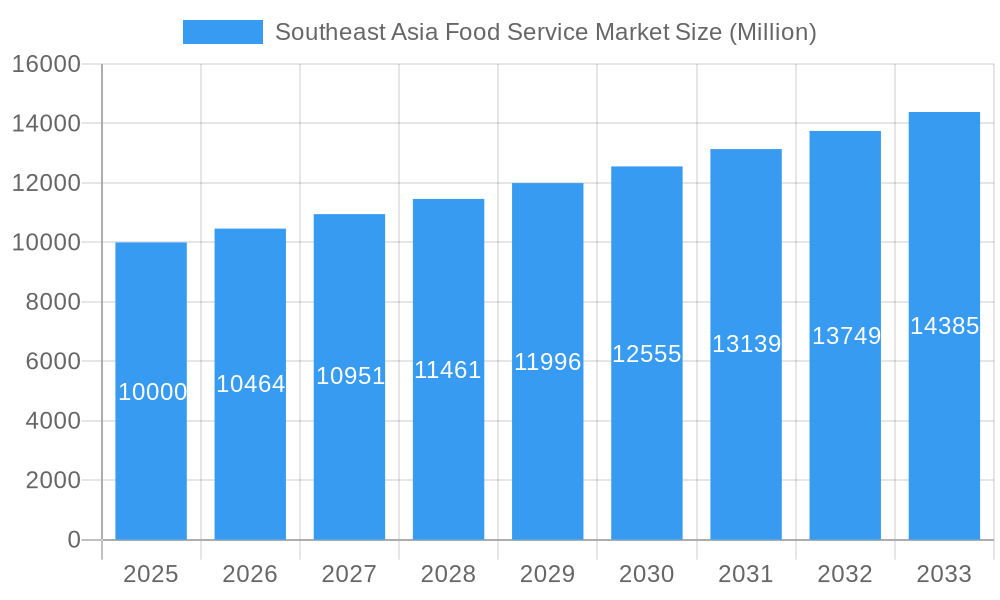
Southeast Asia Food Service Market Market Size (In Billion)
Market segmentation provides critical insights into specific opportunities. The substantial presence of chained outlets indicates a consumer preference for established brands and consistent quality. Geographic segmentation highlights varying growth potentials across countries, with larger economies and denser populations driving accelerated growth. The diversity of foodservice types reflects evolving consumer tastes and lifestyles, favoring a wide array of culinary choices and dining experiences. Location-based segmentation (Leisure, Lodging, Retail, Standalone, Travel) illustrates the dynamic nature of food service consumption, intrinsically linked to tourism, leisure activities, and daily routines. The analysis emphasizes the critical importance of convenience and accessibility, underscoring strategic location selection for food service providers. Further in-depth research into specific consumer preferences, competitive strategies, and evolving regulatory landscapes will enable a more refined understanding of the long-term prospects for the Southeast Asia food service market.
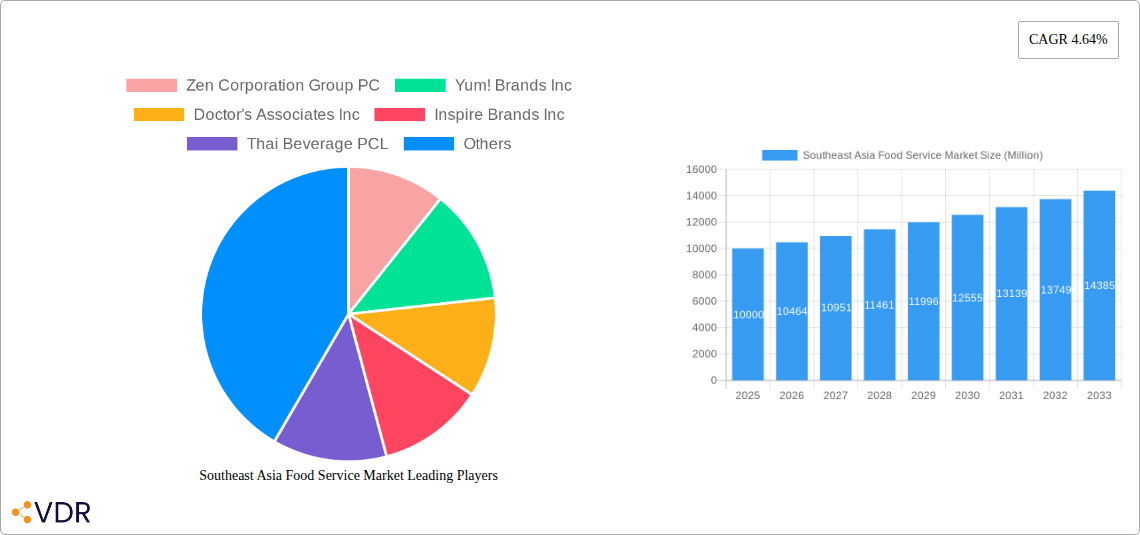
Southeast Asia Food Service Market Company Market Share
Southeast Asia Food Service Market: A Comprehensive Report (2019-2033)
This in-depth report provides a comprehensive analysis of the Southeast Asia food service market, covering the period from 2019 to 2033. It delves into market dynamics, growth trends, dominant segments, and key players, offering valuable insights for industry professionals, investors, and strategic decision-makers. The report utilizes a robust methodology, incorporating both qualitative and quantitative data, to provide a clear and actionable understanding of this dynamic market. The base year for this analysis is 2025, with estimations for 2025 and forecasts extending to 2033. The historical period covered is 2019-2024.
Southeast Asia Food Service Market Dynamics & Structure
The Southeast Asia food service market is characterized by a dynamic interplay of factors shaping its growth and structure. Market concentration varies significantly across segments and countries. While large international chains like McDonald's Corporation and Starbucks Corporation hold considerable market share in major urban areas, a large portion of the market comprises independent outlets, particularly in smaller cities and rural areas. Technological innovation, driven by online ordering platforms, delivery services, and automated kitchen technologies, is transforming operations and enhancing customer experience. However, regulatory frameworks related to food safety, hygiene, and labor laws differ across countries, creating a complex operating environment. The rise of health-conscious consumers is leading to an increased demand for healthier food options and plant-based alternatives, while also presenting challenges to established players. Mergers and acquisitions (M&A) activity is prevalent, with larger chains acquiring smaller businesses to expand their market footprint and product offerings. The volume of M&A deals in the period 2019-2024 was approximately xx Million, with a projected xx Million for 2025-2033.
- Market Concentration: High in urban areas, fragmented in rural regions.
- Technological Innovation: Online ordering, delivery apps, and automation are key drivers.
- Regulatory Frameworks: Vary across countries, impacting operational costs and compliance.
- Competitive Product Substitutes: Home-cooked meals, street food, and grocery delivery services.
- End-User Demographics: Young, tech-savvy population with diverse culinary preferences.
- M&A Trends: Consolidation is ongoing, with larger players acquiring smaller brands.
Southeast Asia Food Service Market Growth Trends & Insights
The Southeast Asia food service market has experienced substantial growth in recent years, driven by factors such as rising disposable incomes, urbanization, and changing consumer lifestyles. The market size, estimated at xx Million in 2025, is projected to reach xx Million by 2033, exhibiting a CAGR of xx% during the forecast period. Adoption of online ordering and delivery services is accelerating, with penetration rates increasing steadily. Technological disruptions, including AI-powered ordering systems and personalized recommendations, are enhancing efficiency and customer engagement. Consumer behavior is shifting towards convenience, with a growing preference for quick-service restaurants (QSRs) and food delivery platforms. However, fluctuations in economic conditions and changes in consumer preferences can impact market growth.
Dominant Regions, Countries, or Segments in Southeast Asia Food Service Market
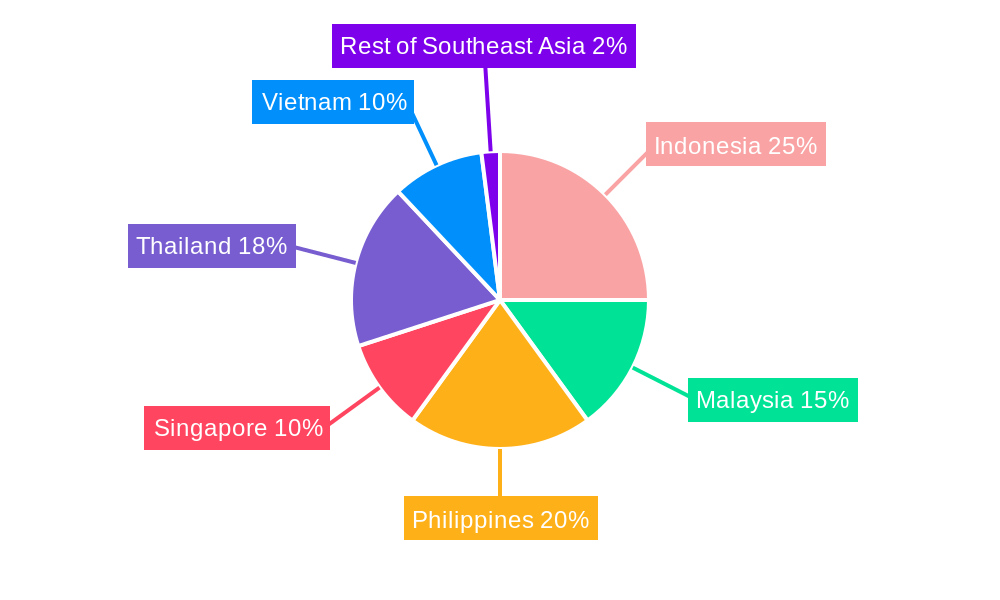
Indonesia, the Philippines, and Vietnam represent significant growth opportunities due to their large populations and expanding middle classes. Within the market segmentation, chained outlets dominate in urban centers, showcasing a higher market share compared to independent outlets, which are more prevalent in rural areas. The retail location segment exhibits strong growth, driven by increasing consumer spending and the rise of modern retail formats.
- Leading Countries: Indonesia, Philippines, and Vietnam lead in market size and growth potential.
- Dominant Outlet Type: Chained outlets hold a larger market share, particularly in urban areas.
- Fastest-Growing Location Segment: Retail locations, driven by rising consumer spending.
- Key Growth Drivers: Rising disposable incomes, urbanization, and changing consumer lifestyles.
Southeast Asia Food Service Market Product Landscape
The market offers a diverse range of products, reflecting evolving consumer preferences and culinary trends. Innovation focuses on healthier options, customizable meals, and convenience-oriented products. Technological advancements, such as mobile ordering apps and automated kiosks, enhance customer experience and operational efficiency. Unique selling propositions include specialized cuisines, loyalty programs, and personalized services.
Key Drivers, Barriers & Challenges in Southeast Asia Food Service Market
Key Drivers:
- Rising disposable incomes and urbanization are driving increased spending on food services.
- The burgeoning middle class is fueling demand for diverse and convenient dining experiences.
- Technological advancements are enhancing efficiency and customer satisfaction.
Key Challenges:
- Intense competition among established players and rising independent businesses.
- Supply chain disruptions and fluctuating food prices can impact profitability.
- Stringent food safety and hygiene regulations require significant investment in compliance.
Emerging Opportunities in Southeast Asia Food Service Market
Untapped opportunities exist in smaller cities and rural areas, where access to diverse food options is limited. The growth of online food delivery platforms creates opportunities for restaurants to expand their reach and access new customer segments. Evolving consumer preferences for healthier options and personalized dining experiences present opportunities for innovation and product differentiation.
Growth Accelerators in the Southeast Asia Food Service Market Industry
Strategic partnerships between food service businesses and technology providers are driving efficiency gains and enhancing customer experience. Market expansion strategies, such as entering new geographic regions or targeting underserved customer segments, offer significant potential for growth. Technological breakthroughs in areas such as AI-powered kitchen automation and personalized nutrition recommendations can significantly enhance productivity and customer engagement.
Key Players Shaping the Southeast Asia Food Service Market Market
- Jollibee Foods Corporation
- McDonald's Corporation
- Starbucks Corporation
- Yum! Brands Inc
- The Wendy's Company
- Inspire Brands Inc
- Restaurant Brands International Inc
- Minor International PCL
- Thai Beverage PCL
- Nando's Group Holdings Limited
- Doctor's Associates Inc
- Domino's Pizza Enterprises Ltd
- Marrybrown Sdn Bhd
- Secret Recipe Cakes & Café Sdn Bhd
- Tung Lok Restaurants (2000) Ltd
- Zen Corporation Group PC
Notable Milestones in Southeast Asia Food Service Market Sector
- May 2023: Inspire Brands, Inc. launched new butter variants to its Butternut portfolio.
- May 2023: Starbucks inaugurated a new store in Bird Paradise, Philippines.
- October 2023: Starbucks launched two new ice cream-based drinks in the Philippines.
In-Depth Southeast Asia Food Service Market Market Outlook
The Southeast Asia food service market is poised for continued strong growth, driven by favorable demographic trends, rising disposable incomes, and technological innovation. Strategic opportunities exist for businesses to leverage technological advancements, expand into new markets, and cater to evolving consumer preferences. Focus on health-conscious options, sustainable practices, and personalized experiences will be crucial for success. The market's future potential is substantial, promising significant returns for businesses that can adapt to the evolving dynamics of the industry.
Southeast Asia Food Service Market Segmentation
-
1. Foodservice Type
-
1.1. Cafes & Bars
-
1.1.1. By Cuisine
- 1.1.1.1. Bars & Pubs
- 1.1.1.2. Juice/Smoothie/Desserts Bars
- 1.1.1.3. Specialist Coffee & Tea Shops
-
1.1.1. By Cuisine
- 1.2. Cloud Kitchen
-
1.3. Full Service Restaurants
- 1.3.1. Asian
- 1.3.2. European
- 1.3.3. Latin American
- 1.3.4. Middle Eastern
- 1.3.5. North American
- 1.3.6. Other FSR Cuisines
-
1.4. Quick Service Restaurants
- 1.4.1. Bakeries
- 1.4.2. Burger
- 1.4.3. Ice Cream
- 1.4.4. Meat-based Cuisines
- 1.4.5. Pizza
- 1.4.6. Other QSR Cuisines
-
1.1. Cafes & Bars
-
2. Outlet
- 2.1. Chained Outlets
- 2.2. Independent Outlets
-
3. Location
- 3.1. Leisure
- 3.2. Lodging
- 3.3. Retail
- 3.4. Standalone
- 3.5. Travel
Southeast Asia Food Service Market Segmentation By Geography
-
1. North America
- 1.1. United States
- 1.2. Canada
- 1.3. Mexico
-
2. South America
- 2.1. Brazil
- 2.2. Argentina
- 2.3. Rest of South America
-
3. Europe
- 3.1. United Kingdom
- 3.2. Germany
- 3.3. France
- 3.4. Italy
- 3.5. Spain
- 3.6. Russia
- 3.7. Benelux
- 3.8. Nordics
- 3.9. Rest of Europe
-
4. Middle East & Africa
- 4.1. Turkey
- 4.2. Israel
- 4.3. GCC
- 4.4. North Africa
- 4.5. South Africa
- 4.6. Rest of Middle East & Africa
-
5. Asia Pacific
- 5.1. China
- 5.2. India
- 5.3. Japan
- 5.4. South Korea
- 5.5. ASEAN
- 5.6. Oceania
- 5.7. Rest of Asia Pacific
Southeast Asia Food Service Market Regional Market Share
Geographic Coverage of Southeast Asia Food Service Market
Southeast Asia Food Service Market REPORT HIGHLIGHTS
| Aspects | Details |
|---|---|
| Study Period | 2020-2034 |
| Base Year | 2025 |
| Estimated Year | 2026 |
| Forecast Period | 2026-2034 |
| Historical Period | 2020-2025 |
| Growth Rate | CAGR of 13.2% from 2020-2034 |
| Segmentation |
|
Table of Contents
- 1. Introduction
- 1.1. Research Scope
- 1.2. Market Segmentation
- 1.3. Research Methodology
- 1.4. Definitions and Assumptions
- 2. Executive Summary
- 2.1. Introduction
- 3. Market Dynamics
- 3.1. Introduction
- 3.2. Market Drivers
- 3.2.1. Growing Awareness of Functional Benefits of Carotenoids; Consumption of Health and Wellness Products
- 3.3. Market Restrains
- 3.3.1. High Processing Cost and Low Yield of Natural Food Colors
- 3.4. Market Trends
- 3.4.1. OTHER KEY INDUSTRY TRENDS COVERED IN THE REPORT
- 4. Market Factor Analysis
- 4.1. Porters Five Forces
- 4.2. Supply/Value Chain
- 4.3. PESTEL analysis
- 4.4. Market Entropy
- 4.5. Patent/Trademark Analysis
- 5. Global Southeast Asia Food Service Market Analysis, Insights and Forecast, 2020-2032
- 5.1. Market Analysis, Insights and Forecast - by Foodservice Type
- 5.1.1. Cafes & Bars
- 5.1.1.1. By Cuisine
- 5.1.1.1.1. Bars & Pubs
- 5.1.1.1.2. Juice/Smoothie/Desserts Bars
- 5.1.1.1.3. Specialist Coffee & Tea Shops
- 5.1.1.1. By Cuisine
- 5.1.2. Cloud Kitchen
- 5.1.3. Full Service Restaurants
- 5.1.3.1. Asian
- 5.1.3.2. European
- 5.1.3.3. Latin American
- 5.1.3.4. Middle Eastern
- 5.1.3.5. North American
- 5.1.3.6. Other FSR Cuisines
- 5.1.4. Quick Service Restaurants
- 5.1.4.1. Bakeries
- 5.1.4.2. Burger
- 5.1.4.3. Ice Cream
- 5.1.4.4. Meat-based Cuisines
- 5.1.4.5. Pizza
- 5.1.4.6. Other QSR Cuisines
- 5.1.1. Cafes & Bars
- 5.2. Market Analysis, Insights and Forecast - by Outlet
- 5.2.1. Chained Outlets
- 5.2.2. Independent Outlets
- 5.3. Market Analysis, Insights and Forecast - by Location
- 5.3.1. Leisure
- 5.3.2. Lodging
- 5.3.3. Retail
- 5.3.4. Standalone
- 5.3.5. Travel
- 5.4. Market Analysis, Insights and Forecast - by Region
- 5.4.1. North America
- 5.4.2. South America
- 5.4.3. Europe
- 5.4.4. Middle East & Africa
- 5.4.5. Asia Pacific
- 5.1. Market Analysis, Insights and Forecast - by Foodservice Type
- 6. North America Southeast Asia Food Service Market Analysis, Insights and Forecast, 2020-2032
- 6.1. Market Analysis, Insights and Forecast - by Foodservice Type
- 6.1.1. Cafes & Bars
- 6.1.1.1. By Cuisine
- 6.1.1.1.1. Bars & Pubs
- 6.1.1.1.2. Juice/Smoothie/Desserts Bars
- 6.1.1.1.3. Specialist Coffee & Tea Shops
- 6.1.1.1. By Cuisine
- 6.1.2. Cloud Kitchen
- 6.1.3. Full Service Restaurants
- 6.1.3.1. Asian
- 6.1.3.2. European
- 6.1.3.3. Latin American
- 6.1.3.4. Middle Eastern
- 6.1.3.5. North American
- 6.1.3.6. Other FSR Cuisines
- 6.1.4. Quick Service Restaurants
- 6.1.4.1. Bakeries
- 6.1.4.2. Burger
- 6.1.4.3. Ice Cream
- 6.1.4.4. Meat-based Cuisines
- 6.1.4.5. Pizza
- 6.1.4.6. Other QSR Cuisines
- 6.1.1. Cafes & Bars
- 6.2. Market Analysis, Insights and Forecast - by Outlet
- 6.2.1. Chained Outlets
- 6.2.2. Independent Outlets
- 6.3. Market Analysis, Insights and Forecast - by Location
- 6.3.1. Leisure
- 6.3.2. Lodging
- 6.3.3. Retail
- 6.3.4. Standalone
- 6.3.5. Travel
- 6.1. Market Analysis, Insights and Forecast - by Foodservice Type
- 7. South America Southeast Asia Food Service Market Analysis, Insights and Forecast, 2020-2032
- 7.1. Market Analysis, Insights and Forecast - by Foodservice Type
- 7.1.1. Cafes & Bars
- 7.1.1.1. By Cuisine
- 7.1.1.1.1. Bars & Pubs
- 7.1.1.1.2. Juice/Smoothie/Desserts Bars
- 7.1.1.1.3. Specialist Coffee & Tea Shops
- 7.1.1.1. By Cuisine
- 7.1.2. Cloud Kitchen
- 7.1.3. Full Service Restaurants
- 7.1.3.1. Asian
- 7.1.3.2. European
- 7.1.3.3. Latin American
- 7.1.3.4. Middle Eastern
- 7.1.3.5. North American
- 7.1.3.6. Other FSR Cuisines
- 7.1.4. Quick Service Restaurants
- 7.1.4.1. Bakeries
- 7.1.4.2. Burger
- 7.1.4.3. Ice Cream
- 7.1.4.4. Meat-based Cuisines
- 7.1.4.5. Pizza
- 7.1.4.6. Other QSR Cuisines
- 7.1.1. Cafes & Bars
- 7.2. Market Analysis, Insights and Forecast - by Outlet
- 7.2.1. Chained Outlets
- 7.2.2. Independent Outlets
- 7.3. Market Analysis, Insights and Forecast - by Location
- 7.3.1. Leisure
- 7.3.2. Lodging
- 7.3.3. Retail
- 7.3.4. Standalone
- 7.3.5. Travel
- 7.1. Market Analysis, Insights and Forecast - by Foodservice Type
- 8. Europe Southeast Asia Food Service Market Analysis, Insights and Forecast, 2020-2032
- 8.1. Market Analysis, Insights and Forecast - by Foodservice Type
- 8.1.1. Cafes & Bars
- 8.1.1.1. By Cuisine
- 8.1.1.1.1. Bars & Pubs
- 8.1.1.1.2. Juice/Smoothie/Desserts Bars
- 8.1.1.1.3. Specialist Coffee & Tea Shops
- 8.1.1.1. By Cuisine
- 8.1.2. Cloud Kitchen
- 8.1.3. Full Service Restaurants
- 8.1.3.1. Asian
- 8.1.3.2. European
- 8.1.3.3. Latin American
- 8.1.3.4. Middle Eastern
- 8.1.3.5. North American
- 8.1.3.6. Other FSR Cuisines
- 8.1.4. Quick Service Restaurants
- 8.1.4.1. Bakeries
- 8.1.4.2. Burger
- 8.1.4.3. Ice Cream
- 8.1.4.4. Meat-based Cuisines
- 8.1.4.5. Pizza
- 8.1.4.6. Other QSR Cuisines
- 8.1.1. Cafes & Bars
- 8.2. Market Analysis, Insights and Forecast - by Outlet
- 8.2.1. Chained Outlets
- 8.2.2. Independent Outlets
- 8.3. Market Analysis, Insights and Forecast - by Location
- 8.3.1. Leisure
- 8.3.2. Lodging
- 8.3.3. Retail
- 8.3.4. Standalone
- 8.3.5. Travel
- 8.1. Market Analysis, Insights and Forecast - by Foodservice Type
- 9. Middle East & Africa Southeast Asia Food Service Market Analysis, Insights and Forecast, 2020-2032
- 9.1. Market Analysis, Insights and Forecast - by Foodservice Type
- 9.1.1. Cafes & Bars
- 9.1.1.1. By Cuisine
- 9.1.1.1.1. Bars & Pubs
- 9.1.1.1.2. Juice/Smoothie/Desserts Bars
- 9.1.1.1.3. Specialist Coffee & Tea Shops
- 9.1.1.1. By Cuisine
- 9.1.2. Cloud Kitchen
- 9.1.3. Full Service Restaurants
- 9.1.3.1. Asian
- 9.1.3.2. European
- 9.1.3.3. Latin American
- 9.1.3.4. Middle Eastern
- 9.1.3.5. North American
- 9.1.3.6. Other FSR Cuisines
- 9.1.4. Quick Service Restaurants
- 9.1.4.1. Bakeries
- 9.1.4.2. Burger
- 9.1.4.3. Ice Cream
- 9.1.4.4. Meat-based Cuisines
- 9.1.4.5. Pizza
- 9.1.4.6. Other QSR Cuisines
- 9.1.1. Cafes & Bars
- 9.2. Market Analysis, Insights and Forecast - by Outlet
- 9.2.1. Chained Outlets
- 9.2.2. Independent Outlets
- 9.3. Market Analysis, Insights and Forecast - by Location
- 9.3.1. Leisure
- 9.3.2. Lodging
- 9.3.3. Retail
- 9.3.4. Standalone
- 9.3.5. Travel
- 9.1. Market Analysis, Insights and Forecast - by Foodservice Type
- 10. Asia Pacific Southeast Asia Food Service Market Analysis, Insights and Forecast, 2020-2032
- 10.1. Market Analysis, Insights and Forecast - by Foodservice Type
- 10.1.1. Cafes & Bars
- 10.1.1.1. By Cuisine
- 10.1.1.1.1. Bars & Pubs
- 10.1.1.1.2. Juice/Smoothie/Desserts Bars
- 10.1.1.1.3. Specialist Coffee & Tea Shops
- 10.1.1.1. By Cuisine
- 10.1.2. Cloud Kitchen
- 10.1.3. Full Service Restaurants
- 10.1.3.1. Asian
- 10.1.3.2. European
- 10.1.3.3. Latin American
- 10.1.3.4. Middle Eastern
- 10.1.3.5. North American
- 10.1.3.6. Other FSR Cuisines
- 10.1.4. Quick Service Restaurants
- 10.1.4.1. Bakeries
- 10.1.4.2. Burger
- 10.1.4.3. Ice Cream
- 10.1.4.4. Meat-based Cuisines
- 10.1.4.5. Pizza
- 10.1.4.6. Other QSR Cuisines
- 10.1.1. Cafes & Bars
- 10.2. Market Analysis, Insights and Forecast - by Outlet
- 10.2.1. Chained Outlets
- 10.2.2. Independent Outlets
- 10.3. Market Analysis, Insights and Forecast - by Location
- 10.3.1. Leisure
- 10.3.2. Lodging
- 10.3.3. Retail
- 10.3.4. Standalone
- 10.3.5. Travel
- 10.1. Market Analysis, Insights and Forecast - by Foodservice Type
- 11. Competitive Analysis
- 11.1. Global Market Share Analysis 2025
- 11.2. Company Profiles
- 11.2.1 Zen Corporation Group PC
- 11.2.1.1. Overview
- 11.2.1.2. Products
- 11.2.1.3. SWOT Analysis
- 11.2.1.4. Recent Developments
- 11.2.1.5. Financials (Based on Availability)
- 11.2.2 Yum! Brands Inc
- 11.2.2.1. Overview
- 11.2.2.2. Products
- 11.2.2.3. SWOT Analysis
- 11.2.2.4. Recent Developments
- 11.2.2.5. Financials (Based on Availability)
- 11.2.3 Doctor's Associates Inc
- 11.2.3.1. Overview
- 11.2.3.2. Products
- 11.2.3.3. SWOT Analysis
- 11.2.3.4. Recent Developments
- 11.2.3.5. Financials (Based on Availability)
- 11.2.4 Inspire Brands Inc
- 11.2.4.1. Overview
- 11.2.4.2. Products
- 11.2.4.3. SWOT Analysis
- 11.2.4.4. Recent Developments
- 11.2.4.5. Financials (Based on Availability)
- 11.2.5 Thai Beverage PCL
- 11.2.5.1. Overview
- 11.2.5.2. Products
- 11.2.5.3. SWOT Analysis
- 11.2.5.4. Recent Developments
- 11.2.5.5. Financials (Based on Availability)
- 11.2.6 Nando's Group Holdings Limited
- 11.2.6.1. Overview
- 11.2.6.2. Products
- 11.2.6.3. SWOT Analysis
- 11.2.6.4. Recent Developments
- 11.2.6.5. Financials (Based on Availability)
- 11.2.7 Jollibee Foods Corporation
- 11.2.7.1. Overview
- 11.2.7.2. Products
- 11.2.7.3. SWOT Analysis
- 11.2.7.4. Recent Developments
- 11.2.7.5. Financials (Based on Availability)
- 11.2.8 The Wendy's Company
- 11.2.8.1. Overview
- 11.2.8.2. Products
- 11.2.8.3. SWOT Analysis
- 11.2.8.4. Recent Developments
- 11.2.8.5. Financials (Based on Availability)
- 11.2.9 Secret Recipe Cakes & Café Sdn Bhd
- 11.2.9.1. Overview
- 11.2.9.2. Products
- 11.2.9.3. SWOT Analysis
- 11.2.9.4. Recent Developments
- 11.2.9.5. Financials (Based on Availability)
- 11.2.10 Tung Lok Restaurants (2000) Ltd
- 11.2.10.1. Overview
- 11.2.10.2. Products
- 11.2.10.3. SWOT Analysis
- 11.2.10.4. Recent Developments
- 11.2.10.5. Financials (Based on Availability)
- 11.2.11 Domino's Pizza Enterprises Ltd
- 11.2.11.1. Overview
- 11.2.11.2. Products
- 11.2.11.3. SWOT Analysis
- 11.2.11.4. Recent Developments
- 11.2.11.5. Financials (Based on Availability)
- 11.2.12 Starbucks Corporation
- 11.2.12.1. Overview
- 11.2.12.2. Products
- 11.2.12.3. SWOT Analysis
- 11.2.12.4. Recent Developments
- 11.2.12.5. Financials (Based on Availability)
- 11.2.13 Marrybrown Sdn Bhd
- 11.2.13.1. Overview
- 11.2.13.2. Products
- 11.2.13.3. SWOT Analysis
- 11.2.13.4. Recent Developments
- 11.2.13.5. Financials (Based on Availability)
- 11.2.14 Minor International PCL
- 11.2.14.1. Overview
- 11.2.14.2. Products
- 11.2.14.3. SWOT Analysis
- 11.2.14.4. Recent Developments
- 11.2.14.5. Financials (Based on Availability)
- 11.2.15 Restaurant Brands International Inc
- 11.2.15.1. Overview
- 11.2.15.2. Products
- 11.2.15.3. SWOT Analysis
- 11.2.15.4. Recent Developments
- 11.2.15.5. Financials (Based on Availability)
- 11.2.16 McDonald's Corporation
- 11.2.16.1. Overview
- 11.2.16.2. Products
- 11.2.16.3. SWOT Analysis
- 11.2.16.4. Recent Developments
- 11.2.16.5. Financials (Based on Availability)
- 11.2.1 Zen Corporation Group PC
List of Figures
- Figure 1: Global Southeast Asia Food Service Market Revenue Breakdown (billion, %) by Region 2025 & 2033
- Figure 2: North America Southeast Asia Food Service Market Revenue (billion), by Foodservice Type 2025 & 2033
- Figure 3: North America Southeast Asia Food Service Market Revenue Share (%), by Foodservice Type 2025 & 2033
- Figure 4: North America Southeast Asia Food Service Market Revenue (billion), by Outlet 2025 & 2033
- Figure 5: North America Southeast Asia Food Service Market Revenue Share (%), by Outlet 2025 & 2033
- Figure 6: North America Southeast Asia Food Service Market Revenue (billion), by Location 2025 & 2033
- Figure 7: North America Southeast Asia Food Service Market Revenue Share (%), by Location 2025 & 2033
- Figure 8: North America Southeast Asia Food Service Market Revenue (billion), by Country 2025 & 2033
- Figure 9: North America Southeast Asia Food Service Market Revenue Share (%), by Country 2025 & 2033
- Figure 10: South America Southeast Asia Food Service Market Revenue (billion), by Foodservice Type 2025 & 2033
- Figure 11: South America Southeast Asia Food Service Market Revenue Share (%), by Foodservice Type 2025 & 2033
- Figure 12: South America Southeast Asia Food Service Market Revenue (billion), by Outlet 2025 & 2033
- Figure 13: South America Southeast Asia Food Service Market Revenue Share (%), by Outlet 2025 & 2033
- Figure 14: South America Southeast Asia Food Service Market Revenue (billion), by Location 2025 & 2033
- Figure 15: South America Southeast Asia Food Service Market Revenue Share (%), by Location 2025 & 2033
- Figure 16: South America Southeast Asia Food Service Market Revenue (billion), by Country 2025 & 2033
- Figure 17: South America Southeast Asia Food Service Market Revenue Share (%), by Country 2025 & 2033
- Figure 18: Europe Southeast Asia Food Service Market Revenue (billion), by Foodservice Type 2025 & 2033
- Figure 19: Europe Southeast Asia Food Service Market Revenue Share (%), by Foodservice Type 2025 & 2033
- Figure 20: Europe Southeast Asia Food Service Market Revenue (billion), by Outlet 2025 & 2033
- Figure 21: Europe Southeast Asia Food Service Market Revenue Share (%), by Outlet 2025 & 2033
- Figure 22: Europe Southeast Asia Food Service Market Revenue (billion), by Location 2025 & 2033
- Figure 23: Europe Southeast Asia Food Service Market Revenue Share (%), by Location 2025 & 2033
- Figure 24: Europe Southeast Asia Food Service Market Revenue (billion), by Country 2025 & 2033
- Figure 25: Europe Southeast Asia Food Service Market Revenue Share (%), by Country 2025 & 2033
- Figure 26: Middle East & Africa Southeast Asia Food Service Market Revenue (billion), by Foodservice Type 2025 & 2033
- Figure 27: Middle East & Africa Southeast Asia Food Service Market Revenue Share (%), by Foodservice Type 2025 & 2033
- Figure 28: Middle East & Africa Southeast Asia Food Service Market Revenue (billion), by Outlet 2025 & 2033
- Figure 29: Middle East & Africa Southeast Asia Food Service Market Revenue Share (%), by Outlet 2025 & 2033
- Figure 30: Middle East & Africa Southeast Asia Food Service Market Revenue (billion), by Location 2025 & 2033
- Figure 31: Middle East & Africa Southeast Asia Food Service Market Revenue Share (%), by Location 2025 & 2033
- Figure 32: Middle East & Africa Southeast Asia Food Service Market Revenue (billion), by Country 2025 & 2033
- Figure 33: Middle East & Africa Southeast Asia Food Service Market Revenue Share (%), by Country 2025 & 2033
- Figure 34: Asia Pacific Southeast Asia Food Service Market Revenue (billion), by Foodservice Type 2025 & 2033
- Figure 35: Asia Pacific Southeast Asia Food Service Market Revenue Share (%), by Foodservice Type 2025 & 2033
- Figure 36: Asia Pacific Southeast Asia Food Service Market Revenue (billion), by Outlet 2025 & 2033
- Figure 37: Asia Pacific Southeast Asia Food Service Market Revenue Share (%), by Outlet 2025 & 2033
- Figure 38: Asia Pacific Southeast Asia Food Service Market Revenue (billion), by Location 2025 & 2033
- Figure 39: Asia Pacific Southeast Asia Food Service Market Revenue Share (%), by Location 2025 & 2033
- Figure 40: Asia Pacific Southeast Asia Food Service Market Revenue (billion), by Country 2025 & 2033
- Figure 41: Asia Pacific Southeast Asia Food Service Market Revenue Share (%), by Country 2025 & 2033
List of Tables
- Table 1: Global Southeast Asia Food Service Market Revenue billion Forecast, by Foodservice Type 2020 & 2033
- Table 2: Global Southeast Asia Food Service Market Revenue billion Forecast, by Outlet 2020 & 2033
- Table 3: Global Southeast Asia Food Service Market Revenue billion Forecast, by Location 2020 & 2033
- Table 4: Global Southeast Asia Food Service Market Revenue billion Forecast, by Region 2020 & 2033
- Table 5: Global Southeast Asia Food Service Market Revenue billion Forecast, by Foodservice Type 2020 & 2033
- Table 6: Global Southeast Asia Food Service Market Revenue billion Forecast, by Outlet 2020 & 2033
- Table 7: Global Southeast Asia Food Service Market Revenue billion Forecast, by Location 2020 & 2033
- Table 8: Global Southeast Asia Food Service Market Revenue billion Forecast, by Country 2020 & 2033
- Table 9: United States Southeast Asia Food Service Market Revenue (billion) Forecast, by Application 2020 & 2033
- Table 10: Canada Southeast Asia Food Service Market Revenue (billion) Forecast, by Application 2020 & 2033
- Table 11: Mexico Southeast Asia Food Service Market Revenue (billion) Forecast, by Application 2020 & 2033
- Table 12: Global Southeast Asia Food Service Market Revenue billion Forecast, by Foodservice Type 2020 & 2033
- Table 13: Global Southeast Asia Food Service Market Revenue billion Forecast, by Outlet 2020 & 2033
- Table 14: Global Southeast Asia Food Service Market Revenue billion Forecast, by Location 2020 & 2033
- Table 15: Global Southeast Asia Food Service Market Revenue billion Forecast, by Country 2020 & 2033
- Table 16: Brazil Southeast Asia Food Service Market Revenue (billion) Forecast, by Application 2020 & 2033
- Table 17: Argentina Southeast Asia Food Service Market Revenue (billion) Forecast, by Application 2020 & 2033
- Table 18: Rest of South America Southeast Asia Food Service Market Revenue (billion) Forecast, by Application 2020 & 2033
- Table 19: Global Southeast Asia Food Service Market Revenue billion Forecast, by Foodservice Type 2020 & 2033
- Table 20: Global Southeast Asia Food Service Market Revenue billion Forecast, by Outlet 2020 & 2033
- Table 21: Global Southeast Asia Food Service Market Revenue billion Forecast, by Location 2020 & 2033
- Table 22: Global Southeast Asia Food Service Market Revenue billion Forecast, by Country 2020 & 2033
- Table 23: United Kingdom Southeast Asia Food Service Market Revenue (billion) Forecast, by Application 2020 & 2033
- Table 24: Germany Southeast Asia Food Service Market Revenue (billion) Forecast, by Application 2020 & 2033
- Table 25: France Southeast Asia Food Service Market Revenue (billion) Forecast, by Application 2020 & 2033
- Table 26: Italy Southeast Asia Food Service Market Revenue (billion) Forecast, by Application 2020 & 2033
- Table 27: Spain Southeast Asia Food Service Market Revenue (billion) Forecast, by Application 2020 & 2033
- Table 28: Russia Southeast Asia Food Service Market Revenue (billion) Forecast, by Application 2020 & 2033
- Table 29: Benelux Southeast Asia Food Service Market Revenue (billion) Forecast, by Application 2020 & 2033
- Table 30: Nordics Southeast Asia Food Service Market Revenue (billion) Forecast, by Application 2020 & 2033
- Table 31: Rest of Europe Southeast Asia Food Service Market Revenue (billion) Forecast, by Application 2020 & 2033
- Table 32: Global Southeast Asia Food Service Market Revenue billion Forecast, by Foodservice Type 2020 & 2033
- Table 33: Global Southeast Asia Food Service Market Revenue billion Forecast, by Outlet 2020 & 2033
- Table 34: Global Southeast Asia Food Service Market Revenue billion Forecast, by Location 2020 & 2033
- Table 35: Global Southeast Asia Food Service Market Revenue billion Forecast, by Country 2020 & 2033
- Table 36: Turkey Southeast Asia Food Service Market Revenue (billion) Forecast, by Application 2020 & 2033
- Table 37: Israel Southeast Asia Food Service Market Revenue (billion) Forecast, by Application 2020 & 2033
- Table 38: GCC Southeast Asia Food Service Market Revenue (billion) Forecast, by Application 2020 & 2033
- Table 39: North Africa Southeast Asia Food Service Market Revenue (billion) Forecast, by Application 2020 & 2033
- Table 40: South Africa Southeast Asia Food Service Market Revenue (billion) Forecast, by Application 2020 & 2033
- Table 41: Rest of Middle East & Africa Southeast Asia Food Service Market Revenue (billion) Forecast, by Application 2020 & 2033
- Table 42: Global Southeast Asia Food Service Market Revenue billion Forecast, by Foodservice Type 2020 & 2033
- Table 43: Global Southeast Asia Food Service Market Revenue billion Forecast, by Outlet 2020 & 2033
- Table 44: Global Southeast Asia Food Service Market Revenue billion Forecast, by Location 2020 & 2033
- Table 45: Global Southeast Asia Food Service Market Revenue billion Forecast, by Country 2020 & 2033
- Table 46: China Southeast Asia Food Service Market Revenue (billion) Forecast, by Application 2020 & 2033
- Table 47: India Southeast Asia Food Service Market Revenue (billion) Forecast, by Application 2020 & 2033
- Table 48: Japan Southeast Asia Food Service Market Revenue (billion) Forecast, by Application 2020 & 2033
- Table 49: South Korea Southeast Asia Food Service Market Revenue (billion) Forecast, by Application 2020 & 2033
- Table 50: ASEAN Southeast Asia Food Service Market Revenue (billion) Forecast, by Application 2020 & 2033
- Table 51: Oceania Southeast Asia Food Service Market Revenue (billion) Forecast, by Application 2020 & 2033
- Table 52: Rest of Asia Pacific Southeast Asia Food Service Market Revenue (billion) Forecast, by Application 2020 & 2033
Frequently Asked Questions
1. What is the projected Compound Annual Growth Rate (CAGR) of the Southeast Asia Food Service Market?
The projected CAGR is approximately 13.2%.
2. Which companies are prominent players in the Southeast Asia Food Service Market?
Key companies in the market include Zen Corporation Group PC, Yum! Brands Inc, Doctor's Associates Inc, Inspire Brands Inc, Thai Beverage PCL, Nando's Group Holdings Limited, Jollibee Foods Corporation, The Wendy's Company, Secret Recipe Cakes & Café Sdn Bhd, Tung Lok Restaurants (2000) Ltd, Domino's Pizza Enterprises Ltd, Starbucks Corporation, Marrybrown Sdn Bhd, Minor International PCL, Restaurant Brands International Inc, McDonald's Corporation.
3. What are the main segments of the Southeast Asia Food Service Market?
The market segments include Foodservice Type, Outlet, Location.
4. Can you provide details about the market size?
The market size is estimated to be USD 223.8 billion as of 2022.
5. What are some drivers contributing to market growth?
Growing Awareness of Functional Benefits of Carotenoids; Consumption of Health and Wellness Products.
6. What are the notable trends driving market growth?
OTHER KEY INDUSTRY TRENDS COVERED IN THE REPORT.
7. Are there any restraints impacting market growth?
High Processing Cost and Low Yield of Natural Food Colors.
8. Can you provide examples of recent developments in the market?
October 2023: Starbucks launched two new drinks with the addition of ice cream in the Philippines.May 2023: Starbucks inaugurated the latest rustic finish store in Bird Paradise, and the structure of the store is designed like a wooden hut.May 2023: Inspire Brands, Inc. launched new butter variants to its Butternut portfolio. These variants include the Plain Butternut, Choco Almond Butternut, Ube Cheese Butternut, Strawberry Butternut, Cheesy Butternut, and Choco Butternut.
9. What pricing options are available for accessing the report?
Pricing options include single-user, multi-user, and enterprise licenses priced at USD 3800, USD 4500, and USD 5800 respectively.
10. Is the market size provided in terms of value or volume?
The market size is provided in terms of value, measured in billion.
11. Are there any specific market keywords associated with the report?
Yes, the market keyword associated with the report is "Southeast Asia Food Service Market," which aids in identifying and referencing the specific market segment covered.
12. How do I determine which pricing option suits my needs best?
The pricing options vary based on user requirements and access needs. Individual users may opt for single-user licenses, while businesses requiring broader access may choose multi-user or enterprise licenses for cost-effective access to the report.
13. Are there any additional resources or data provided in the Southeast Asia Food Service Market report?
While the report offers comprehensive insights, it's advisable to review the specific contents or supplementary materials provided to ascertain if additional resources or data are available.
14. How can I stay updated on further developments or reports in the Southeast Asia Food Service Market?
To stay informed about further developments, trends, and reports in the Southeast Asia Food Service Market, consider subscribing to industry newsletters, following relevant companies and organizations, or regularly checking reputable industry news sources and publications.
Methodology
Step 1 - Identification of Relevant Samples Size from Population Database


Step 2 - Approaches for Defining Global Market Size (Value, Volume* & Price*)

Note*: In applicable scenarios
Step 3 - Data Sources
Primary Research
- Web Analytics
- Survey Reports
- Research Institute
- Latest Research Reports
- Opinion Leaders
Secondary Research
- Annual Reports
- White Paper
- Latest Press Release
- Industry Association
- Paid Database
- Investor Presentations

Step 4 - Data Triangulation
Involves using different sources of information in order to increase the validity of a study
These sources are likely to be stakeholders in a program - participants, other researchers, program staff, other community members, and so on.
Then we put all data in single framework & apply various statistical tools to find out the dynamic on the market.
During the analysis stage, feedback from the stakeholder groups would be compared to determine areas of agreement as well as areas of divergence