

Key Insights
The South American water treatment chemicals market is poised for significant expansion, driven by escalating urbanization, industrial development, and increasingly stringent environmental mandates. Projections indicate a compound annual growth rate (CAGR) of 7.4% from 2024 to 2033, with the market size anticipated to reach $2.9 billion. This growth trajectory is underpinned by a rising demand for potable water in both municipal and industrial applications. Factors such as the increased incidence of waterborne diseases and the imperative for effective water purification solutions are accelerating this market expansion. The market is strategically segmented by chemical type, application (municipal, industrial), and key South American regions. Leading industry players, including Nouryon, Ecolab, Solenis, Kemira, Solvay, Lonza, Kurita Water Industries, SNF, and Suez, are actively engaged in research and development to deliver advanced, sustainable water treatment solutions. Navigating economic volatility and infrastructure constraints in select territories presents ongoing market challenges. Furthermore, fluctuations in raw material costs and a growing emphasis on eco-friendly chemical alternatives are key influences on market dynamics.
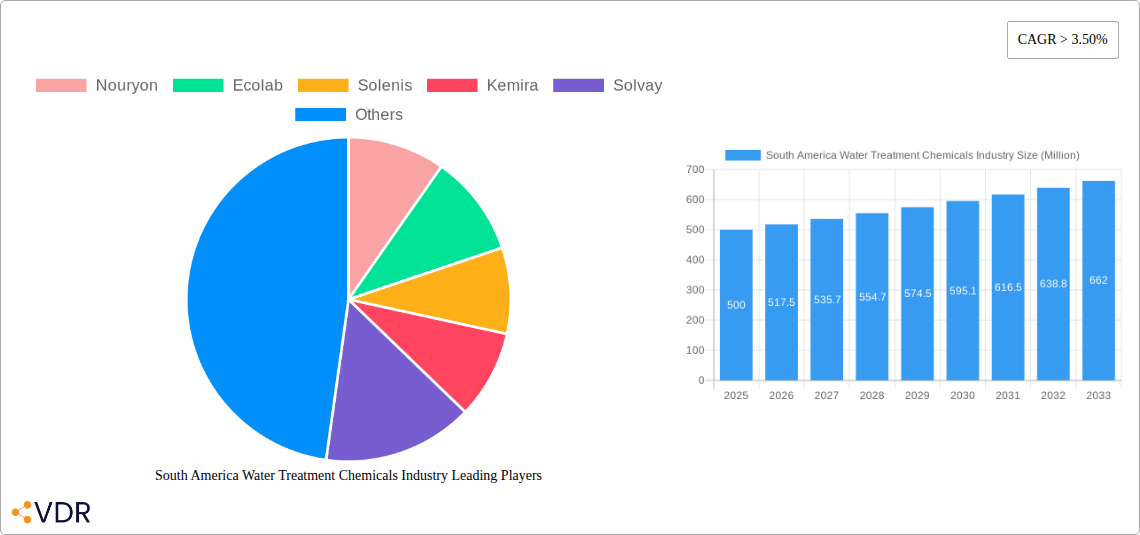
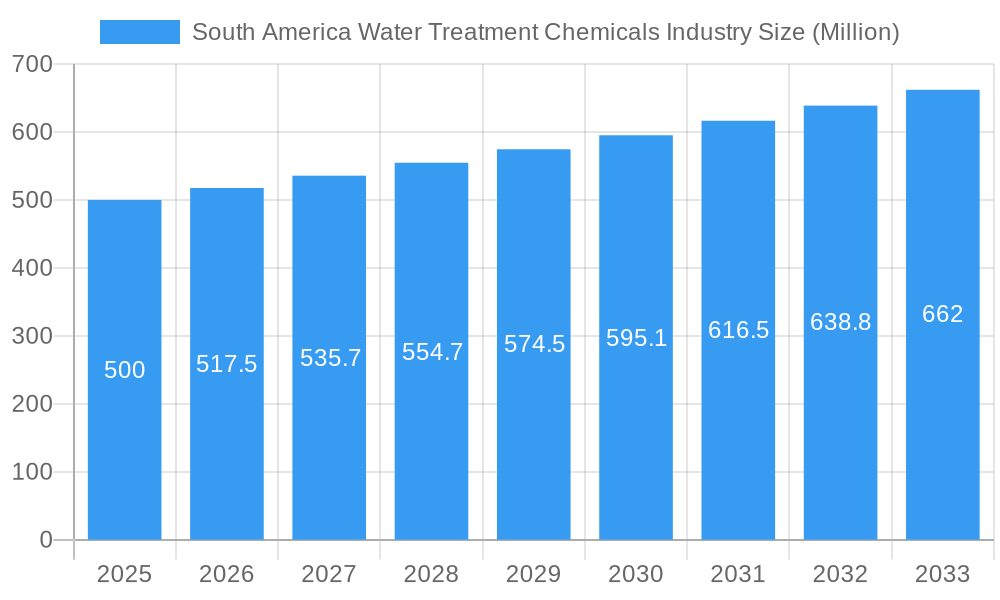
South America Water Treatment Chemicals Industry Market Size (In Billion)
The projected forecast period (2025-2033) signifies sustained market growth, particularly within South America's rapidly developing economies. Enhanced government investment in water infrastructure and a heightened focus on water conservation are expected to significantly boost demand. Market segmentation presents strategic opportunities for specialized chemical manufacturers addressing specific industry requirements. Companies are prioritizing the development of innovative technologies, such as advanced oxidation processes and membrane filtration, which are pivotal in shaping the future market landscape. Intense competition is anticipated, with a focus on strategic mergers, acquisitions, and partnerships to broaden market reach and product portfolios. This consistent growth pattern underscores substantial investment potential within this dynamic sector.
South America Water Treatment Chemicals Industry Company Market Share
South America Water Treatment Chemicals Industry: Market Report 2019-2033
This comprehensive report provides an in-depth analysis of the South America water treatment chemicals market, encompassing market dynamics, growth trends, regional segmentation, product landscape, and key players. The study period covers 2019-2033, with 2025 as the base year and a forecast period of 2025-2033. The report is essential for industry professionals, investors, and stakeholders seeking a comprehensive understanding of this dynamic market. The parent market is the broader South American chemicals market, while the child market is specifically water treatment chemicals within that region.
South America Water Treatment Chemicals Industry Market Dynamics & Structure
This section analyzes the competitive landscape, technological advancements, regulatory environment, and market trends influencing the South American water treatment chemicals market. The market exhibits moderate concentration, with several multinational corporations and regional players vying for market share. Technological innovation is driven by the need for more sustainable and efficient treatment solutions. Stringent environmental regulations are shaping product development and adoption. The market is susceptible to fluctuations in raw material prices and economic conditions. Mergers and acquisitions are occurring at a steady pace, consolidating market power and driving innovation.
- Market Concentration: Moderately concentrated, with top 5 players holding approximately xx% market share (2025).
- Technological Innovation Drivers: Increasing demand for sustainable and efficient water treatment solutions.
- Regulatory Framework: Stringent environmental regulations impacting product development and adoption.
- Competitive Product Substitutes: Limited, with specialized chemicals often needed for specific applications.
- End-User Demographics: Primarily municipal water utilities, industrial facilities, and commercial entities.
- M&A Trends: Steady pace of mergers and acquisitions, consolidating market power and driving innovation. xx M&A deals occurred between 2019 and 2024.
South America Water Treatment Chemicals Industry Growth Trends & Insights
The South American water treatment chemicals market is experiencing robust growth, driven by factors such as increasing urbanization, industrialization, and stringent water quality regulations. The market size is projected to reach xx million units by 2033, exhibiting a CAGR of xx% during the forecast period (2025-2033). Technological advancements are driving adoption rates, leading to increased efficiency and cost savings. Consumer behavior is shifting towards more environmentally friendly and sustainable solutions.
This growth is further fueled by increasing awareness about water scarcity and the need for efficient water management practices across various sectors, including municipal water treatment, industrial processes, and commercial applications. The adoption of advanced oxidation processes (AOPs) and membrane filtration technologies is also influencing market growth.
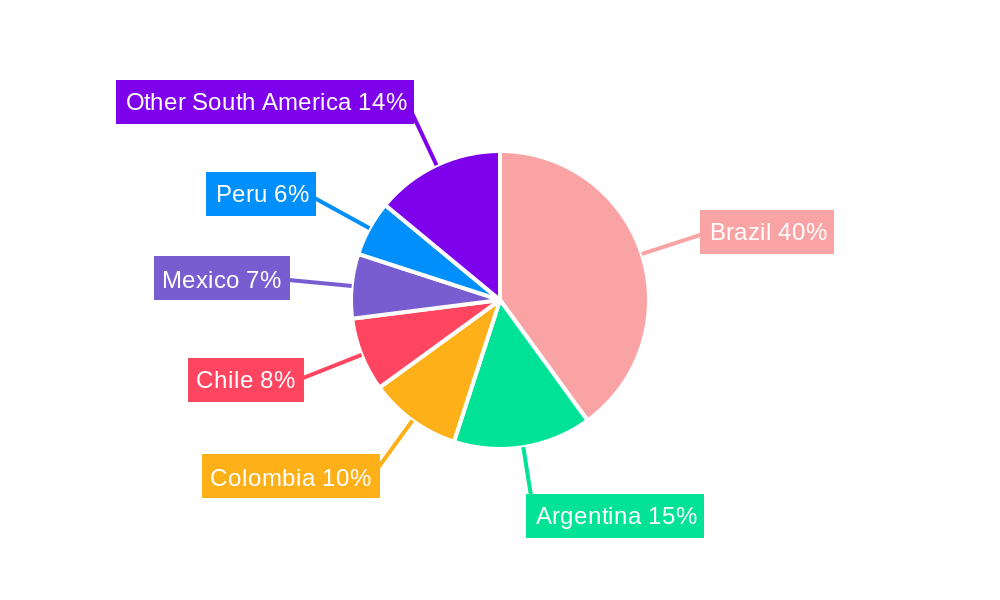
Dominant Regions, Countries, or Segments in South America Water Treatment Chemicals Industry
Brazil holds the largest market share in the South American water treatment chemicals industry, driven by its significant industrial base, expanding urban population, and government initiatives promoting water infrastructure development. Other key markets include Argentina, Colombia, and Chile. The industrial segment is the largest contributor, followed by the municipal segment. Growth is primarily fueled by government investments in water infrastructure, increasing industrial activity, and rising environmental awareness.
- Brazil: Largest market share due to industrial development, urbanization, and government initiatives.
- Argentina: Significant market due to industrial activities and growing population.
- Colombia & Chile: Growing markets with significant investment in water infrastructure.
- Key Drivers: Government investments in water infrastructure, industrial expansion, and environmental regulations.
South America Water Treatment Chemicals Industry Product Landscape
The product landscape encompasses a wide range of chemicals, including coagulants, flocculants, disinfectants, and corrosion inhibitors. Recent innovations focus on developing eco-friendly and high-performance products. Product differentiation is achieved through improved efficacy, reduced environmental impact, and specialized applications for various water sources and treatment processes. These innovations cater to the growing demand for sustainable and efficient water treatment solutions in the region.
Key Drivers, Barriers & Challenges in South America Water Treatment Chemicals Industry
Key Drivers: Increasing urbanization, industrialization, stringent environmental regulations, and government investments in water infrastructure are the primary growth drivers. Technological advancements, such as membrane filtration and AOPs, are also accelerating market growth.
Challenges & Restraints: Fluctuations in raw material prices, economic volatility, and supply chain disruptions pose significant challenges. Regulatory hurdles and competition from established players can hinder market entry for new participants. The presence of numerous small and medium-sized enterprises (SMEs) can also present a complex competitive environment.
Emerging Opportunities in South America Water Treatment Chemicals Industry
Untapped markets in rural areas and the growing adoption of advanced water treatment technologies present significant opportunities. There's a rising demand for specialized chemicals for treating industrial wastewater and brackish water. The increasing focus on sustainable practices and circular economy models offers significant opportunities for eco-friendly water treatment solutions.
Growth Accelerators in the South America Water Treatment Chemicals Industry
Technological breakthroughs in advanced oxidation processes (AOPs), membrane technology, and intelligent water management systems will significantly propel market growth. Strategic partnerships between chemical manufacturers and water treatment companies can foster innovation and accelerate market penetration. Expansion into underserved regions through targeted marketing strategies and distribution networks will unlock significant growth potential.
Notable Milestones in South America Water Treatment Chemicals Industry Sector
- 2020: Ecolab launched a new range of sustainable water treatment chemicals.
- 2021: Solenis acquired a regional water treatment company, expanding its market presence.
- 2022: The Brazilian government implemented stricter regulations on industrial wastewater discharge.
- 2023: Nouryon partnered with a local distributor to expand its reach in the Andean region.
- 2024: Kemira invested in a new production facility in Brazil to enhance its capacity.
In-Depth South America Water Treatment Chemicals Industry Market Outlook
The South American water treatment chemicals market is poised for substantial growth over the next decade, driven by continued urbanization, industrial expansion, and rising environmental awareness. Strategic partnerships, technological advancements, and targeted market expansion strategies will be crucial for maximizing market potential. Companies focusing on sustainable and innovative solutions will gain a competitive advantage in this dynamic market.
South America Water Treatment Chemicals Industry Segmentation
-
1. Product Type
- 1.1. Flocculant & Coagulants
- 1.2. Biocides & Disinfectants
- 1.3. Defoamers & Defoaming Agents
- 1.4. pH & Adjusters & Softeners
- 1.5. Scale & Corrosion Inhibitors
- 1.6. Others
-
2. End-user Industry
- 2.1. Power
- 2.2. Oil & Gas
- 2.3. Chemical Manufcaturing
- 2.4. Mining & Mineral Processing
- 2.5. Mining and Mineral Processing
- 2.6. Food & Beverage
- 2.7. Pulp & Ppaer
- 2.8. Others
-
3. Geography
- 3.1. Brazil
- 3.2. Argentina
- 3.3. Rest of South America
South America Water Treatment Chemicals Industry Segmentation By Geography
- 1. Brazil
- 2. Argentina
- 3. Rest of South America
South America Water Treatment Chemicals Industry Regional Market Share
Geographic Coverage of South America Water Treatment Chemicals Industry
South America Water Treatment Chemicals Industry REPORT HIGHLIGHTS
| Aspects | Details |
|---|---|
| Study Period | 2020-2034 |
| Base Year | 2025 |
| Estimated Year | 2026 |
| Forecast Period | 2026-2034 |
| Historical Period | 2020-2025 |
| Growth Rate | CAGR of 7.4% from 2020-2034 |
| Segmentation |
|
Table of Contents
- 1. Introduction
- 1.1. Research Scope
- 1.2. Market Segmentation
- 1.3. Research Objective
- 1.4. Definitions and Assumptions
- 2. Executive Summary
- 2.1. Market Snapshot
- 3. Market Dynamics
- 3.1. Market Drivers
- 3.2. Market Restrains
- 3.3. Market Trends
- 3.4. Market Opportunities
- 4. Market Factor Analysis
- 4.1. Porters Five Forces
- 4.1.1. Bargaining Power of Suppliers
- 4.1.2. Bargaining Power of Buyers
- 4.1.3. Threat of New Entrants
- 4.1.4. Threat of Substitutes
- 4.1.5. Competitive Rivalry
- 4.2. PESTEL analysis
- 4.3. BCG Analysis
- 4.3.1. Stars (High Growth, High Market Share)
- 4.3.2. Cash Cows (Low Growth, High Market Share)
- 4.3.3. Question Mark (High Growth, Low Market Share)
- 4.3.4. Dogs (Low Growth, Low Market Share)
- 4.4. Ansoff Matrix Analysis
- 4.5. Supply Chain Analysis
- 4.6. Regulatory Landscape
- 4.7. Current Market Potential and Opportunity Assessment (TAM–SAM–SOM Framework)
- 4.8. VDR Analyst Note
- 4.1. Porters Five Forces
- 5. Market Analysis, Insights and Forecast 2021-2033
- 5.1. Market Analysis, Insights and Forecast - by Product Type
- 5.1.1. Flocculant & Coagulants
- 5.1.2. Biocides & Disinfectants
- 5.1.3. Defoamers & Defoaming Agents
- 5.1.4. pH & Adjusters & Softeners
- 5.1.5. Scale & Corrosion Inhibitors
- 5.1.6. Others
- 5.2. Market Analysis, Insights and Forecast - by End-user Industry
- 5.2.1. Power
- 5.2.2. Oil & Gas
- 5.2.3. Chemical Manufcaturing
- 5.2.4. Mining & Mineral Processing
- 5.2.5. Mining and Mineral Processing
- 5.2.6. Food & Beverage
- 5.2.7. Pulp & Ppaer
- 5.2.8. Others
- 5.3. Market Analysis, Insights and Forecast - by Geography
- 5.3.1. Brazil
- 5.3.2. Argentina
- 5.3.3. Rest of South America
- 5.4. Market Analysis, Insights and Forecast - by Region
- 5.4.1. Brazil
- 5.4.2. Argentina
- 5.4.3. Rest of South America
- 5.1. Market Analysis, Insights and Forecast - by Product Type
- 6. Global South America Water Treatment Chemicals Industry Analysis, Insights and Forecast, 2021-2033
- 6.1. Market Analysis, Insights and Forecast - by Product Type
- 6.1.1. Flocculant & Coagulants
- 6.1.2. Biocides & Disinfectants
- 6.1.3. Defoamers & Defoaming Agents
- 6.1.4. pH & Adjusters & Softeners
- 6.1.5. Scale & Corrosion Inhibitors
- 6.1.6. Others
- 6.2. Market Analysis, Insights and Forecast - by End-user Industry
- 6.2.1. Power
- 6.2.2. Oil & Gas
- 6.2.3. Chemical Manufcaturing
- 6.2.4. Mining & Mineral Processing
- 6.2.5. Mining and Mineral Processing
- 6.2.6. Food & Beverage
- 6.2.7. Pulp & Ppaer
- 6.2.8. Others
- 6.3. Market Analysis, Insights and Forecast - by Geography
- 6.3.1. Brazil
- 6.3.2. Argentina
- 6.3.3. Rest of South America
- 6.1. Market Analysis, Insights and Forecast - by Product Type
- 7. Brazil South America Water Treatment Chemicals Industry Analysis, Insights and Forecast, 2021-2033
- 7.1. Market Analysis, Insights and Forecast - by Product Type
- 7.1.1. Flocculant & Coagulants
- 7.1.2. Biocides & Disinfectants
- 7.1.3. Defoamers & Defoaming Agents
- 7.1.4. pH & Adjusters & Softeners
- 7.1.5. Scale & Corrosion Inhibitors
- 7.1.6. Others
- 7.2. Market Analysis, Insights and Forecast - by End-user Industry
- 7.2.1. Power
- 7.2.2. Oil & Gas
- 7.2.3. Chemical Manufcaturing
- 7.2.4. Mining & Mineral Processing
- 7.2.5. Mining and Mineral Processing
- 7.2.6. Food & Beverage
- 7.2.7. Pulp & Ppaer
- 7.2.8. Others
- 7.3. Market Analysis, Insights and Forecast - by Geography
- 7.3.1. Brazil
- 7.3.2. Argentina
- 7.3.3. Rest of South America
- 7.1. Market Analysis, Insights and Forecast - by Product Type
- 8. Argentina South America Water Treatment Chemicals Industry Analysis, Insights and Forecast, 2021-2033
- 8.1. Market Analysis, Insights and Forecast - by Product Type
- 8.1.1. Flocculant & Coagulants
- 8.1.2. Biocides & Disinfectants
- 8.1.3. Defoamers & Defoaming Agents
- 8.1.4. pH & Adjusters & Softeners
- 8.1.5. Scale & Corrosion Inhibitors
- 8.1.6. Others
- 8.2. Market Analysis, Insights and Forecast - by End-user Industry
- 8.2.1. Power
- 8.2.2. Oil & Gas
- 8.2.3. Chemical Manufcaturing
- 8.2.4. Mining & Mineral Processing
- 8.2.5. Mining and Mineral Processing
- 8.2.6. Food & Beverage
- 8.2.7. Pulp & Ppaer
- 8.2.8. Others
- 8.3. Market Analysis, Insights and Forecast - by Geography
- 8.3.1. Brazil
- 8.3.2. Argentina
- 8.3.3. Rest of South America
- 8.1. Market Analysis, Insights and Forecast - by Product Type
- 9. Rest of South America South America Water Treatment Chemicals Industry Analysis, Insights and Forecast, 2021-2033
- 9.1. Market Analysis, Insights and Forecast - by Product Type
- 9.1.1. Flocculant & Coagulants
- 9.1.2. Biocides & Disinfectants
- 9.1.3. Defoamers & Defoaming Agents
- 9.1.4. pH & Adjusters & Softeners
- 9.1.5. Scale & Corrosion Inhibitors
- 9.1.6. Others
- 9.2. Market Analysis, Insights and Forecast - by End-user Industry
- 9.2.1. Power
- 9.2.2. Oil & Gas
- 9.2.3. Chemical Manufcaturing
- 9.2.4. Mining & Mineral Processing
- 9.2.5. Mining and Mineral Processing
- 9.2.6. Food & Beverage
- 9.2.7. Pulp & Ppaer
- 9.2.8. Others
- 9.3. Market Analysis, Insights and Forecast - by Geography
- 9.3.1. Brazil
- 9.3.2. Argentina
- 9.3.3. Rest of South America
- 9.1. Market Analysis, Insights and Forecast - by Product Type
- 10. Competitive Analysis
- 10.1. Company Profiles
- 10.1.1 Nouryon
- 10.1.1.1. Company Overview
- 10.1.1.2. Products
- 10.1.1.3. Company Financials
- 10.1.1.4. SWOT Analysis
- 10.1.2 Ecolab
- 10.1.2.1. Company Overview
- 10.1.2.2. Products
- 10.1.2.3. Company Financials
- 10.1.2.4. SWOT Analysis
- 10.1.3 Solenis
- 10.1.3.1. Company Overview
- 10.1.3.2. Products
- 10.1.3.3. Company Financials
- 10.1.3.4. SWOT Analysis
- 10.1.4 Kemira
- 10.1.4.1. Company Overview
- 10.1.4.2. Products
- 10.1.4.3. Company Financials
- 10.1.4.4. SWOT Analysis
- 10.1.5 Solvay
- 10.1.5.1. Company Overview
- 10.1.5.2. Products
- 10.1.5.3. Company Financials
- 10.1.5.4. SWOT Analysis
- 10.1.6 Lonza
- 10.1.6.1. Company Overview
- 10.1.6.2. Products
- 10.1.6.3. Company Financials
- 10.1.6.4. SWOT Analysis
- 10.1.7 Kurita Water industries Ltd
- 10.1.7.1. Company Overview
- 10.1.7.2. Products
- 10.1.7.3. Company Financials
- 10.1.7.4. SWOT Analysis
- 10.1.8 SNF
- 10.1.8.1. Company Overview
- 10.1.8.2. Products
- 10.1.8.3. Company Financials
- 10.1.8.4. SWOT Analysis
- 10.1.9 Suez*List Not Exhaustive
- 10.1.9.1. Company Overview
- 10.1.9.2. Products
- 10.1.9.3. Company Financials
- 10.1.9.4. SWOT Analysis
- 10.1.1 Nouryon
- 10.2. Market Entropy
- 10.2.1 Company's Key Areas Served
- 10.2.2 Recent Developments
- 10.3. Company Market Share Analysis 2025
- 10.3.1 Top 5 Companies Market Share Analysis
- 10.3.2 Top 3 Companies Market Share Analysis
- 10.4. List of Potential Customers
- 11. Research Methodology
List of Figures
- Figure 1: Global South America Water Treatment Chemicals Industry Revenue Breakdown (billion, %) by Region 2025 & 2033
- Figure 2: Brazil South America Water Treatment Chemicals Industry Revenue (billion), by Product Type 2025 & 2033
- Figure 3: Brazil South America Water Treatment Chemicals Industry Revenue Share (%), by Product Type 2025 & 2033
- Figure 4: Brazil South America Water Treatment Chemicals Industry Revenue (billion), by End-user Industry 2025 & 2033
- Figure 5: Brazil South America Water Treatment Chemicals Industry Revenue Share (%), by End-user Industry 2025 & 2033
- Figure 6: Brazil South America Water Treatment Chemicals Industry Revenue (billion), by Geography 2025 & 2033
- Figure 7: Brazil South America Water Treatment Chemicals Industry Revenue Share (%), by Geography 2025 & 2033
- Figure 8: Brazil South America Water Treatment Chemicals Industry Revenue (billion), by Country 2025 & 2033
- Figure 9: Brazil South America Water Treatment Chemicals Industry Revenue Share (%), by Country 2025 & 2033
- Figure 10: Argentina South America Water Treatment Chemicals Industry Revenue (billion), by Product Type 2025 & 2033
- Figure 11: Argentina South America Water Treatment Chemicals Industry Revenue Share (%), by Product Type 2025 & 2033
- Figure 12: Argentina South America Water Treatment Chemicals Industry Revenue (billion), by End-user Industry 2025 & 2033
- Figure 13: Argentina South America Water Treatment Chemicals Industry Revenue Share (%), by End-user Industry 2025 & 2033
- Figure 14: Argentina South America Water Treatment Chemicals Industry Revenue (billion), by Geography 2025 & 2033
- Figure 15: Argentina South America Water Treatment Chemicals Industry Revenue Share (%), by Geography 2025 & 2033
- Figure 16: Argentina South America Water Treatment Chemicals Industry Revenue (billion), by Country 2025 & 2033
- Figure 17: Argentina South America Water Treatment Chemicals Industry Revenue Share (%), by Country 2025 & 2033
- Figure 18: Rest of South America South America Water Treatment Chemicals Industry Revenue (billion), by Product Type 2025 & 2033
- Figure 19: Rest of South America South America Water Treatment Chemicals Industry Revenue Share (%), by Product Type 2025 & 2033
- Figure 20: Rest of South America South America Water Treatment Chemicals Industry Revenue (billion), by End-user Industry 2025 & 2033
- Figure 21: Rest of South America South America Water Treatment Chemicals Industry Revenue Share (%), by End-user Industry 2025 & 2033
- Figure 22: Rest of South America South America Water Treatment Chemicals Industry Revenue (billion), by Geography 2025 & 2033
- Figure 23: Rest of South America South America Water Treatment Chemicals Industry Revenue Share (%), by Geography 2025 & 2033
- Figure 24: Rest of South America South America Water Treatment Chemicals Industry Revenue (billion), by Country 2025 & 2033
- Figure 25: Rest of South America South America Water Treatment Chemicals Industry Revenue Share (%), by Country 2025 & 2033
List of Tables
- Table 1: Global South America Water Treatment Chemicals Industry Revenue billion Forecast, by Product Type 2020 & 2033
- Table 2: Global South America Water Treatment Chemicals Industry Revenue billion Forecast, by End-user Industry 2020 & 2033
- Table 3: Global South America Water Treatment Chemicals Industry Revenue billion Forecast, by Geography 2020 & 2033
- Table 4: Global South America Water Treatment Chemicals Industry Revenue billion Forecast, by Region 2020 & 2033
- Table 5: Global South America Water Treatment Chemicals Industry Revenue billion Forecast, by Product Type 2020 & 2033
- Table 6: Global South America Water Treatment Chemicals Industry Revenue billion Forecast, by End-user Industry 2020 & 2033
- Table 7: Global South America Water Treatment Chemicals Industry Revenue billion Forecast, by Geography 2020 & 2033
- Table 8: Global South America Water Treatment Chemicals Industry Revenue billion Forecast, by Country 2020 & 2033
- Table 9: Global South America Water Treatment Chemicals Industry Revenue billion Forecast, by Product Type 2020 & 2033
- Table 10: Global South America Water Treatment Chemicals Industry Revenue billion Forecast, by End-user Industry 2020 & 2033
- Table 11: Global South America Water Treatment Chemicals Industry Revenue billion Forecast, by Geography 2020 & 2033
- Table 12: Global South America Water Treatment Chemicals Industry Revenue billion Forecast, by Country 2020 & 2033
- Table 13: Global South America Water Treatment Chemicals Industry Revenue billion Forecast, by Product Type 2020 & 2033
- Table 14: Global South America Water Treatment Chemicals Industry Revenue billion Forecast, by End-user Industry 2020 & 2033
- Table 15: Global South America Water Treatment Chemicals Industry Revenue billion Forecast, by Geography 2020 & 2033
- Table 16: Global South America Water Treatment Chemicals Industry Revenue billion Forecast, by Country 2020 & 2033
Frequently Asked Questions
1. What is the projected Compound Annual Growth Rate (CAGR) of the South America Water Treatment Chemicals Industry?
The projected CAGR is approximately 7.4%.
2. Which companies are prominent players in the South America Water Treatment Chemicals Industry?
Key companies in the market include Nouryon, Ecolab, Solenis, Kemira, Solvay, Lonza, Kurita Water industries Ltd, SNF, Suez*List Not Exhaustive.
3. What are the main segments of the South America Water Treatment Chemicals Industry?
The market segments include Product Type, End-user Industry, Geography.
4. Can you provide details about the market size?
The market size is estimated to be USD 2.9 billion as of 2022.
5. What are some drivers contributing to market growth?
; Conformance to Stringent Environmental Regulations; Other Drivers.
6. What are the notable trends driving market growth?
Oil & Gas Industry to Dominate the Market.
7. Are there any restraints impacting market growth?
; Conformance to Stringent Environmental Regulations; Other Drivers.
8. Can you provide examples of recent developments in the market?
N/A
9. What pricing options are available for accessing the report?
Pricing options include single-user, multi-user, and enterprise licenses priced at USD 4750, USD 5250, and USD 8750 respectively.
10. Is the market size provided in terms of value or volume?
The market size is provided in terms of value, measured in billion.
11. Are there any specific market keywords associated with the report?
Yes, the market keyword associated with the report is "South America Water Treatment Chemicals Industry," which aids in identifying and referencing the specific market segment covered.
12. How do I determine which pricing option suits my needs best?
The pricing options vary based on user requirements and access needs. Individual users may opt for single-user licenses, while businesses requiring broader access may choose multi-user or enterprise licenses for cost-effective access to the report.
13. Are there any additional resources or data provided in the South America Water Treatment Chemicals Industry report?
While the report offers comprehensive insights, it's advisable to review the specific contents or supplementary materials provided to ascertain if additional resources or data are available.
14. How can I stay updated on further developments or reports in the South America Water Treatment Chemicals Industry?
To stay informed about further developments, trends, and reports in the South America Water Treatment Chemicals Industry, consider subscribing to industry newsletters, following relevant companies and organizations, or regularly checking reputable industry news sources and publications.
Methodology
Step 1 - Identification of Relevant Samples Size from Population Database


Step 2 - Approaches for Defining Global Market Size (Value, Volume* & Price*)

Note*: In applicable scenarios
Step 3 - Data Sources
Primary Research
- Web Analytics
- Survey Reports
- Research Institute
- Latest Research Reports
- Opinion Leaders
Secondary Research
- Annual Reports
- White Paper
- Latest Press Release
- Industry Association
- Paid Database
- Investor Presentations

Step 4 - Data Triangulation
Involves using different sources of information in order to increase the validity of a study
These sources are likely to be stakeholders in a program - participants, other researchers, program staff, other community members, and so on.
Then we put all data in single framework & apply various statistical tools to find out the dynamic on the market.
During the analysis stage, feedback from the stakeholder groups would be compared to determine areas of agreement as well as areas of divergence