

Key Insights
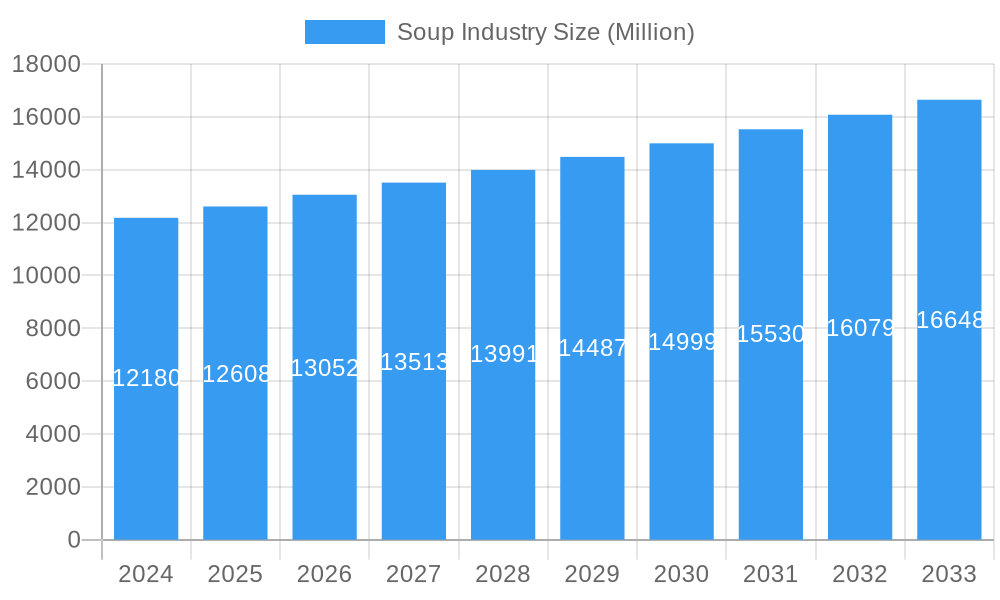
The global Soup Industry is experiencing robust growth, with a projected market size of USD 12.18 billion in 2024. Driven by evolving consumer preferences for convenience, healthier options, and diverse flavor profiles, the industry is poised for a CAGR of 3.52% during the forecast period of 2025-2033. This growth is fueled by an increasing demand for ready-to-eat and easy-to-prepare meals, particularly among busy urban populations and households with dual incomes. The rise of health and wellness trends has also spurred innovation in the soup market, leading to a greater emphasis on natural ingredients, reduced sodium content, and plant-based formulations. Furthermore, expanding distribution channels, including online retail and convenience stores, are making a wider variety of soups accessible to a broader consumer base, contributing significantly to market expansion.
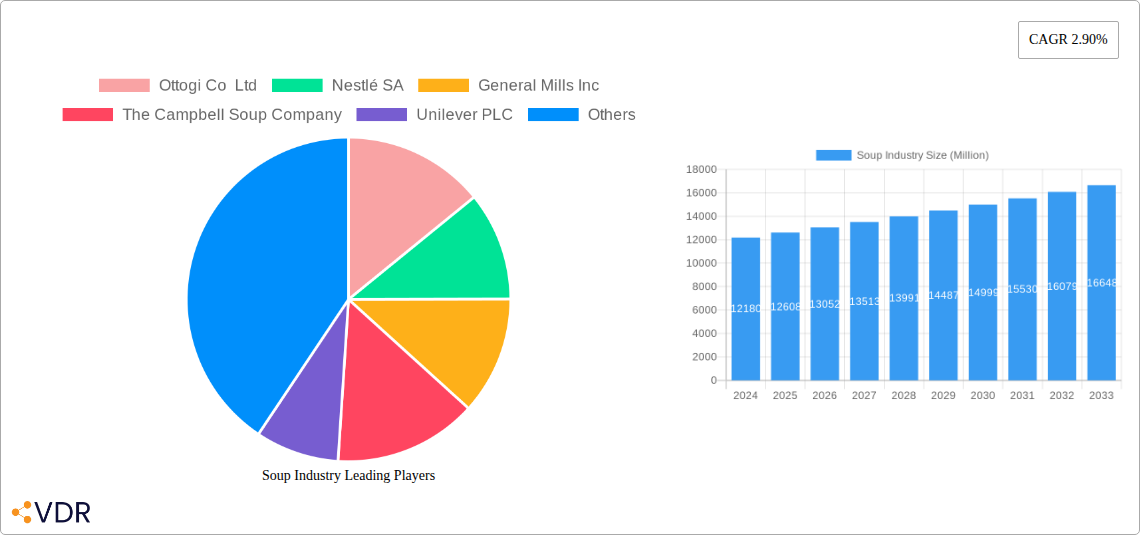
Soup Industry Market Size (In Billion)
The soup market is characterized by a dynamic segmentation across product types, categories, packaging, and distribution channels. The Canned/Preserved segment, while established, is facing increasing competition from Chilled, Dehydrated, and Instant soup varieties, which cater to modern convenience needs. Vegetarian soups are gaining substantial traction, aligning with global dietary shifts towards plant-based eating. Innovations in packaging, such as innovative pouch designs offering extended shelf life and portion control, are also influencing consumer choices. Major players like Nestlé SA, The Campbell Soup Company, and Unilever PLC are at the forefront of this market, actively investing in product development, strategic acquisitions, and expanding their global reach. Emerging markets, particularly in Asia Pacific, are showcasing significant growth potential due to rising disposable incomes and increasing urbanization, presenting lucrative opportunities for both established and new entrants.
Soup Industry Company Market Share
Soup Industry Market Report: Global Trends, Consumer Insights, and Future Outlook (2019-2033)
This comprehensive report delivers an in-depth analysis of the global soup industry, providing a critical understanding of market dynamics, growth drivers, and future opportunities. With detailed coverage of parent and child markets, this report is an essential resource for industry professionals, investors, and stakeholders seeking to navigate the evolving soup landscape. The study encompasses a historical period from 2019 to 2024, with a base year of 2025 and a robust forecast period extending to 2033. Key segments analyzed include Canned/Preserved, Chilled, Dehydrated, Frozen, Instant, and UHT soups, alongside categories like Vegetarian and Non-vegetarian soups, and packaging types such as Canned, Pouched, and Other Packaging. Distribution channels including Supermarkets/Hypermarkets, Convenience Stores, and Online Retail Stores are meticulously examined.
Soup Industry Market Dynamics & Structure
The global soup industry is characterized by moderate market concentration, with a blend of large multinational corporations and niche regional players. Technological innovation primarily focuses on enhancing convenience, shelf-life, and nutritional value, driven by consumer demand for healthier and quicker meal solutions. Regulatory frameworks, particularly concerning food safety and labeling standards, play a significant role in shaping market entry and product development. Competitive product substitutes include ready-to-eat meals, meal kits, and other convenience food options, necessitating continuous product differentiation and value proposition. End-user demographics are increasingly diverse, with a growing segment of health-conscious consumers, busy professionals, and single-person households influencing product preferences. Mergers and acquisitions (M&A) trends indicate strategic consolidation and expansion, aimed at acquiring new technologies, market access, or expanding product portfolios.
- Market Concentration: Dominated by a few key players but with increasing fragmentation in specialized segments like plant-based and gourmet soups.
- Technological Innovation Drivers: Shelf-life extension, nutritional fortification, sustainable packaging, and convenience-focused product formats.
- Regulatory Frameworks: Stringent food safety regulations (e.g., HACCP), labeling requirements (e.g., allergen declarations), and emerging dietary guidelines.
- Competitive Product Substitutes: Ready-to-eat meals, frozen dinners, meal kits, and DIY cooking ingredients.
- End-User Demographics: Growing demand from millennials and Gen Z for convenient, healthy, and ethically sourced options; aging populations seeking easy-to-prepare meals.
- M&A Trends: Acquisitions of innovative start-ups by larger companies to gain access to new product categories and consumer bases.
Soup Industry Growth Trends & Insights
The global soup market is poised for steady expansion, driven by a confluence of evolving consumer lifestyles and innovation in product development. The market size is projected to reach substantial figures by 2033, fueled by increasing adoption rates of convenience-oriented food products. Technological disruptions, such as advancements in aseptic processing and packaging, are enabling wider distribution and longer shelf lives for various soup types, from instant noodles to gourmet chilled options. Consumer behavior shifts are profoundly impacting the industry, with a pronounced move towards healthier options, including reduced sodium, plant-based alternatives, and functional ingredients. The convenience factor remains paramount, as busy schedules and a desire for quick yet nutritious meals continue to drive demand for ready-to-heat and single-serving soup formats. The penetration of online retail channels for groceries has also significantly broadened consumer access to a diverse range of soup products, further accelerating market growth.
The increasing preference for plant-based diets is a significant growth driver, with vegetarian and vegan soup options witnessing remarkable adoption rates. This trend is supported by heightened consumer awareness regarding health benefits and environmental sustainability associated with plant-derived ingredients. Furthermore, innovations in dehydrated and instant soup formulations are catering to the demand for portable and easily reconstitutable food solutions, particularly appealing to younger demographics and on-the-go consumers. The market is also seeing a rise in premium and artisanal soup offerings, appealing to consumers seeking higher quality ingredients and unique flavor profiles, signifying a move beyond basic sustenance to a more culinary experience.
- Market Size Evolution: Projected to witness a steady Compound Annual Growth Rate (CAGR) over the forecast period, driven by increasing disposable incomes and demand for convenience foods.
- Adoption Rates: High adoption of instant and ready-to-eat soup formats, with significant growth in niche segments like plant-based and organic soups.
- Technological Disruptions: Advancements in food preservation technologies and packaging solutions are expanding product availability and shelf-life.
- Consumer Behavior Shifts: Growing demand for healthy, convenient, and sustainably produced food products. Increased preference for plant-based options and diverse flavor profiles.
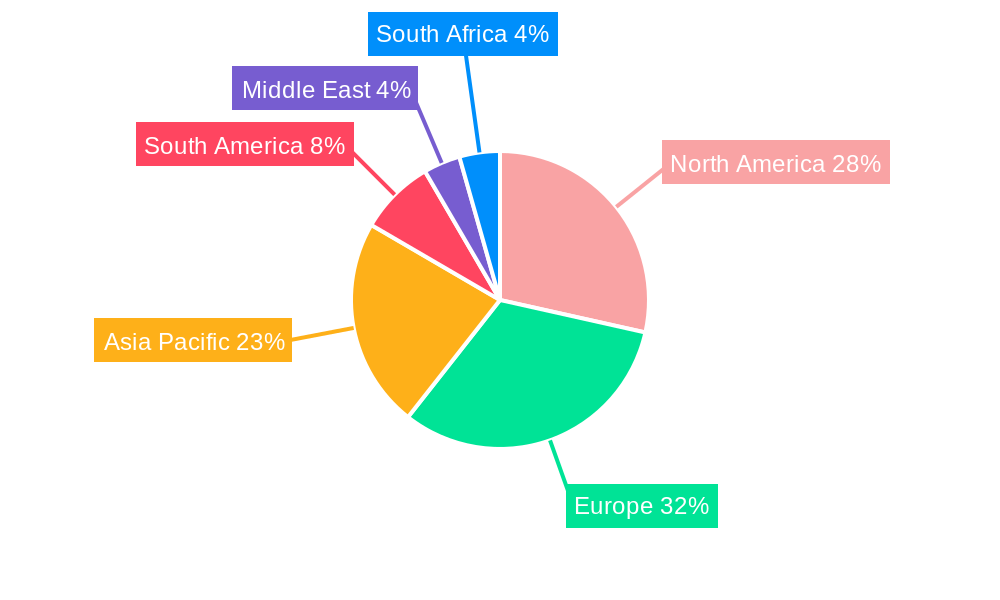
Dominant Regions, Countries, or Segments in Soup Industry
North America currently holds a dominant position in the global soup industry, driven by established market players and a strong consumer preference for convenient meal solutions. The United States, in particular, represents a significant market due to its large population, high disposable incomes, and well-developed retail infrastructure. The Canned/Preserved segment, historically a cornerstone of the soup market, continues to exhibit robust performance, supported by its long shelf life and affordability. However, the Chilled and Frozen soup segments are experiencing accelerated growth, reflecting the consumer demand for fresher ingredients and perceived higher nutritional value.
Within the categories, Vegetarian Soup is witnessing a surge in popularity, aligning with global health and sustainability trends. This growth is further amplified by the increasing prevalence of flexitarian, vegetarian, and vegan diets across various demographics. The Supermarkets/Hypermarkets distribution channel remains the most dominant, offering wide product selection and convenience for bulk purchases. Nevertheless, Online Retail Stores are rapidly gaining market share, providing consumers with greater accessibility and a broader range of specialized and imported soup products, which is crucial for reaching niche markets and catering to evolving consumer preferences.
- Dominant Region: North America, with the United States as a key market driver.
- Key Drivers: High per capita consumption, strong presence of major soup manufacturers, and established retail networks.
- Dominant Segment (Type): Canned/Preserved, though Chilled and Frozen segments show higher growth potential.
- Drivers: Convenience, affordability, and long shelf-life for canned; freshness and perceived health benefits for chilled and frozen.
- Dominant Category: Growing dominance of Vegetarian Soup, reflecting health and ethical consumerism trends.
- Drivers: Rising health consciousness, increasing vegan and vegetarian populations, and availability of diverse plant-based ingredients.
- Dominant Distribution Channel: Supermarkets/Hypermarkets, with significant growth observed in Online Retail Stores.
- Drivers: Accessibility and variety in physical stores; convenience, wider selection, and direct-to-consumer models online.
Soup Industry Product Landscape
The soup industry is witnessing a dynamic product landscape driven by innovation and evolving consumer demands. Product innovations are largely centered on convenience, health, and diverse flavor profiles. Key developments include the introduction of plant-based and vegan soups, reduced-sodium formulations, and functional soups enriched with vitamins and probiotics. Applications range from quick meal solutions for busy individuals to gourmet offerings for culinary enthusiasts. Performance metrics for new products are increasingly measured by consumer adoption rates, shelf-life extension, and perceived health benefits. Unique selling propositions often revolve around high-quality ingredients, ethical sourcing, and allergen-free formulations. Technological advancements in processing and packaging are crucial in maintaining product integrity and extending shelf life, enabling wider market reach.
Key Drivers, Barriers & Challenges in Soup Industry
The soup industry is propelled by several key drivers, including the ever-increasing demand for convenient and quick meal solutions, the growing global health consciousness promoting healthier eating habits, and the rising popularity of plant-based and vegetarian diets. Technological advancements in processing and packaging also contribute significantly by enhancing shelf-life and product variety.
However, the industry faces substantial barriers and challenges. Fluctuations in raw material prices, particularly for agricultural produce, can impact profitability. Stringent regulatory requirements regarding food safety and labeling can increase operational costs and complexity. Intense competition from other convenient food categories and the need for continuous product innovation to meet evolving consumer preferences present ongoing challenges. Supply chain disruptions, as observed in recent global events, can also impede production and distribution, affecting market availability and cost.
- Key Drivers:
- Demand for convenience and ready-to-eat meals.
- Growing health and wellness trend, leading to demand for nutritious options.
- Rise of plant-based and vegan diets.
- Technological advancements in food processing and packaging.
- Barriers & Challenges:
- Volatility in raw material prices.
- Strict food safety regulations and labeling compliance.
- Intense competition from substitute products.
- Need for continuous product innovation.
- Supply chain vulnerabilities and logistics complexities.
Emerging Opportunities in Soup Industry
Emerging opportunities in the soup industry lie in tapping into the growing demand for personalized nutrition and functional foods. The development of soups with specific health benefits, such as those aiding digestion or boosting immunity, presents a significant avenue for growth. Furthermore, the expansion of online retail and direct-to-consumer models opens up possibilities for niche market penetration and personalized subscription services. The focus on sustainability and ethical sourcing is also creating opportunities for brands that can demonstrate a commitment to eco-friendly practices and fair labor, appealing to a conscious consumer base. Exploring untapped geographical markets with growing middle-class populations also offers substantial potential for market expansion.
Growth Accelerators in the Soup Industry Industry
The long-term growth of the soup industry is being significantly accelerated by ongoing technological breakthroughs in food preservation and packaging, enabling extended shelf life and wider product availability. Strategic partnerships between ingredient suppliers and soup manufacturers are fostering innovation in unique flavor profiles and health-focused formulations. Furthermore, proactive market expansion strategies by key players, targeting emerging economies and underserved consumer segments, are driving overall market expansion. The increasing consumer acceptance of e-commerce for grocery purchases is also a major catalyst, simplifying access to a broader range of soup products and encouraging impulse buys.
Key Players Shaping the Soup Industry Market
- Ottogi Co Ltd
- Nestlé SA
- General Mills Inc
- The Campbell Soup Company
- Unilever PLC
- Conagra Brands Inc
- WA Baxter & Sons (Holdings) Limited
- The Kraft Heinz Company
- Tideford Organic Foods Limited
- B&G Foods Holding Corp
- Upton's Naturals Co
- Premier Foods Group Limited
Notable Milestones in Soup Industry Sector
- September 2022: Tideford Organics launched new soup flavors and improved recipes, doubling its retail distribution and introducing Indian Cauliflower Masala, Lebanese Lentil + Kale, and Malaysian Coconut + Noodle soups, alongside Butternut + Sage.
- July 2022: Upton's Naturals introduced three new vegan soup recipes, featuring 8-11g of plant-based protein per serving, Non-GMO Certified (NSF), Plant-Based Certified, and allergen-free.
- June 2022: The Campbell Soup Company announced plans for new soup product flavors, with initial introductions expected in the first quarter of fiscal year 2023.
In-Depth Soup Industry Market Outlook
The future of the soup industry is marked by substantial potential, driven by persistent consumer demand for convenience and a growing emphasis on health and wellness. Growth accelerators will include continued innovation in plant-based and functional ingredients, alongside advancements in sustainable packaging solutions. Strategic market expansion into emerging economies, coupled with the increasing penetration of online retail, will further fuel growth. Stakeholders who can adeptly respond to evolving consumer preferences for diverse flavor profiles, ethical sourcing, and personalized nutrition are best positioned to capitalize on the robust opportunities within this dynamic industry. The integration of smart manufacturing technologies and data analytics will also be critical for optimizing operations and enhancing competitive advantage.
Soup Industry Segmentation
-
1. Type
- 1.1. Canned/Preserved
- 1.2. Chilled
- 1.3. Dehydrated
- 1.4. Frozen
- 1.5. Instant
- 1.6. UHT
-
2. Category
- 2.1. Vegetarian Soup
- 2.2. Non-vegetarian Soup
-
3. Packaging
- 3.1. Canned
- 3.2. Pouched
- 3.3. Other Packaging
-
4. Distribution Channel
- 4.1. Supermarkets/Hypermarkets
- 4.2. Convenience Stores
- 4.3. Online Retail Stores
- 4.4. Other Distribution Channels
Soup Industry Segmentation By Geography
-
1. North America
- 1.1. United States
- 1.2. Canada
- 1.3. Mexico
- 1.4. Rest of North America
-
2. Europe
- 2.1. Spain
- 2.2. United Kingdom
- 2.3. Germany
- 2.4. France
- 2.5. Italy
- 2.6. Russia
- 2.7. Rest of Europe
-
3. Asia Pacific
- 3.1. China
- 3.2. Japan
- 3.3. India
- 3.4. Australia
- 3.5. Rest of Asia Pacific
-
4. South America
- 4.1. Brazil
- 4.2. Argentina
- 4.3. Rest of South America
- 5. Middle East
-
6. South Africa
- 6.1. Saudi Arabia
- 6.2. Rest of Middle East
Soup Industry Regional Market Share
Geographic Coverage of Soup Industry
Soup Industry REPORT HIGHLIGHTS
| Aspects | Details |
|---|---|
| Study Period | 2020-2034 |
| Base Year | 2025 |
| Estimated Year | 2026 |
| Forecast Period | 2026-2034 |
| Historical Period | 2020-2025 |
| Growth Rate | CAGR of 3.38% from 2020-2034 |
| Segmentation |
|
Table of Contents
- 1. Introduction
- 1.1. Research Scope
- 1.2. Market Segmentation
- 1.3. Research Objective
- 1.4. Definitions and Assumptions
- 2. Executive Summary
- 2.1. Market Snapshot
- 3. Market Dynamics
- 3.1. Market Drivers
- 3.2. Market Restrains
- 3.3. Market Trends
- 3.4. Market Opportunities
- 4. Market Factor Analysis
- 4.1. Porters Five Forces
- 4.1.1. Bargaining Power of Suppliers
- 4.1.2. Bargaining Power of Buyers
- 4.1.3. Threat of New Entrants
- 4.1.4. Threat of Substitutes
- 4.1.5. Competitive Rivalry
- 4.2. PESTEL analysis
- 4.3. BCG Analysis
- 4.3.1. Stars (High Growth, High Market Share)
- 4.3.2. Cash Cows (Low Growth, High Market Share)
- 4.3.3. Question Mark (High Growth, Low Market Share)
- 4.3.4. Dogs (Low Growth, Low Market Share)
- 4.4. Ansoff Matrix Analysis
- 4.5. Supply Chain Analysis
- 4.6. Regulatory Landscape
- 4.7. Current Market Potential and Opportunity Assessment (TAM–SAM–SOM Framework)
- 4.8. VDR Analyst Note
- 4.1. Porters Five Forces
- 5. Market Analysis, Insights and Forecast 2021-2033
- 5.1. Market Analysis, Insights and Forecast - by Type
- 5.1.1. Canned/Preserved
- 5.1.2. Chilled
- 5.1.3. Dehydrated
- 5.1.4. Frozen
- 5.1.5. Instant
- 5.1.6. UHT
- 5.2. Market Analysis, Insights and Forecast - by Category
- 5.2.1. Vegetarian Soup
- 5.2.2. Non-vegetarian Soup
- 5.3. Market Analysis, Insights and Forecast - by Packaging
- 5.3.1. Canned
- 5.3.2. Pouched
- 5.3.3. Other Packaging
- 5.4. Market Analysis, Insights and Forecast - by Distribution Channel
- 5.4.1. Supermarkets/Hypermarkets
- 5.4.2. Convenience Stores
- 5.4.3. Online Retail Stores
- 5.4.4. Other Distribution Channels
- 5.5. Market Analysis, Insights and Forecast - by Region
- 5.5.1. North America
- 5.5.2. Europe
- 5.5.3. Asia Pacific
- 5.5.4. South America
- 5.5.5. Middle East
- 5.5.6. South Africa
- 5.1. Market Analysis, Insights and Forecast - by Type
- 6. Global Soup Industry Analysis, Insights and Forecast, 2021-2033
- 6.1. Market Analysis, Insights and Forecast - by Type
- 6.1.1. Canned/Preserved
- 6.1.2. Chilled
- 6.1.3. Dehydrated
- 6.1.4. Frozen
- 6.1.5. Instant
- 6.1.6. UHT
- 6.2. Market Analysis, Insights and Forecast - by Category
- 6.2.1. Vegetarian Soup
- 6.2.2. Non-vegetarian Soup
- 6.3. Market Analysis, Insights and Forecast - by Packaging
- 6.3.1. Canned
- 6.3.2. Pouched
- 6.3.3. Other Packaging
- 6.4. Market Analysis, Insights and Forecast - by Distribution Channel
- 6.4.1. Supermarkets/Hypermarkets
- 6.4.2. Convenience Stores
- 6.4.3. Online Retail Stores
- 6.4.4. Other Distribution Channels
- 6.1. Market Analysis, Insights and Forecast - by Type
- 7. North America Soup Industry Analysis, Insights and Forecast, 2021-2033
- 7.1. Market Analysis, Insights and Forecast - by Type
- 7.1.1. Canned/Preserved
- 7.1.2. Chilled
- 7.1.3. Dehydrated
- 7.1.4. Frozen
- 7.1.5. Instant
- 7.1.6. UHT
- 7.2. Market Analysis, Insights and Forecast - by Category
- 7.2.1. Vegetarian Soup
- 7.2.2. Non-vegetarian Soup
- 7.3. Market Analysis, Insights and Forecast - by Packaging
- 7.3.1. Canned
- 7.3.2. Pouched
- 7.3.3. Other Packaging
- 7.4. Market Analysis, Insights and Forecast - by Distribution Channel
- 7.4.1. Supermarkets/Hypermarkets
- 7.4.2. Convenience Stores
- 7.4.3. Online Retail Stores
- 7.4.4. Other Distribution Channels
- 7.1. Market Analysis, Insights and Forecast - by Type
- 8. Europe Soup Industry Analysis, Insights and Forecast, 2021-2033
- 8.1. Market Analysis, Insights and Forecast - by Type
- 8.1.1. Canned/Preserved
- 8.1.2. Chilled
- 8.1.3. Dehydrated
- 8.1.4. Frozen
- 8.1.5. Instant
- 8.1.6. UHT
- 8.2. Market Analysis, Insights and Forecast - by Category
- 8.2.1. Vegetarian Soup
- 8.2.2. Non-vegetarian Soup
- 8.3. Market Analysis, Insights and Forecast - by Packaging
- 8.3.1. Canned
- 8.3.2. Pouched
- 8.3.3. Other Packaging
- 8.4. Market Analysis, Insights and Forecast - by Distribution Channel
- 8.4.1. Supermarkets/Hypermarkets
- 8.4.2. Convenience Stores
- 8.4.3. Online Retail Stores
- 8.4.4. Other Distribution Channels
- 8.1. Market Analysis, Insights and Forecast - by Type
- 9. Asia Pacific Soup Industry Analysis, Insights and Forecast, 2021-2033
- 9.1. Market Analysis, Insights and Forecast - by Type
- 9.1.1. Canned/Preserved
- 9.1.2. Chilled
- 9.1.3. Dehydrated
- 9.1.4. Frozen
- 9.1.5. Instant
- 9.1.6. UHT
- 9.2. Market Analysis, Insights and Forecast - by Category
- 9.2.1. Vegetarian Soup
- 9.2.2. Non-vegetarian Soup
- 9.3. Market Analysis, Insights and Forecast - by Packaging
- 9.3.1. Canned
- 9.3.2. Pouched
- 9.3.3. Other Packaging
- 9.4. Market Analysis, Insights and Forecast - by Distribution Channel
- 9.4.1. Supermarkets/Hypermarkets
- 9.4.2. Convenience Stores
- 9.4.3. Online Retail Stores
- 9.4.4. Other Distribution Channels
- 9.1. Market Analysis, Insights and Forecast - by Type
- 10. South America Soup Industry Analysis, Insights and Forecast, 2021-2033
- 10.1. Market Analysis, Insights and Forecast - by Type
- 10.1.1. Canned/Preserved
- 10.1.2. Chilled
- 10.1.3. Dehydrated
- 10.1.4. Frozen
- 10.1.5. Instant
- 10.1.6. UHT
- 10.2. Market Analysis, Insights and Forecast - by Category
- 10.2.1. Vegetarian Soup
- 10.2.2. Non-vegetarian Soup
- 10.3. Market Analysis, Insights and Forecast - by Packaging
- 10.3.1. Canned
- 10.3.2. Pouched
- 10.3.3. Other Packaging
- 10.4. Market Analysis, Insights and Forecast - by Distribution Channel
- 10.4.1. Supermarkets/Hypermarkets
- 10.4.2. Convenience Stores
- 10.4.3. Online Retail Stores
- 10.4.4. Other Distribution Channels
- 10.1. Market Analysis, Insights and Forecast - by Type
- 11. Middle East Soup Industry Analysis, Insights and Forecast, 2021-2033
- 11.1. Market Analysis, Insights and Forecast - by Type
- 11.1.1. Canned/Preserved
- 11.1.2. Chilled
- 11.1.3. Dehydrated
- 11.1.4. Frozen
- 11.1.5. Instant
- 11.1.6. UHT
- 11.2. Market Analysis, Insights and Forecast - by Category
- 11.2.1. Vegetarian Soup
- 11.2.2. Non-vegetarian Soup
- 11.3. Market Analysis, Insights and Forecast - by Packaging
- 11.3.1. Canned
- 11.3.2. Pouched
- 11.3.3. Other Packaging
- 11.4. Market Analysis, Insights and Forecast - by Distribution Channel
- 11.4.1. Supermarkets/Hypermarkets
- 11.4.2. Convenience Stores
- 11.4.3. Online Retail Stores
- 11.4.4. Other Distribution Channels
- 11.1. Market Analysis, Insights and Forecast - by Type
- 12. South Africa Soup Industry Analysis, Insights and Forecast, 2021-2033
- 12.1. Market Analysis, Insights and Forecast - by Type
- 12.1.1. Canned/Preserved
- 12.1.2. Chilled
- 12.1.3. Dehydrated
- 12.1.4. Frozen
- 12.1.5. Instant
- 12.1.6. UHT
- 12.2. Market Analysis, Insights and Forecast - by Category
- 12.2.1. Vegetarian Soup
- 12.2.2. Non-vegetarian Soup
- 12.3. Market Analysis, Insights and Forecast - by Packaging
- 12.3.1. Canned
- 12.3.2. Pouched
- 12.3.3. Other Packaging
- 12.4. Market Analysis, Insights and Forecast - by Distribution Channel
- 12.4.1. Supermarkets/Hypermarkets
- 12.4.2. Convenience Stores
- 12.4.3. Online Retail Stores
- 12.4.4. Other Distribution Channels
- 12.1. Market Analysis, Insights and Forecast - by Type
- 13. Competitive Analysis
- 13.1. Company Profiles
- 13.1.1 Ottogi Co Ltd
- 13.1.1.1. Company Overview
- 13.1.1.2. Products
- 13.1.1.3. Company Financials
- 13.1.1.4. SWOT Analysis
- 13.1.2 Nestlé SA
- 13.1.2.1. Company Overview
- 13.1.2.2. Products
- 13.1.2.3. Company Financials
- 13.1.2.4. SWOT Analysis
- 13.1.3 General Mills Inc
- 13.1.3.1. Company Overview
- 13.1.3.2. Products
- 13.1.3.3. Company Financials
- 13.1.3.4. SWOT Analysis
- 13.1.4 The Campbell Soup Company
- 13.1.4.1. Company Overview
- 13.1.4.2. Products
- 13.1.4.3. Company Financials
- 13.1.4.4. SWOT Analysis
- 13.1.5 Unilever PLC
- 13.1.5.1. Company Overview
- 13.1.5.2. Products
- 13.1.5.3. Company Financials
- 13.1.5.4. SWOT Analysis
- 13.1.6 Conagra Brands Inc
- 13.1.6.1. Company Overview
- 13.1.6.2. Products
- 13.1.6.3. Company Financials
- 13.1.6.4. SWOT Analysis
- 13.1.7 WA Baxter & Sons (Holdings) Limited
- 13.1.7.1. Company Overview
- 13.1.7.2. Products
- 13.1.7.3. Company Financials
- 13.1.7.4. SWOT Analysis
- 13.1.8 The Kraft Heinz Company
- 13.1.8.1. Company Overview
- 13.1.8.2. Products
- 13.1.8.3. Company Financials
- 13.1.8.4. SWOT Analysis
- 13.1.9 Tideford Organic Foods Limited
- 13.1.9.1. Company Overview
- 13.1.9.2. Products
- 13.1.9.3. Company Financials
- 13.1.9.4. SWOT Analysis
- 13.1.10 B&G Foods Holding Corp
- 13.1.10.1. Company Overview
- 13.1.10.2. Products
- 13.1.10.3. Company Financials
- 13.1.10.4. SWOT Analysis
- 13.1.11 Upton's Naturals Co
- 13.1.11.1. Company Overview
- 13.1.11.2. Products
- 13.1.11.3. Company Financials
- 13.1.11.4. SWOT Analysis
- 13.1.12 Premier Foods Group Limited
- 13.1.12.1. Company Overview
- 13.1.12.2. Products
- 13.1.12.3. Company Financials
- 13.1.12.4. SWOT Analysis
- 13.1.1 Ottogi Co Ltd
- 13.2. Market Entropy
- 13.2.1 Company's Key Areas Served
- 13.2.2 Recent Developments
- 13.3. Company Market Share Analysis 2025
- 13.3.1 Top 5 Companies Market Share Analysis
- 13.3.2 Top 3 Companies Market Share Analysis
- 13.4. List of Potential Customers
- 14. Research Methodology
List of Figures
- Figure 1: Global Soup Industry Revenue Breakdown (billion, %) by Region 2025 & 2033
- Figure 2: North America Soup Industry Revenue (billion), by Type 2025 & 2033
- Figure 3: North America Soup Industry Revenue Share (%), by Type 2025 & 2033
- Figure 4: North America Soup Industry Revenue (billion), by Category 2025 & 2033
- Figure 5: North America Soup Industry Revenue Share (%), by Category 2025 & 2033
- Figure 6: North America Soup Industry Revenue (billion), by Packaging 2025 & 2033
- Figure 7: North America Soup Industry Revenue Share (%), by Packaging 2025 & 2033
- Figure 8: North America Soup Industry Revenue (billion), by Distribution Channel 2025 & 2033
- Figure 9: North America Soup Industry Revenue Share (%), by Distribution Channel 2025 & 2033
- Figure 10: North America Soup Industry Revenue (billion), by Country 2025 & 2033
- Figure 11: North America Soup Industry Revenue Share (%), by Country 2025 & 2033
- Figure 12: Europe Soup Industry Revenue (billion), by Type 2025 & 2033
- Figure 13: Europe Soup Industry Revenue Share (%), by Type 2025 & 2033
- Figure 14: Europe Soup Industry Revenue (billion), by Category 2025 & 2033
- Figure 15: Europe Soup Industry Revenue Share (%), by Category 2025 & 2033
- Figure 16: Europe Soup Industry Revenue (billion), by Packaging 2025 & 2033
- Figure 17: Europe Soup Industry Revenue Share (%), by Packaging 2025 & 2033
- Figure 18: Europe Soup Industry Revenue (billion), by Distribution Channel 2025 & 2033
- Figure 19: Europe Soup Industry Revenue Share (%), by Distribution Channel 2025 & 2033
- Figure 20: Europe Soup Industry Revenue (billion), by Country 2025 & 2033
- Figure 21: Europe Soup Industry Revenue Share (%), by Country 2025 & 2033
- Figure 22: Asia Pacific Soup Industry Revenue (billion), by Type 2025 & 2033
- Figure 23: Asia Pacific Soup Industry Revenue Share (%), by Type 2025 & 2033
- Figure 24: Asia Pacific Soup Industry Revenue (billion), by Category 2025 & 2033
- Figure 25: Asia Pacific Soup Industry Revenue Share (%), by Category 2025 & 2033
- Figure 26: Asia Pacific Soup Industry Revenue (billion), by Packaging 2025 & 2033
- Figure 27: Asia Pacific Soup Industry Revenue Share (%), by Packaging 2025 & 2033
- Figure 28: Asia Pacific Soup Industry Revenue (billion), by Distribution Channel 2025 & 2033
- Figure 29: Asia Pacific Soup Industry Revenue Share (%), by Distribution Channel 2025 & 2033
- Figure 30: Asia Pacific Soup Industry Revenue (billion), by Country 2025 & 2033
- Figure 31: Asia Pacific Soup Industry Revenue Share (%), by Country 2025 & 2033
- Figure 32: South America Soup Industry Revenue (billion), by Type 2025 & 2033
- Figure 33: South America Soup Industry Revenue Share (%), by Type 2025 & 2033
- Figure 34: South America Soup Industry Revenue (billion), by Category 2025 & 2033
- Figure 35: South America Soup Industry Revenue Share (%), by Category 2025 & 2033
- Figure 36: South America Soup Industry Revenue (billion), by Packaging 2025 & 2033
- Figure 37: South America Soup Industry Revenue Share (%), by Packaging 2025 & 2033
- Figure 38: South America Soup Industry Revenue (billion), by Distribution Channel 2025 & 2033
- Figure 39: South America Soup Industry Revenue Share (%), by Distribution Channel 2025 & 2033
- Figure 40: South America Soup Industry Revenue (billion), by Country 2025 & 2033
- Figure 41: South America Soup Industry Revenue Share (%), by Country 2025 & 2033
- Figure 42: Middle East Soup Industry Revenue (billion), by Type 2025 & 2033
- Figure 43: Middle East Soup Industry Revenue Share (%), by Type 2025 & 2033
- Figure 44: Middle East Soup Industry Revenue (billion), by Category 2025 & 2033
- Figure 45: Middle East Soup Industry Revenue Share (%), by Category 2025 & 2033
- Figure 46: Middle East Soup Industry Revenue (billion), by Packaging 2025 & 2033
- Figure 47: Middle East Soup Industry Revenue Share (%), by Packaging 2025 & 2033
- Figure 48: Middle East Soup Industry Revenue (billion), by Distribution Channel 2025 & 2033
- Figure 49: Middle East Soup Industry Revenue Share (%), by Distribution Channel 2025 & 2033
- Figure 50: Middle East Soup Industry Revenue (billion), by Country 2025 & 2033
- Figure 51: Middle East Soup Industry Revenue Share (%), by Country 2025 & 2033
- Figure 52: South Africa Soup Industry Revenue (billion), by Type 2025 & 2033
- Figure 53: South Africa Soup Industry Revenue Share (%), by Type 2025 & 2033
- Figure 54: South Africa Soup Industry Revenue (billion), by Category 2025 & 2033
- Figure 55: South Africa Soup Industry Revenue Share (%), by Category 2025 & 2033
- Figure 56: South Africa Soup Industry Revenue (billion), by Packaging 2025 & 2033
- Figure 57: South Africa Soup Industry Revenue Share (%), by Packaging 2025 & 2033
- Figure 58: South Africa Soup Industry Revenue (billion), by Distribution Channel 2025 & 2033
- Figure 59: South Africa Soup Industry Revenue Share (%), by Distribution Channel 2025 & 2033
- Figure 60: South Africa Soup Industry Revenue (billion), by Country 2025 & 2033
- Figure 61: South Africa Soup Industry Revenue Share (%), by Country 2025 & 2033
List of Tables
- Table 1: Global Soup Industry Revenue billion Forecast, by Type 2020 & 2033
- Table 2: Global Soup Industry Revenue billion Forecast, by Category 2020 & 2033
- Table 3: Global Soup Industry Revenue billion Forecast, by Packaging 2020 & 2033
- Table 4: Global Soup Industry Revenue billion Forecast, by Distribution Channel 2020 & 2033
- Table 5: Global Soup Industry Revenue billion Forecast, by Region 2020 & 2033
- Table 6: Global Soup Industry Revenue billion Forecast, by Type 2020 & 2033
- Table 7: Global Soup Industry Revenue billion Forecast, by Category 2020 & 2033
- Table 8: Global Soup Industry Revenue billion Forecast, by Packaging 2020 & 2033
- Table 9: Global Soup Industry Revenue billion Forecast, by Distribution Channel 2020 & 2033
- Table 10: Global Soup Industry Revenue billion Forecast, by Country 2020 & 2033
- Table 11: United States Soup Industry Revenue (billion) Forecast, by Application 2020 & 2033
- Table 12: Canada Soup Industry Revenue (billion) Forecast, by Application 2020 & 2033
- Table 13: Mexico Soup Industry Revenue (billion) Forecast, by Application 2020 & 2033
- Table 14: Rest of North America Soup Industry Revenue (billion) Forecast, by Application 2020 & 2033
- Table 15: Global Soup Industry Revenue billion Forecast, by Type 2020 & 2033
- Table 16: Global Soup Industry Revenue billion Forecast, by Category 2020 & 2033
- Table 17: Global Soup Industry Revenue billion Forecast, by Packaging 2020 & 2033
- Table 18: Global Soup Industry Revenue billion Forecast, by Distribution Channel 2020 & 2033
- Table 19: Global Soup Industry Revenue billion Forecast, by Country 2020 & 2033
- Table 20: Spain Soup Industry Revenue (billion) Forecast, by Application 2020 & 2033
- Table 21: United Kingdom Soup Industry Revenue (billion) Forecast, by Application 2020 & 2033
- Table 22: Germany Soup Industry Revenue (billion) Forecast, by Application 2020 & 2033
- Table 23: France Soup Industry Revenue (billion) Forecast, by Application 2020 & 2033
- Table 24: Italy Soup Industry Revenue (billion) Forecast, by Application 2020 & 2033
- Table 25: Russia Soup Industry Revenue (billion) Forecast, by Application 2020 & 2033
- Table 26: Rest of Europe Soup Industry Revenue (billion) Forecast, by Application 2020 & 2033
- Table 27: Global Soup Industry Revenue billion Forecast, by Type 2020 & 2033
- Table 28: Global Soup Industry Revenue billion Forecast, by Category 2020 & 2033
- Table 29: Global Soup Industry Revenue billion Forecast, by Packaging 2020 & 2033
- Table 30: Global Soup Industry Revenue billion Forecast, by Distribution Channel 2020 & 2033
- Table 31: Global Soup Industry Revenue billion Forecast, by Country 2020 & 2033
- Table 32: China Soup Industry Revenue (billion) Forecast, by Application 2020 & 2033
- Table 33: Japan Soup Industry Revenue (billion) Forecast, by Application 2020 & 2033
- Table 34: India Soup Industry Revenue (billion) Forecast, by Application 2020 & 2033
- Table 35: Australia Soup Industry Revenue (billion) Forecast, by Application 2020 & 2033
- Table 36: Rest of Asia Pacific Soup Industry Revenue (billion) Forecast, by Application 2020 & 2033
- Table 37: Global Soup Industry Revenue billion Forecast, by Type 2020 & 2033
- Table 38: Global Soup Industry Revenue billion Forecast, by Category 2020 & 2033
- Table 39: Global Soup Industry Revenue billion Forecast, by Packaging 2020 & 2033
- Table 40: Global Soup Industry Revenue billion Forecast, by Distribution Channel 2020 & 2033
- Table 41: Global Soup Industry Revenue billion Forecast, by Country 2020 & 2033
- Table 42: Brazil Soup Industry Revenue (billion) Forecast, by Application 2020 & 2033
- Table 43: Argentina Soup Industry Revenue (billion) Forecast, by Application 2020 & 2033
- Table 44: Rest of South America Soup Industry Revenue (billion) Forecast, by Application 2020 & 2033
- Table 45: Global Soup Industry Revenue billion Forecast, by Type 2020 & 2033
- Table 46: Global Soup Industry Revenue billion Forecast, by Category 2020 & 2033
- Table 47: Global Soup Industry Revenue billion Forecast, by Packaging 2020 & 2033
- Table 48: Global Soup Industry Revenue billion Forecast, by Distribution Channel 2020 & 2033
- Table 49: Global Soup Industry Revenue billion Forecast, by Country 2020 & 2033
- Table 50: Global Soup Industry Revenue billion Forecast, by Type 2020 & 2033
- Table 51: Global Soup Industry Revenue billion Forecast, by Category 2020 & 2033
- Table 52: Global Soup Industry Revenue billion Forecast, by Packaging 2020 & 2033
- Table 53: Global Soup Industry Revenue billion Forecast, by Distribution Channel 2020 & 2033
- Table 54: Global Soup Industry Revenue billion Forecast, by Country 2020 & 2033
- Table 55: Saudi Arabia Soup Industry Revenue (billion) Forecast, by Application 2020 & 2033
- Table 56: Rest of Middle East Soup Industry Revenue (billion) Forecast, by Application 2020 & 2033
Frequently Asked Questions
1. What is the projected Compound Annual Growth Rate (CAGR) of the Soup Industry?
The projected CAGR is approximately 3.38%.
2. Which companies are prominent players in the Soup Industry?
Key companies in the market include Ottogi Co Ltd, Nestlé SA, General Mills Inc, The Campbell Soup Company, Unilever PLC, Conagra Brands Inc, WA Baxter & Sons (Holdings) Limited, The Kraft Heinz Company, Tideford Organic Foods Limited, B&G Foods Holding Corp, Upton's Naturals Co, Premier Foods Group Limited.
3. What are the main segments of the Soup Industry?
The market segments include Type, Category, Packaging, Distribution Channel.
4. Can you provide details about the market size?
The market size is estimated to be USD 12.6 billion as of 2022.
5. What are some drivers contributing to market growth?
Ready-to-eat and easy-to-prepare soups cater to the busy lifestyles of consumers driving demand for convenient food options.
6. What are the notable trends driving market growth?
Increased demand for plant-based and vegan diets has led to a rise in plant-based soups.
7. Are there any restraints impacting market growth?
Competition from Fresh and Homemade Alternatives.
8. Can you provide examples of recent developments in the market?
In September 2022, Tideford Organics, the UK's plant-based, vegan, and gluten-free soup brand, launched a range of new soup flavors and improved recipes and doubled its retail distribution from last year. Its Inspired line launched Indian Cauliflower Masala, Lebanese Lentil + Kale, and Malaysian Coconut + Noodle soups. As well as Butternut + Sage from its Favourites collection.
9. What pricing options are available for accessing the report?
Pricing options include single-user, multi-user, and enterprise licenses priced at USD 4750, USD 5250, and USD 8750 respectively.
10. Is the market size provided in terms of value or volume?
The market size is provided in terms of value, measured in billion.
11. Are there any specific market keywords associated with the report?
Yes, the market keyword associated with the report is "Soup Industry," which aids in identifying and referencing the specific market segment covered.
12. How do I determine which pricing option suits my needs best?
The pricing options vary based on user requirements and access needs. Individual users may opt for single-user licenses, while businesses requiring broader access may choose multi-user or enterprise licenses for cost-effective access to the report.
13. Are there any additional resources or data provided in the Soup Industry report?
While the report offers comprehensive insights, it's advisable to review the specific contents or supplementary materials provided to ascertain if additional resources or data are available.
14. How can I stay updated on further developments or reports in the Soup Industry?
To stay informed about further developments, trends, and reports in the Soup Industry, consider subscribing to industry newsletters, following relevant companies and organizations, or regularly checking reputable industry news sources and publications.
Methodology
Step 1 - Identification of Relevant Samples Size from Population Database


Step 2 - Approaches for Defining Global Market Size (Value, Volume* & Price*)

Note*: In applicable scenarios
Step 3 - Data Sources
Primary Research
- Web Analytics
- Survey Reports
- Research Institute
- Latest Research Reports
- Opinion Leaders
Secondary Research
- Annual Reports
- White Paper
- Latest Press Release
- Industry Association
- Paid Database
- Investor Presentations

Step 4 - Data Triangulation
Involves using different sources of information in order to increase the validity of a study
These sources are likely to be stakeholders in a program - participants, other researchers, program staff, other community members, and so on.
Then we put all data in single framework & apply various statistical tools to find out the dynamic on the market.
During the analysis stage, feedback from the stakeholder groups would be compared to determine areas of agreement as well as areas of divergence