


Key Insights
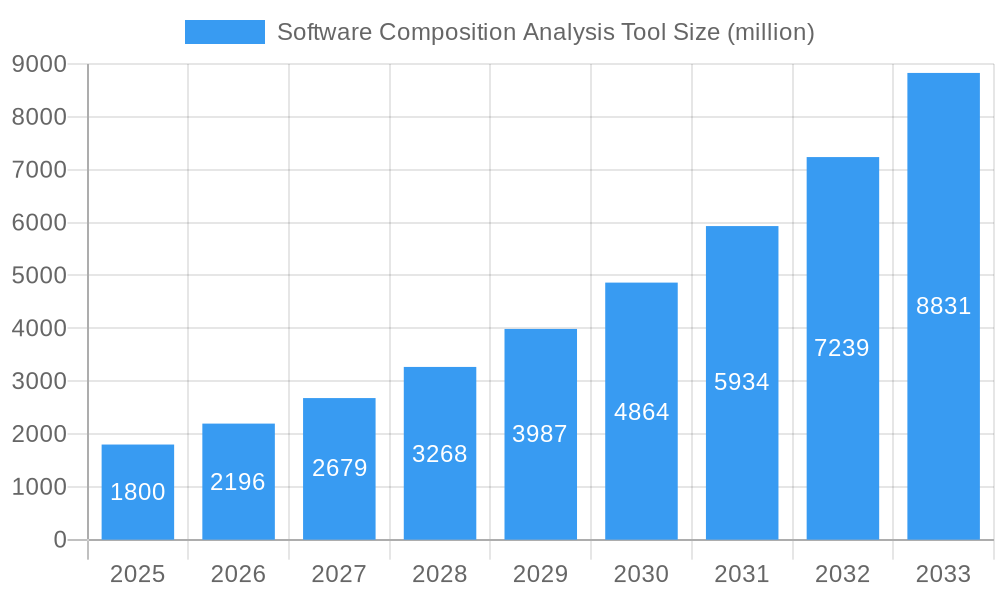
The Software Composition Analysis (SCA) tool market is poised for significant expansion, projected to reach an estimated market size of $1,800 million by 2025, with a robust Compound Annual Growth Rate (CAGR) of 22% expected through 2033. This growth is primarily fueled by the escalating adoption of open-source software (OSS) across all development environments, from solo developers to large DevOps teams. The inherent security risks associated with OSS, including licensing compliance issues and the prevalence of known vulnerabilities, are driving the demand for SCA tools that can effectively identify, manage, and remediate these challenges. Furthermore, the increasing regulatory landscape and stringent compliance requirements in various industries are compelling organizations to implement comprehensive SCA strategies to ensure the integrity and security of their software supply chains. Cloud-based SCA solutions are particularly gaining traction due to their scalability, flexibility, and ease of integration into existing CI/CD pipelines, contributing to the market's upward trajectory.
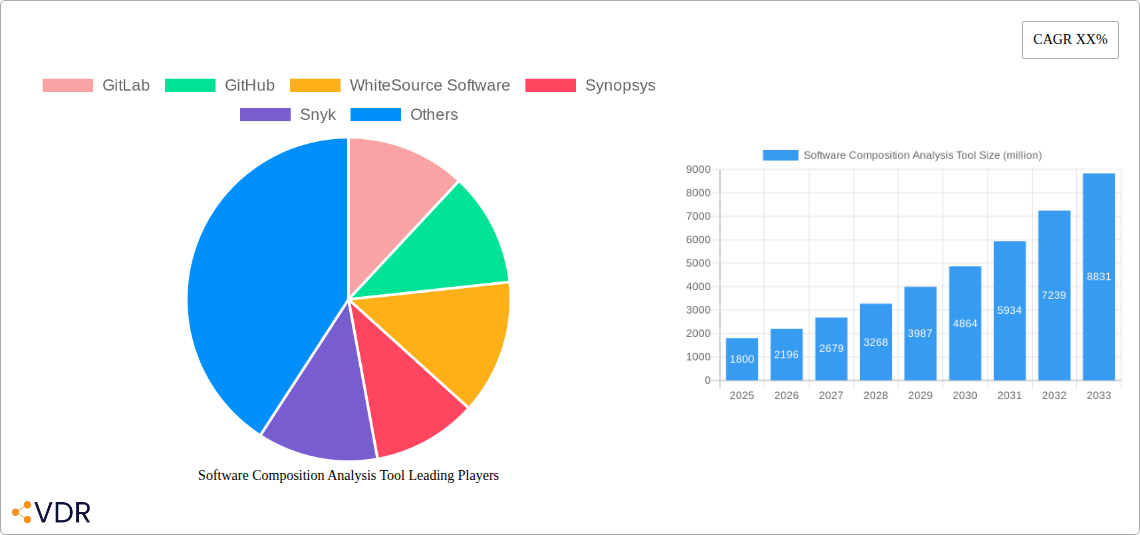
Software Composition Analysis Tool Market Size (In Billion)

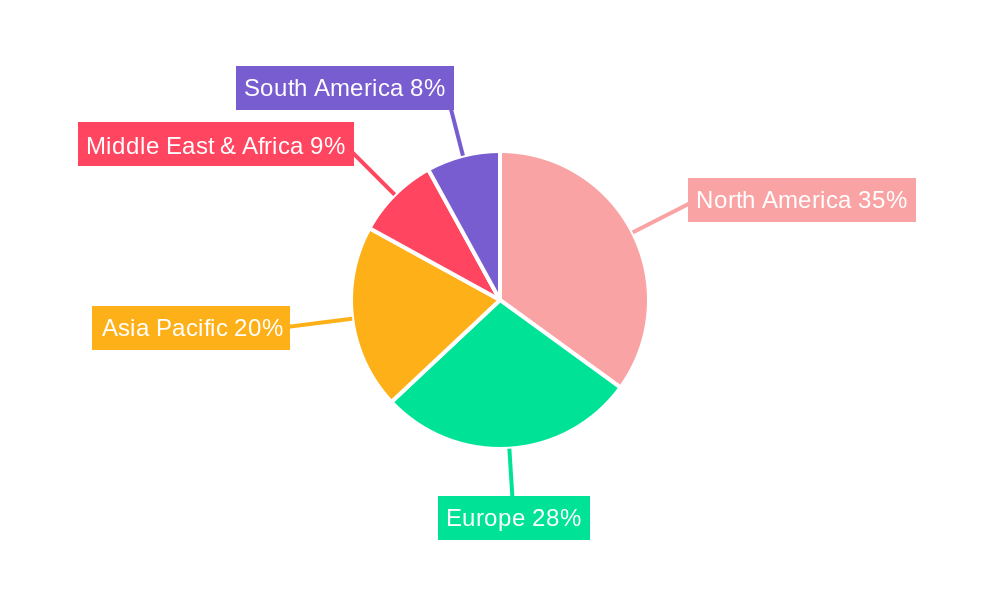
The market is characterized by a dynamic competitive landscape with numerous players offering specialized solutions catering to diverse needs. Key drivers include the rising sophistication of cyber threats targeting software dependencies and the growing awareness among organizations about the potential financial and reputational damage from security breaches and license violations. While the market is experiencing rapid growth, certain restraints exist, such as the initial cost of implementation and the ongoing need for skilled personnel to manage SCA processes effectively. However, the increasing maturity of SCA technologies, coupled with the growing need for DevSecOps integration, is expected to overcome these limitations. The market is segmented by application, with large DevOps teams being the dominant segment due to their extensive use of OSS and complex development workflows, and by type, with cloud-based solutions expected to lead market share. Geographically, North America and Europe are anticipated to remain dominant regions, driven by advanced technological adoption and stringent regulatory frameworks, while the Asia Pacific region is projected to exhibit the fastest growth due to its burgeoning software development ecosystem.
Software Composition Analysis Tool Company Market Share
The Software Composition Analysis (SCA) tool market is characterized by dynamic forces shaping its competitive landscape and technological evolution. Market concentration is moderate, with a blend of established players and emerging innovators vying for dominance. Key drivers of technological innovation include the ever-increasing complexity of software supply chains, the escalating threat of open-source vulnerabilities, and the growing demand for automated security and compliance solutions. Regulatory frameworks, particularly around data privacy and software bill of materials (SBOM) mandates, are increasingly influencing market direction, pushing for greater transparency and accountability in software development. Competitive product substitutes, while present in the form of manual code reviews or more general application security testing (AST) tools, are often outmatched by the specialized, automated capabilities of SCA. End-user demographics span a wide spectrum, from solo developers to large enterprise DevOps teams, each with distinct needs and adoption patterns. Mergers and acquisitions (M&A) trends indicate a consolidation phase, with larger players acquiring smaller, innovative companies to expand their feature sets and market reach. For example, the period 2019-2024 saw an estimated 12 significant M&A deals, with a total estimated deal value of over $750 million, reflecting strategic consolidation. Barriers to innovation include the continuous need for keeping pace with evolving open-source libraries and the challenge of accurately identifying and classifying all software components within complex applications.
Software Composition Analysis Tool Growth Trends & Insights
The global Software Composition Analysis (SCA) tool market is poised for significant expansion, driven by a confluence of escalating cybersecurity threats and evolving regulatory landscapes. The market size, estimated at $2,400 million in the base year of 2025, is projected to surge to $7,800 million by the end of the forecast period in 2033, exhibiting a robust Compound Annual Growth Rate (CAGR) of approximately 16.5%. This growth trajectory is underpinned by increasing adoption rates across all segments of software development. Large DevOps teams, in particular, are embracing SCA solutions at an accelerated pace, recognizing their critical role in embedding security early in the development lifecycle. Technological disruptions, such as advancements in AI-powered vulnerability detection and automated policy enforcement, are further enhancing the appeal and efficacy of SCA tools. Consumer behavior shifts are evident, with a growing emphasis on proactive risk management and a move away from reactive security measures. The historical period of 2019–2024 witnessed a foundational growth phase, where awareness of open-source risks began to permeate the industry, setting the stage for the accelerated adoption observed from 2025 onwards. Market penetration is currently estimated at 35% and is projected to reach over 70% by 2033, indicating a substantial runway for future growth. The increasing volume and sophistication of cyberattacks targeting software supply chains are compelling organizations of all sizes to invest in comprehensive SCA solutions, making it an indispensable component of modern DevSecOps practices. The integration of SCA into CI/CD pipelines is no longer a niche practice but a mainstream requirement for delivering secure and compliant software.
Dominant Regions, Countries, or Segments in Software Composition Analysis Tool
North America is currently the dominant region in the Software Composition Analysis (SCA) tool market, driven by its advanced technological infrastructure, a high concentration of software development companies, and stringent cybersecurity regulations. In 2025, North America is estimated to command a market share of approximately 40%, translating to $960 million in revenue. The United States, in particular, is a key contributor, with leading technology hubs and a proactive approach to cybersecurity adoption. The presence of major technology players like GitLab, GitHub, WhiteSource Software, Synopsys, and Snyk, many of whom are headquartered or have significant operations in the region, further solidifies its leadership. Economic policies that encourage innovation and investment in cybersecurity, coupled with a highly skilled workforce, are pivotal growth factors.
Within the application segments, Large DevOps Teams are the primary market drivers, accounting for an estimated 55% of the total SCA tool market in 2025, valued at $1,320 million. This dominance stems from the complexity of their software development processes, the extensive use of open-source components, and the critical need for scalable and automated security solutions. Their ability to integrate SCA seamlessly into their CI/CD pipelines allows for continuous monitoring and rapid remediation of vulnerabilities.
Analyzing the types of deployment, Cloud-based SCA solutions are emerging as the most impactful segment, projected to capture 65% of the market by 2025, representing $1,560 million in market value. This preference is fueled by the inherent scalability, flexibility, and cost-effectiveness of cloud solutions, aligning perfectly with the agile methodologies adopted by modern development teams. The ease of integration, reduced IT overhead, and continuous updates provided by cloud platforms make them the preferred choice for most organizations. The global market for SCA tools, encompassing these dominant factors, is projected to reach $2,400 million in 2025.
Software Composition Analysis Tool Product Landscape
The Software Composition Analysis (SCA) tool product landscape is characterized by rapid innovation, offering sophisticated solutions for identifying, tracking, and managing open-source components and their associated vulnerabilities. Key product innovations include enhanced accuracy in dependency mapping, deeper code analysis for proprietary code vulnerabilities, and intelligent policy engines for automated compliance enforcement. Applications range from proactive vulnerability detection in code repositories and build pipelines to ensuring compliance with licensing agreements and regulatory mandates like SBOM generation. Performance metrics are increasingly focused on scan speed, accuracy of vulnerability identification, and the comprehensiveness of the software bill of materials. Unique selling propositions often lie in the depth of integration with existing development workflows, the breadth of supported programming languages and package managers, and advanced remediation guidance. Technological advancements are continuously pushing the boundaries, with AI and machine learning playing a greater role in predicting zero-day vulnerabilities and optimizing the scanning process.
Key Drivers, Barriers & Challenges in Software Composition Analysis Tool
Key Drivers:
- Escalating Cybersecurity Threats: The surge in open-source vulnerabilities and supply chain attacks, estimated to impact over 70% of modern applications, is a primary growth propellant.
- Regulatory Mandates: Increasing government regulations worldwide, such as SBOM requirements, are compelling organizations to adopt SCA for compliance.
- DevSecOps Adoption: The growing integration of security into the DevOps pipeline necessitates automated tools like SCA for continuous monitoring.
- Complexity of Software Supply Chains: The widespread use of open-source software in complex, multi-layered applications makes manual tracking impossible.
Barriers & Challenges:
- False Positives/Negatives: Inaccurate vulnerability reporting can lead to wasted developer time or missed critical risks.
- Integration Complexity: Seamless integration with diverse development environments and CI/CD pipelines can be challenging.
- Cost of Implementation: For smaller organizations, the initial investment in sophisticated SCA tools can be a deterrent.
- Evolving Open-Source Landscape: The continuous release of new open-source components and vulnerabilities requires constant updates to SCA databases, with an estimated 15% annual increase in known vulnerabilities.
Emerging Opportunities in Software Composition Analysis Tool
Emerging opportunities in the SCA tool market lie in the expansion of AI-driven predictive vulnerability analysis, moving beyond reactive identification to proactively anticipating potential risks. The growing demand for automated SBOM generation and management, particularly with upcoming regulatory deadlines, presents a significant untapped market. Furthermore, the integration of SCA capabilities into broader cloud-native security platforms and the development of specialized SCA solutions for niche industries like IoT and embedded systems offer considerable growth potential. The increasing focus on license compliance and the need for robust tools that can navigate complex open-source licensing models also present a fertile ground for innovation and market penetration.
Growth Accelerators in the Software Composition Analysis Industry
Several catalysts are accelerating the growth of the SCA industry. Technological breakthroughs in machine learning for advanced threat detection and the automation of vulnerability remediation are crucial. Strategic partnerships between SCA vendors and cloud providers, as well as development platforms like GitLab and GitHub, are expanding market reach and improving integration. Market expansion strategies are focusing on providing more accessible and cost-effective solutions for small and medium-sized businesses. The increasing global awareness of software supply chain security, amplified by high-profile cyber incidents, is further accelerating adoption. The continuous evolution of security standards and the proactive stance of major industry players are creating a sustained demand for sophisticated SCA solutions.
Key Players Shaping the Software Composition Analysis Tool Market
- GitLab
- GitHub
- WhiteSource Software
- Synopsys
- Snyk
- CAST
- Contrast Security
- Threatwatch
- Bytesafe
- JFrog
- Argon Security
- Revenera
- Veracode
- Active State
- BluBracket
- Debricked
- OWASP
- FOSSA
- Hoss
- MergeBase Software
- Sonatype
- rezilion
- SCANOSS
- ShiftLeft
- SOOS
- SourceClear
- Timesys
- WhiteHat Security
Notable Milestones in Software Composition Analysis Tool Sector
- 2019: Increased focus on SBOMs by government agencies begins to influence industry adoption of SCA.
- 2020: Major SCA vendors introduce enhanced AI capabilities for more accurate vulnerability detection.
- 2021: The SolarWinds attack highlights the critical importance of software supply chain security, driving significant market growth.
- 2022: Increased M&A activity as larger players acquire specialized SCA startups to bolster their offerings.
- 2023: Release of more comprehensive license compliance features and integrations within SCA platforms.
- 2024: Growing emphasis on IaC (Infrastructure as Code) security scanning, integrating SCA principles into infrastructure management.
- January 2025: Expected acceleration in adoption due to anticipated new SBOM-related regulations.
In-Depth Software Composition Analysis Tool Market Outlook
The Software Composition Analysis (SCA) tool market is set for a period of sustained and robust growth, driven by an increasing awareness of software supply chain risks and stringent regulatory requirements. Growth accelerators include advancements in AI and machine learning for predictive threat intelligence, enabling SCA tools to identify vulnerabilities before they are exploited. Strategic partnerships between SCA vendors and leading development platforms will further streamline adoption and integration into existing workflows. The market will also witness an expansion of specialized SCA solutions catering to the unique needs of emerging technologies like edge computing and blockchain. The ongoing trend of digital transformation across industries will necessitate a heightened focus on securing the software development lifecycle, making SCA an indispensable component of any cybersecurity strategy, with the market projected to reach $7,800 million by 2033.
Software Composition Analysis Tool Segmentation
-
1. Application
- 1.1. Solo Developers
- 1.2. Small Development Teams
- 1.3. Large Devops Teams
-
2. Types
- 2.1. Cloud-based
- 2.2. On-premises
Software Composition Analysis Tool Segmentation By Geography
-
1. North America
- 1.1. United States
- 1.2. Canada
- 1.3. Mexico
-
2. South America
- 2.1. Brazil
- 2.2. Argentina
- 2.3. Rest of South America
-
3. Europe
- 3.1. United Kingdom
- 3.2. Germany
- 3.3. France
- 3.4. Italy
- 3.5. Spain
- 3.6. Russia
- 3.7. Benelux
- 3.8. Nordics
- 3.9. Rest of Europe
-
4. Middle East & Africa
- 4.1. Turkey
- 4.2. Israel
- 4.3. GCC
- 4.4. North Africa
- 4.5. South Africa
- 4.6. Rest of Middle East & Africa
-
5. Asia Pacific
- 5.1. China
- 5.2. India
- 5.3. Japan
- 5.4. South Korea
- 5.5. ASEAN
- 5.6. Oceania
- 5.7. Rest of Asia Pacific
Software Composition Analysis Tool Regional Market Share
Geographic Coverage of Software Composition Analysis Tool
Software Composition Analysis Tool REPORT HIGHLIGHTS
| Aspects | Details |
|---|---|
| Study Period | 2020-2034 |
| Base Year | 2025 |
| Estimated Year | 2026 |
| Forecast Period | 2026-2034 |
| Historical Period | 2020-2025 |
| Growth Rate | CAGR of XX% from 2020-2034 |
| Segmentation |
|
Table of Contents
- 1. Introduction
- 1.1. Research Scope
- 1.2. Market Segmentation
- 1.3. Research Methodology
- 1.4. Definitions and Assumptions
- 2. Executive Summary
- 2.1. Introduction
- 3. Market Dynamics
- 3.1. Introduction
- 3.2. Market Drivers
- 3.3. Market Restrains
- 3.4. Market Trends
- 4. Market Factor Analysis
- 4.1. Porters Five Forces
- 4.2. Supply/Value Chain
- 4.3. PESTEL analysis
- 4.4. Market Entropy
- 4.5. Patent/Trademark Analysis
- 5. Global Software Composition Analysis Tool Analysis, Insights and Forecast, 2020-2032
- 5.1. Market Analysis, Insights and Forecast - by Application
- 5.1.1. Solo Developers
- 5.1.2. Small Development Teams
- 5.1.3. Large Devops Teams
- 5.2. Market Analysis, Insights and Forecast - by Types
- 5.2.1. Cloud-based
- 5.2.2. On-premises
- 5.3. Market Analysis, Insights and Forecast - by Region
- 5.3.1. North America
- 5.3.2. South America
- 5.3.3. Europe
- 5.3.4. Middle East & Africa
- 5.3.5. Asia Pacific
- 5.1. Market Analysis, Insights and Forecast - by Application
- 6. North America Software Composition Analysis Tool Analysis, Insights and Forecast, 2020-2032
- 6.1. Market Analysis, Insights and Forecast - by Application
- 6.1.1. Solo Developers
- 6.1.2. Small Development Teams
- 6.1.3. Large Devops Teams
- 6.2. Market Analysis, Insights and Forecast - by Types
- 6.2.1. Cloud-based
- 6.2.2. On-premises
- 6.1. Market Analysis, Insights and Forecast - by Application
- 7. South America Software Composition Analysis Tool Analysis, Insights and Forecast, 2020-2032
- 7.1. Market Analysis, Insights and Forecast - by Application
- 7.1.1. Solo Developers
- 7.1.2. Small Development Teams
- 7.1.3. Large Devops Teams
- 7.2. Market Analysis, Insights and Forecast - by Types
- 7.2.1. Cloud-based
- 7.2.2. On-premises
- 7.1. Market Analysis, Insights and Forecast - by Application
- 8. Europe Software Composition Analysis Tool Analysis, Insights and Forecast, 2020-2032
- 8.1. Market Analysis, Insights and Forecast - by Application
- 8.1.1. Solo Developers
- 8.1.2. Small Development Teams
- 8.1.3. Large Devops Teams
- 8.2. Market Analysis, Insights and Forecast - by Types
- 8.2.1. Cloud-based
- 8.2.2. On-premises
- 8.1. Market Analysis, Insights and Forecast - by Application
- 9. Middle East & Africa Software Composition Analysis Tool Analysis, Insights and Forecast, 2020-2032
- 9.1. Market Analysis, Insights and Forecast - by Application
- 9.1.1. Solo Developers
- 9.1.2. Small Development Teams
- 9.1.3. Large Devops Teams
- 9.2. Market Analysis, Insights and Forecast - by Types
- 9.2.1. Cloud-based
- 9.2.2. On-premises
- 9.1. Market Analysis, Insights and Forecast - by Application
- 10. Asia Pacific Software Composition Analysis Tool Analysis, Insights and Forecast, 2020-2032
- 10.1. Market Analysis, Insights and Forecast - by Application
- 10.1.1. Solo Developers
- 10.1.2. Small Development Teams
- 10.1.3. Large Devops Teams
- 10.2. Market Analysis, Insights and Forecast - by Types
- 10.2.1. Cloud-based
- 10.2.2. On-premises
- 10.1. Market Analysis, Insights and Forecast - by Application
- 11. Competitive Analysis
- 11.1. Global Market Share Analysis 2025
- 11.2. Company Profiles
- 11.2.1 GitLab
- 11.2.1.1. Overview
- 11.2.1.2. Products
- 11.2.1.3. SWOT Analysis
- 11.2.1.4. Recent Developments
- 11.2.1.5. Financials (Based on Availability)
- 11.2.2 GitHub
- 11.2.2.1. Overview
- 11.2.2.2. Products
- 11.2.2.3. SWOT Analysis
- 11.2.2.4. Recent Developments
- 11.2.2.5. Financials (Based on Availability)
- 11.2.3 WhiteSource Software
- 11.2.3.1. Overview
- 11.2.3.2. Products
- 11.2.3.3. SWOT Analysis
- 11.2.3.4. Recent Developments
- 11.2.3.5. Financials (Based on Availability)
- 11.2.4 Synopsys
- 11.2.4.1. Overview
- 11.2.4.2. Products
- 11.2.4.3. SWOT Analysis
- 11.2.4.4. Recent Developments
- 11.2.4.5. Financials (Based on Availability)
- 11.2.5 Snyk
- 11.2.5.1. Overview
- 11.2.5.2. Products
- 11.2.5.3. SWOT Analysis
- 11.2.5.4. Recent Developments
- 11.2.5.5. Financials (Based on Availability)
- 11.2.6 CAST
- 11.2.6.1. Overview
- 11.2.6.2. Products
- 11.2.6.3. SWOT Analysis
- 11.2.6.4. Recent Developments
- 11.2.6.5. Financials (Based on Availability)
- 11.2.7 Contrast Security
- 11.2.7.1. Overview
- 11.2.7.2. Products
- 11.2.7.3. SWOT Analysis
- 11.2.7.4. Recent Developments
- 11.2.7.5. Financials (Based on Availability)
- 11.2.8 Threatwatch
- 11.2.8.1. Overview
- 11.2.8.2. Products
- 11.2.8.3. SWOT Analysis
- 11.2.8.4. Recent Developments
- 11.2.8.5. Financials (Based on Availability)
- 11.2.9 Bytesafe
- 11.2.9.1. Overview
- 11.2.9.2. Products
- 11.2.9.3. SWOT Analysis
- 11.2.9.4. Recent Developments
- 11.2.9.5. Financials (Based on Availability)
- 11.2.10 JFrog
- 11.2.10.1. Overview
- 11.2.10.2. Products
- 11.2.10.3. SWOT Analysis
- 11.2.10.4. Recent Developments
- 11.2.10.5. Financials (Based on Availability)
- 11.2.11 Argon Security
- 11.2.11.1. Overview
- 11.2.11.2. Products
- 11.2.11.3. SWOT Analysis
- 11.2.11.4. Recent Developments
- 11.2.11.5. Financials (Based on Availability)
- 11.2.12 Revenera
- 11.2.12.1. Overview
- 11.2.12.2. Products
- 11.2.12.3. SWOT Analysis
- 11.2.12.4. Recent Developments
- 11.2.12.5. Financials (Based on Availability)
- 11.2.13 Veracode
- 11.2.13.1. Overview
- 11.2.13.2. Products
- 11.2.13.3. SWOT Analysis
- 11.2.13.4. Recent Developments
- 11.2.13.5. Financials (Based on Availability)
- 11.2.14 Active State
- 11.2.14.1. Overview
- 11.2.14.2. Products
- 11.2.14.3. SWOT Analysis
- 11.2.14.4. Recent Developments
- 11.2.14.5. Financials (Based on Availability)
- 11.2.15 BluBracket
- 11.2.15.1. Overview
- 11.2.15.2. Products
- 11.2.15.3. SWOT Analysis
- 11.2.15.4. Recent Developments
- 11.2.15.5. Financials (Based on Availability)
- 11.2.16 Debricked
- 11.2.16.1. Overview
- 11.2.16.2. Products
- 11.2.16.3. SWOT Analysis
- 11.2.16.4. Recent Developments
- 11.2.16.5. Financials (Based on Availability)
- 11.2.17 OWASP
- 11.2.17.1. Overview
- 11.2.17.2. Products
- 11.2.17.3. SWOT Analysis
- 11.2.17.4. Recent Developments
- 11.2.17.5. Financials (Based on Availability)
- 11.2.18 FOSSA
- 11.2.18.1. Overview
- 11.2.18.2. Products
- 11.2.18.3. SWOT Analysis
- 11.2.18.4. Recent Developments
- 11.2.18.5. Financials (Based on Availability)
- 11.2.19 Hoss
- 11.2.19.1. Overview
- 11.2.19.2. Products
- 11.2.19.3. SWOT Analysis
- 11.2.19.4. Recent Developments
- 11.2.19.5. Financials (Based on Availability)
- 11.2.20 MergeBase Software
- 11.2.20.1. Overview
- 11.2.20.2. Products
- 11.2.20.3. SWOT Analysis
- 11.2.20.4. Recent Developments
- 11.2.20.5. Financials (Based on Availability)
- 11.2.21 Sonatype
- 11.2.21.1. Overview
- 11.2.21.2. Products
- 11.2.21.3. SWOT Analysis
- 11.2.21.4. Recent Developments
- 11.2.21.5. Financials (Based on Availability)
- 11.2.22 rezilion
- 11.2.22.1. Overview
- 11.2.22.2. Products
- 11.2.22.3. SWOT Analysis
- 11.2.22.4. Recent Developments
- 11.2.22.5. Financials (Based on Availability)
- 11.2.23 SCANOSS
- 11.2.23.1. Overview
- 11.2.23.2. Products
- 11.2.23.3. SWOT Analysis
- 11.2.23.4. Recent Developments
- 11.2.23.5. Financials (Based on Availability)
- 11.2.24 ShiftLeft
- 11.2.24.1. Overview
- 11.2.24.2. Products
- 11.2.24.3. SWOT Analysis
- 11.2.24.4. Recent Developments
- 11.2.24.5. Financials (Based on Availability)
- 11.2.25 SOOS
- 11.2.25.1. Overview
- 11.2.25.2. Products
- 11.2.25.3. SWOT Analysis
- 11.2.25.4. Recent Developments
- 11.2.25.5. Financials (Based on Availability)
- 11.2.26 SourceClear
- 11.2.26.1. Overview
- 11.2.26.2. Products
- 11.2.26.3. SWOT Analysis
- 11.2.26.4. Recent Developments
- 11.2.26.5. Financials (Based on Availability)
- 11.2.27 Timesys
- 11.2.27.1. Overview
- 11.2.27.2. Products
- 11.2.27.3. SWOT Analysis
- 11.2.27.4. Recent Developments
- 11.2.27.5. Financials (Based on Availability)
- 11.2.28 WhiteHat Security
- 11.2.28.1. Overview
- 11.2.28.2. Products
- 11.2.28.3. SWOT Analysis
- 11.2.28.4. Recent Developments
- 11.2.28.5. Financials (Based on Availability)
- 11.2.1 GitLab
List of Figures
- Figure 1: Global Software Composition Analysis Tool Revenue Breakdown (million, %) by Region 2025 & 2033
- Figure 2: North America Software Composition Analysis Tool Revenue (million), by Application 2025 & 2033
- Figure 3: North America Software Composition Analysis Tool Revenue Share (%), by Application 2025 & 2033
- Figure 4: North America Software Composition Analysis Tool Revenue (million), by Types 2025 & 2033
- Figure 5: North America Software Composition Analysis Tool Revenue Share (%), by Types 2025 & 2033
- Figure 6: North America Software Composition Analysis Tool Revenue (million), by Country 2025 & 2033
- Figure 7: North America Software Composition Analysis Tool Revenue Share (%), by Country 2025 & 2033
- Figure 8: South America Software Composition Analysis Tool Revenue (million), by Application 2025 & 2033
- Figure 9: South America Software Composition Analysis Tool Revenue Share (%), by Application 2025 & 2033
- Figure 10: South America Software Composition Analysis Tool Revenue (million), by Types 2025 & 2033
- Figure 11: South America Software Composition Analysis Tool Revenue Share (%), by Types 2025 & 2033
- Figure 12: South America Software Composition Analysis Tool Revenue (million), by Country 2025 & 2033
- Figure 13: South America Software Composition Analysis Tool Revenue Share (%), by Country 2025 & 2033
- Figure 14: Europe Software Composition Analysis Tool Revenue (million), by Application 2025 & 2033
- Figure 15: Europe Software Composition Analysis Tool Revenue Share (%), by Application 2025 & 2033
- Figure 16: Europe Software Composition Analysis Tool Revenue (million), by Types 2025 & 2033
- Figure 17: Europe Software Composition Analysis Tool Revenue Share (%), by Types 2025 & 2033
- Figure 18: Europe Software Composition Analysis Tool Revenue (million), by Country 2025 & 2033
- Figure 19: Europe Software Composition Analysis Tool Revenue Share (%), by Country 2025 & 2033
- Figure 20: Middle East & Africa Software Composition Analysis Tool Revenue (million), by Application 2025 & 2033
- Figure 21: Middle East & Africa Software Composition Analysis Tool Revenue Share (%), by Application 2025 & 2033
- Figure 22: Middle East & Africa Software Composition Analysis Tool Revenue (million), by Types 2025 & 2033
- Figure 23: Middle East & Africa Software Composition Analysis Tool Revenue Share (%), by Types 2025 & 2033
- Figure 24: Middle East & Africa Software Composition Analysis Tool Revenue (million), by Country 2025 & 2033
- Figure 25: Middle East & Africa Software Composition Analysis Tool Revenue Share (%), by Country 2025 & 2033
- Figure 26: Asia Pacific Software Composition Analysis Tool Revenue (million), by Application 2025 & 2033
- Figure 27: Asia Pacific Software Composition Analysis Tool Revenue Share (%), by Application 2025 & 2033
- Figure 28: Asia Pacific Software Composition Analysis Tool Revenue (million), by Types 2025 & 2033
- Figure 29: Asia Pacific Software Composition Analysis Tool Revenue Share (%), by Types 2025 & 2033
- Figure 30: Asia Pacific Software Composition Analysis Tool Revenue (million), by Country 2025 & 2033
- Figure 31: Asia Pacific Software Composition Analysis Tool Revenue Share (%), by Country 2025 & 2033
List of Tables
- Table 1: Global Software Composition Analysis Tool Revenue million Forecast, by Application 2020 & 2033
- Table 2: Global Software Composition Analysis Tool Revenue million Forecast, by Types 2020 & 2033
- Table 3: Global Software Composition Analysis Tool Revenue million Forecast, by Region 2020 & 2033
- Table 4: Global Software Composition Analysis Tool Revenue million Forecast, by Application 2020 & 2033
- Table 5: Global Software Composition Analysis Tool Revenue million Forecast, by Types 2020 & 2033
- Table 6: Global Software Composition Analysis Tool Revenue million Forecast, by Country 2020 & 2033
- Table 7: United States Software Composition Analysis Tool Revenue (million) Forecast, by Application 2020 & 2033
- Table 8: Canada Software Composition Analysis Tool Revenue (million) Forecast, by Application 2020 & 2033
- Table 9: Mexico Software Composition Analysis Tool Revenue (million) Forecast, by Application 2020 & 2033
- Table 10: Global Software Composition Analysis Tool Revenue million Forecast, by Application 2020 & 2033
- Table 11: Global Software Composition Analysis Tool Revenue million Forecast, by Types 2020 & 2033
- Table 12: Global Software Composition Analysis Tool Revenue million Forecast, by Country 2020 & 2033
- Table 13: Brazil Software Composition Analysis Tool Revenue (million) Forecast, by Application 2020 & 2033
- Table 14: Argentina Software Composition Analysis Tool Revenue (million) Forecast, by Application 2020 & 2033
- Table 15: Rest of South America Software Composition Analysis Tool Revenue (million) Forecast, by Application 2020 & 2033
- Table 16: Global Software Composition Analysis Tool Revenue million Forecast, by Application 2020 & 2033
- Table 17: Global Software Composition Analysis Tool Revenue million Forecast, by Types 2020 & 2033
- Table 18: Global Software Composition Analysis Tool Revenue million Forecast, by Country 2020 & 2033
- Table 19: United Kingdom Software Composition Analysis Tool Revenue (million) Forecast, by Application 2020 & 2033
- Table 20: Germany Software Composition Analysis Tool Revenue (million) Forecast, by Application 2020 & 2033
- Table 21: France Software Composition Analysis Tool Revenue (million) Forecast, by Application 2020 & 2033
- Table 22: Italy Software Composition Analysis Tool Revenue (million) Forecast, by Application 2020 & 2033
- Table 23: Spain Software Composition Analysis Tool Revenue (million) Forecast, by Application 2020 & 2033
- Table 24: Russia Software Composition Analysis Tool Revenue (million) Forecast, by Application 2020 & 2033
- Table 25: Benelux Software Composition Analysis Tool Revenue (million) Forecast, by Application 2020 & 2033
- Table 26: Nordics Software Composition Analysis Tool Revenue (million) Forecast, by Application 2020 & 2033
- Table 27: Rest of Europe Software Composition Analysis Tool Revenue (million) Forecast, by Application 2020 & 2033
- Table 28: Global Software Composition Analysis Tool Revenue million Forecast, by Application 2020 & 2033
- Table 29: Global Software Composition Analysis Tool Revenue million Forecast, by Types 2020 & 2033
- Table 30: Global Software Composition Analysis Tool Revenue million Forecast, by Country 2020 & 2033
- Table 31: Turkey Software Composition Analysis Tool Revenue (million) Forecast, by Application 2020 & 2033
- Table 32: Israel Software Composition Analysis Tool Revenue (million) Forecast, by Application 2020 & 2033
- Table 33: GCC Software Composition Analysis Tool Revenue (million) Forecast, by Application 2020 & 2033
- Table 34: North Africa Software Composition Analysis Tool Revenue (million) Forecast, by Application 2020 & 2033
- Table 35: South Africa Software Composition Analysis Tool Revenue (million) Forecast, by Application 2020 & 2033
- Table 36: Rest of Middle East & Africa Software Composition Analysis Tool Revenue (million) Forecast, by Application 2020 & 2033
- Table 37: Global Software Composition Analysis Tool Revenue million Forecast, by Application 2020 & 2033
- Table 38: Global Software Composition Analysis Tool Revenue million Forecast, by Types 2020 & 2033
- Table 39: Global Software Composition Analysis Tool Revenue million Forecast, by Country 2020 & 2033
- Table 40: China Software Composition Analysis Tool Revenue (million) Forecast, by Application 2020 & 2033
- Table 41: India Software Composition Analysis Tool Revenue (million) Forecast, by Application 2020 & 2033
- Table 42: Japan Software Composition Analysis Tool Revenue (million) Forecast, by Application 2020 & 2033
- Table 43: South Korea Software Composition Analysis Tool Revenue (million) Forecast, by Application 2020 & 2033
- Table 44: ASEAN Software Composition Analysis Tool Revenue (million) Forecast, by Application 2020 & 2033
- Table 45: Oceania Software Composition Analysis Tool Revenue (million) Forecast, by Application 2020 & 2033
- Table 46: Rest of Asia Pacific Software Composition Analysis Tool Revenue (million) Forecast, by Application 2020 & 2033
Frequently Asked Questions
1. What is the projected Compound Annual Growth Rate (CAGR) of the Software Composition Analysis Tool?
The projected CAGR is approximately XX%.
2. Which companies are prominent players in the Software Composition Analysis Tool?
Key companies in the market include GitLab, GitHub, WhiteSource Software, Synopsys, Snyk, CAST, Contrast Security, Threatwatch, Bytesafe, JFrog, Argon Security, Revenera, Veracode, Active State, BluBracket, Debricked, OWASP, FOSSA, Hoss, MergeBase Software, Sonatype, rezilion, SCANOSS, ShiftLeft, SOOS, SourceClear, Timesys, WhiteHat Security.
3. What are the main segments of the Software Composition Analysis Tool?
The market segments include Application, Types.
4. Can you provide details about the market size?
The market size is estimated to be USD XXX million as of 2022.
5. What are some drivers contributing to market growth?
N/A
6. What are the notable trends driving market growth?
N/A
7. Are there any restraints impacting market growth?
N/A
8. Can you provide examples of recent developments in the market?
N/A
9. What pricing options are available for accessing the report?
Pricing options include single-user, multi-user, and enterprise licenses priced at USD 3350.00, USD 5025.00, and USD 6700.00 respectively.
10. Is the market size provided in terms of value or volume?
The market size is provided in terms of value, measured in million.
11. Are there any specific market keywords associated with the report?
Yes, the market keyword associated with the report is "Software Composition Analysis Tool," which aids in identifying and referencing the specific market segment covered.
12. How do I determine which pricing option suits my needs best?
The pricing options vary based on user requirements and access needs. Individual users may opt for single-user licenses, while businesses requiring broader access may choose multi-user or enterprise licenses for cost-effective access to the report.
13. Are there any additional resources or data provided in the Software Composition Analysis Tool report?
While the report offers comprehensive insights, it's advisable to review the specific contents or supplementary materials provided to ascertain if additional resources or data are available.
14. How can I stay updated on further developments or reports in the Software Composition Analysis Tool?
To stay informed about further developments, trends, and reports in the Software Composition Analysis Tool, consider subscribing to industry newsletters, following relevant companies and organizations, or regularly checking reputable industry news sources and publications.
Methodology
Step 1 - Identification of Relevant Samples Size from Population Database


Step 2 - Approaches for Defining Global Market Size (Value, Volume* & Price*)

Note*: In applicable scenarios
Step 3 - Data Sources
Primary Research
- Web Analytics
- Survey Reports
- Research Institute
- Latest Research Reports
- Opinion Leaders
Secondary Research
- Annual Reports
- White Paper
- Latest Press Release
- Industry Association
- Paid Database
- Investor Presentations

Step 4 - Data Triangulation
Involves using different sources of information in order to increase the validity of a study
These sources are likely to be stakeholders in a program - participants, other researchers, program staff, other community members, and so on.
Then we put all data in single framework & apply various statistical tools to find out the dynamic on the market.
During the analysis stage, feedback from the stakeholder groups would be compared to determine areas of agreement as well as areas of divergence