

Key Insights
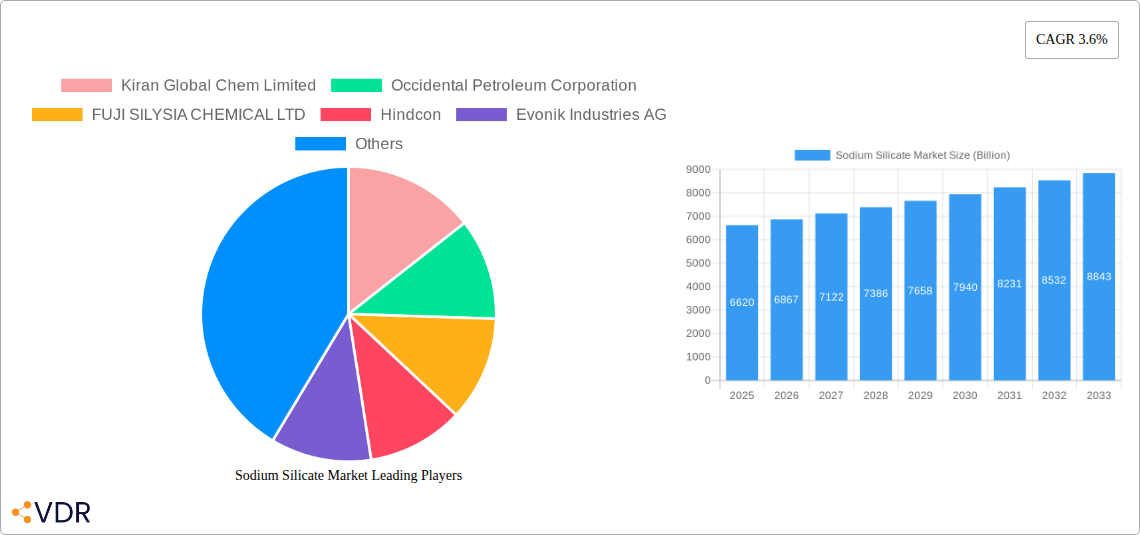
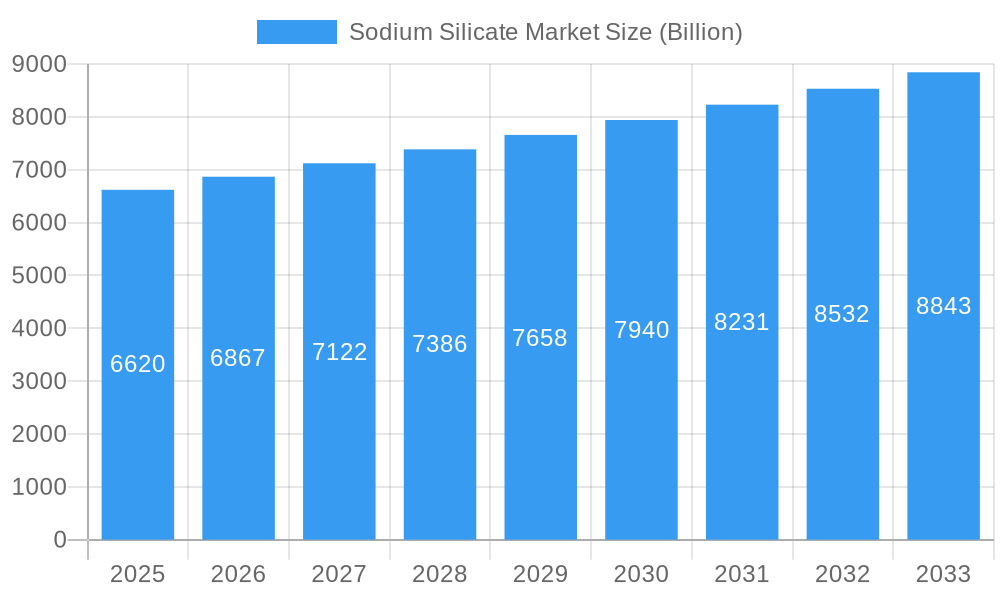
The global sodium silicate market, valued at $6.62 billion in 2025, is projected to experience steady growth, driven by a Compound Annual Growth Rate (CAGR) of 3.6% from 2025 to 2033. This growth is fueled by increasing demand across diverse applications, particularly in the adhesives and paints, detergents, and water treatment sectors. The construction industry's reliance on sodium silicate as a binder and its use in paper production as a sizing agent contribute significantly to market expansion. Growth in developing economies, especially in Asia-Pacific, is expected to significantly boost market volume. The preference for eco-friendly and cost-effective alternatives in various industries further propels sodium silicate's adoption. While competition from other binding agents and potential regulatory hurdles related to environmental concerns present challenges, the overall market outlook remains positive. The market is segmented by type (solid and liquid) and application, reflecting the diverse utility of this versatile chemical. Key players, including Kiran Global Chem Limited, Occidental Petroleum Corporation, and BASF SE, are strategically investing in research and development and expanding their geographical reach to maintain their market positions and cater to increasing demand. The solid form of sodium silicate is likely to dominate the market due to its superior properties in specific applications, though the liquid form maintains significance in certain sectors due to its ease of use.
Sodium Silicate Market Market Size (In Billion)
The market's geographic segmentation reveals significant regional variations. North America and Europe currently hold substantial market shares, driven by established industries and stringent environmental regulations. However, the Asia-Pacific region is poised for substantial growth due to rapid industrialization and increasing construction activities. Strategic partnerships, mergers and acquisitions, and product innovations by leading players will shape the competitive landscape in the coming years. The market is characterized by both large multinational corporations and smaller specialized producers, leading to a dynamic interplay of pricing strategies and product differentiation. Future growth is intrinsically linked to technological advancements, sustainable manufacturing practices, and the continued expansion of key application segments.
Sodium Silicate Market Company Market Share
Sodium Silicate Market: A Comprehensive Report (2019-2033)
This comprehensive report provides an in-depth analysis of the global Sodium Silicate market, encompassing market dynamics, growth trends, regional insights, and competitive landscapes. With a study period spanning 2019-2033, a base year of 2025, and a forecast period of 2025-2033, this report is an invaluable resource for industry professionals, investors, and strategic decision-makers seeking to navigate this dynamic market. The parent market is the chemical industry, and the child market is the industrial chemicals sector. The global market is valued at xx Billion in 2025 and is projected to reach xx Billion by 2033.
Sodium Silicate Market Market Dynamics & Structure
The Sodium Silicate market is characterized by a moderately concentrated landscape, with several key players holding significant market shares. Technological innovation, particularly in sustainable production methods and novel applications, is a major driver. Stringent environmental regulations concerning chemical waste management influence production processes and product development. Competitive pressures from substitute materials, such as alternative binders and detergents, are also present. The market exhibits diverse end-user demographics, ranging from construction and manufacturing to food processing and water treatment. Mergers and acquisitions (M&A) activity has been moderate, with strategic partnerships increasingly common.
- Market Concentration: Moderately concentrated, with top 5 players holding approximately xx% market share in 2025.
- Technological Innovation: Focus on sustainable production, improved performance characteristics, and specialized applications.
- Regulatory Framework: Stringent environmental regulations impact production and waste disposal.
- Competitive Substitutes: Alternative binders, detergents, and water treatment chemicals pose competition.
- End-User Demographics: Diverse, including construction, manufacturing, food, and water treatment sectors.
- M&A Trends: Moderate activity, with strategic partnerships gaining prominence (xx deals recorded between 2019-2024).
Sodium Silicate Market Growth Trends & Insights
The Sodium Silicate market has witnessed steady growth over the historical period (2019-2024), driven by increasing demand across various applications. The market is projected to maintain a healthy CAGR of xx% during the forecast period (2025-2033), fueled by expanding industrialization, infrastructure development, and rising consumer demand for products using sodium silicate. Technological advancements, including the development of more efficient production processes and specialized formulations, are further accelerating market growth. Shifting consumer preferences towards sustainable and eco-friendly products are also impacting market dynamics. Market penetration in emerging economies presents significant growth opportunities.
Dominant Regions, Countries, or Segments in Sodium Silicate Market
The Asia-Pacific region is poised to maintain its dominance in the Sodium Silicate market throughout the forecast period. This sustained leadership is attributed to the region's ongoing rapid industrialization, significant investments in robust infrastructure development, and a consistently expanding construction sector. Countries like China and India are particularly instrumental in fueling this regional growth due to their large manufacturing bases and burgeoning economies. Within the application segments, Adhesives & Paints and Detergents continue to command the largest market share, showcasing their established importance. Furthermore, substantial growth potential is projected for the Water Treatment and Food Preservation segments, driven by increasing global emphasis on sanitation, resource management, and food safety.
- Key Drivers (Asia-Pacific): Accelerated industrialization, substantial infrastructure expansion, burgeoning construction activities, and rising disposable incomes, leading to increased demand for diverse applications.
- Dominant Segments: Adhesives & Paints (estimated xx% market share in 2025) and Detergents (estimated xx% market share in 2025) remain the primary market contributors.
- Growth Potential: Water Treatment (projected CAGR of xx% during 2025-2033) and Food Preservation (projected CAGR of xx% during 2025-2033) are expected to experience significant expansion due to evolving global needs.
Sodium Silicate Market Product Landscape
The Sodium Silicate market is characterized by a diverse and evolving product portfolio, offering a wide array of options in terms of physical form (solid, liquid), purity levels, and specialized applications. Product innovation is keenly focused on elevating performance characteristics, such as enhancing binding strength for construction materials, optimizing viscosity control for industrial processes, and improving water solubility for various formulations. Significant technological advancements are being made, including the integration of nanotechnology to engineer specialized sodium silicate formulations tailored for highly specific and demanding applications. The unique selling propositions (USPs) often highlight a compelling combination of cost-effectiveness, a commitment to environmental sustainability, and superior performance when compared to alternative materials, making it an attractive choice for a broad range of industries.
Key Drivers, Barriers & Challenges in Sodium Silicate Market
Key Drivers: The market is propelled by the robust and escalating demand originating from the construction, detergents, and water treatment industries. The ongoing and extensive infrastructure development in emerging economies further bolsters this demand. Additionally, continuous technological advancements are leading to the creation of products with improved performance capabilities, thereby accelerating market adoption.
Barriers & Challenges: The market faces several significant hurdles, including inherent fluctuations in the prices of key raw materials, which can impact profitability and pricing strategies. Stringent environmental regulations, enacted globally to promote sustainability, necessitate adherence to stricter production and disposal standards. The market also experiences intense competition from substitute materials that may offer similar functionalities, putting pressure on market share. Furthermore, potential disruptions within global supply chains can impact the availability and cost of sodium silicate, posing a risk to market stability. These factors, if not effectively managed and mitigated, could potentially lead to a decrease in the overall market size by an estimated xx% over the forecast period.
Emerging Opportunities in Sodium Silicate Market
The Sodium Silicate market is ripe with emerging opportunities, particularly in the development of innovative applications within advanced materials sectors, the exploration of bio-based sodium silicate production to enhance sustainability, and strategic expansion into underserved or untapped markets in developing countries. A significant growth avenue lies in the creation and adoption of sustainable and environmentally friendly production methods for sodium silicate, directly addressing the growing global environmental consciousness and demand for eco-friendly products. The increasing integration of green technologies across various industries further provides strong tailwinds for market expansion and innovation.
Growth Accelerators in the Sodium Silicate Market Industry
The expansion and dynamism of the Sodium Silicate market are significantly accelerated by strategic partnerships and collaborations forged among key industry players. These alliances foster knowledge sharing, resource pooling, and joint ventures, ultimately driving market growth and nurturing innovation. Technological breakthroughs in production efficiency, leading to reduced costs and higher output, coupled with the development of application-specific formulations that cater to niche market needs, further amplify market growth. The strategic expansion of existing production facilities in critical global markets, alongside the entry of new, innovative players, also contributes substantially to the overall growth trajectory of the Sodium Silicate industry.
Key Players Shaping the Sodium Silicate Market Market
- Kiran Global Chem Limited
- Occidental Petroleum Corporation
- FUJI SILYSIA CHEMICAL LTD
- Hindcon
- Evonik Industries AG
- Silmaco
- BASF SE
- PQ Corporation
- Z Ch Rudniki S A
- C THAI GROUP
- Alumina doo Zvornik
- W R Grace & Co -Conn
- CIECH Group
Notable Milestones in Sodium Silicate Market Sector
- September 2022: Evonik's strategic cooperation with Porner Group and Phichit Bio Power for sustainable ULTRASIL precipitated silica supply to tire manufacturers signifies a shift towards sustainable solutions within the market.
In-Depth Sodium Silicate Market Market Outlook
The Sodium Silicate market is poised for robust growth over the forecast period, driven by sustained demand from key application sectors and the continuous development of innovative products. Strategic collaborations, technological advancements, and expansion into emerging markets will further contribute to long-term growth. The market presents significant opportunities for companies focusing on sustainability and technological innovation.
Sodium Silicate Market Segmentation
-
1. Type
- 1.1. Solid
- 1.2. Liquid
-
2. Application
- 2.1. Adhesives and Paints
- 2.2. Detergents
- 2.3. Food Preservation
- 2.4. Precipitated Silica
- 2.5. Paper Production
- 2.6. Water Treatment
- 2.7. Other Applications (Construction, Metal Casting)
Sodium Silicate Market Segmentation By Geography
-
1. Asia Pacific
- 1.1. China
- 1.2. India
- 1.3. Japan
- 1.4. South Korea
- 1.5. Rest of Asia Pacific
-
2. North America
- 2.1. United States
- 2.2. Canada
- 2.3. Mexico
-
3. Europe
- 3.1. Germany
- 3.2. United Kingdom
- 3.3. Italy
- 3.4. France
- 3.5. Rest of Europe
-
4. South America
- 4.1. Brazil
- 4.2. Argentina
- 4.3. Rest of South America
-
5. Middle East and Africa
- 5.1. Saudi Arabia
- 5.2. South Africa
- 5.3. Rest of Middle East and Africa
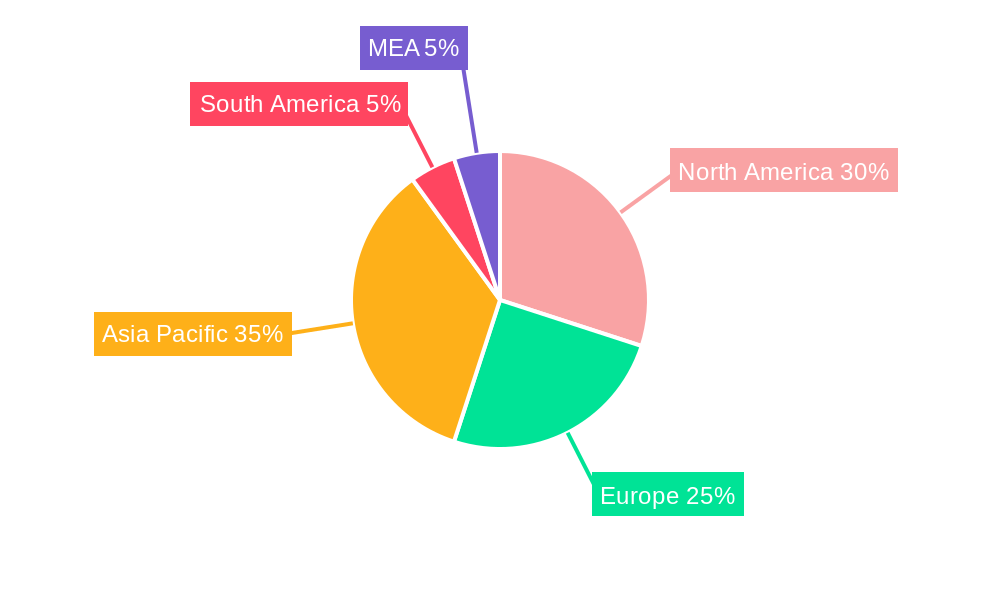
Sodium Silicate Market Regional Market Share
Geographic Coverage of Sodium Silicate Market
Sodium Silicate Market REPORT HIGHLIGHTS
| Aspects | Details |
|---|---|
| Study Period | 2020-2034 |
| Base Year | 2025 |
| Estimated Year | 2026 |
| Forecast Period | 2026-2034 |
| Historical Period | 2020-2025 |
| Growth Rate | CAGR of 3.6% from 2020-2034 |
| Segmentation |
|
Table of Contents
- 1. Introduction
- 1.1. Research Scope
- 1.2. Market Segmentation
- 1.3. Research Objective
- 1.4. Definitions and Assumptions
- 2. Executive Summary
- 2.1. Market Snapshot
- 3. Market Dynamics
- 3.1. Market Drivers
- 3.2. Market Restrains
- 3.3. Market Trends
- 3.4. Market Opportunities
- 4. Market Factor Analysis
- 4.1. Porters Five Forces
- 4.1.1. Bargaining Power of Suppliers
- 4.1.2. Bargaining Power of Buyers
- 4.1.3. Threat of New Entrants
- 4.1.4. Threat of Substitutes
- 4.1.5. Competitive Rivalry
- 4.2. PESTEL analysis
- 4.3. BCG Analysis
- 4.3.1. Stars (High Growth, High Market Share)
- 4.3.2. Cash Cows (Low Growth, High Market Share)
- 4.3.3. Question Mark (High Growth, Low Market Share)
- 4.3.4. Dogs (Low Growth, Low Market Share)
- 4.4. Ansoff Matrix Analysis
- 4.5. Supply Chain Analysis
- 4.6. Regulatory Landscape
- 4.7. Current Market Potential and Opportunity Assessment (TAM–SAM–SOM Framework)
- 4.8. VDR Analyst Note
- 4.1. Porters Five Forces
- 5. Market Analysis, Insights and Forecast 2021-2033
- 5.1. Market Analysis, Insights and Forecast - by Type
- 5.1.1. Solid
- 5.1.2. Liquid
- 5.2. Market Analysis, Insights and Forecast - by Application
- 5.2.1. Adhesives and Paints
- 5.2.2. Detergents
- 5.2.3. Food Preservation
- 5.2.4. Precipitated Silica
- 5.2.5. Paper Production
- 5.2.6. Water Treatment
- 5.2.7. Other Applications (Construction, Metal Casting)
- 5.3. Market Analysis, Insights and Forecast - by Region
- 5.3.1. Asia Pacific
- 5.3.2. North America
- 5.3.3. Europe
- 5.3.4. South America
- 5.3.5. Middle East and Africa
- 5.1. Market Analysis, Insights and Forecast - by Type
- 6. Global Sodium Silicate Market Analysis, Insights and Forecast, 2021-2033
- 6.1. Market Analysis, Insights and Forecast - by Type
- 6.1.1. Solid
- 6.1.2. Liquid
- 6.2. Market Analysis, Insights and Forecast - by Application
- 6.2.1. Adhesives and Paints
- 6.2.2. Detergents
- 6.2.3. Food Preservation
- 6.2.4. Precipitated Silica
- 6.2.5. Paper Production
- 6.2.6. Water Treatment
- 6.2.7. Other Applications (Construction, Metal Casting)
- 6.1. Market Analysis, Insights and Forecast - by Type
- 7. Asia Pacific Sodium Silicate Market Analysis, Insights and Forecast, 2021-2033
- 7.1. Market Analysis, Insights and Forecast - by Type
- 7.1.1. Solid
- 7.1.2. Liquid
- 7.2. Market Analysis, Insights and Forecast - by Application
- 7.2.1. Adhesives and Paints
- 7.2.2. Detergents
- 7.2.3. Food Preservation
- 7.2.4. Precipitated Silica
- 7.2.5. Paper Production
- 7.2.6. Water Treatment
- 7.2.7. Other Applications (Construction, Metal Casting)
- 7.1. Market Analysis, Insights and Forecast - by Type
- 8. North America Sodium Silicate Market Analysis, Insights and Forecast, 2021-2033
- 8.1. Market Analysis, Insights and Forecast - by Type
- 8.1.1. Solid
- 8.1.2. Liquid
- 8.2. Market Analysis, Insights and Forecast - by Application
- 8.2.1. Adhesives and Paints
- 8.2.2. Detergents
- 8.2.3. Food Preservation
- 8.2.4. Precipitated Silica
- 8.2.5. Paper Production
- 8.2.6. Water Treatment
- 8.2.7. Other Applications (Construction, Metal Casting)
- 8.1. Market Analysis, Insights and Forecast - by Type
- 9. Europe Sodium Silicate Market Analysis, Insights and Forecast, 2021-2033
- 9.1. Market Analysis, Insights and Forecast - by Type
- 9.1.1. Solid
- 9.1.2. Liquid
- 9.2. Market Analysis, Insights and Forecast - by Application
- 9.2.1. Adhesives and Paints
- 9.2.2. Detergents
- 9.2.3. Food Preservation
- 9.2.4. Precipitated Silica
- 9.2.5. Paper Production
- 9.2.6. Water Treatment
- 9.2.7. Other Applications (Construction, Metal Casting)
- 9.1. Market Analysis, Insights and Forecast - by Type
- 10. South America Sodium Silicate Market Analysis, Insights and Forecast, 2021-2033
- 10.1. Market Analysis, Insights and Forecast - by Type
- 10.1.1. Solid
- 10.1.2. Liquid
- 10.2. Market Analysis, Insights and Forecast - by Application
- 10.2.1. Adhesives and Paints
- 10.2.2. Detergents
- 10.2.3. Food Preservation
- 10.2.4. Precipitated Silica
- 10.2.5. Paper Production
- 10.2.6. Water Treatment
- 10.2.7. Other Applications (Construction, Metal Casting)
- 10.1. Market Analysis, Insights and Forecast - by Type
- 11. Middle East and Africa Sodium Silicate Market Analysis, Insights and Forecast, 2021-2033
- 11.1. Market Analysis, Insights and Forecast - by Type
- 11.1.1. Solid
- 11.1.2. Liquid
- 11.2. Market Analysis, Insights and Forecast - by Application
- 11.2.1. Adhesives and Paints
- 11.2.2. Detergents
- 11.2.3. Food Preservation
- 11.2.4. Precipitated Silica
- 11.2.5. Paper Production
- 11.2.6. Water Treatment
- 11.2.7. Other Applications (Construction, Metal Casting)
- 11.1. Market Analysis, Insights and Forecast - by Type
- 12. Competitive Analysis
- 12.1. Company Profiles
- 12.1.1 Kiran Global Chem Limited
- 12.1.1.1. Company Overview
- 12.1.1.2. Products
- 12.1.1.3. Company Financials
- 12.1.1.4. SWOT Analysis
- 12.1.2 Occidental Petroleum Corporation
- 12.1.2.1. Company Overview
- 12.1.2.2. Products
- 12.1.2.3. Company Financials
- 12.1.2.4. SWOT Analysis
- 12.1.3 FUJI SILYSIA CHEMICAL LTD
- 12.1.3.1. Company Overview
- 12.1.3.2. Products
- 12.1.3.3. Company Financials
- 12.1.3.4. SWOT Analysis
- 12.1.4 Hindcon
- 12.1.4.1. Company Overview
- 12.1.4.2. Products
- 12.1.4.3. Company Financials
- 12.1.4.4. SWOT Analysis
- 12.1.5 Evonik Industries AG
- 12.1.5.1. Company Overview
- 12.1.5.2. Products
- 12.1.5.3. Company Financials
- 12.1.5.4. SWOT Analysis
- 12.1.6 Silmaco
- 12.1.6.1. Company Overview
- 12.1.6.2. Products
- 12.1.6.3. Company Financials
- 12.1.6.4. SWOT Analysis
- 12.1.7 BASF SE
- 12.1.7.1. Company Overview
- 12.1.7.2. Products
- 12.1.7.3. Company Financials
- 12.1.7.4. SWOT Analysis
- 12.1.8 PQ Corporation
- 12.1.8.1. Company Overview
- 12.1.8.2. Products
- 12.1.8.3. Company Financials
- 12.1.8.4. SWOT Analysis
- 12.1.9 Z Ch Rudniki S A
- 12.1.9.1. Company Overview
- 12.1.9.2. Products
- 12.1.9.3. Company Financials
- 12.1.9.4. SWOT Analysis
- 12.1.10 C THAI GROUP
- 12.1.10.1. Company Overview
- 12.1.10.2. Products
- 12.1.10.3. Company Financials
- 12.1.10.4. SWOT Analysis
- 12.1.11 Alumina doo Zvornik
- 12.1.11.1. Company Overview
- 12.1.11.2. Products
- 12.1.11.3. Company Financials
- 12.1.11.4. SWOT Analysis
- 12.1.12 W R Grace & Co -Conn
- 12.1.12.1. Company Overview
- 12.1.12.2. Products
- 12.1.12.3. Company Financials
- 12.1.12.4. SWOT Analysis
- 12.1.13 CIECH Group
- 12.1.13.1. Company Overview
- 12.1.13.2. Products
- 12.1.13.3. Company Financials
- 12.1.13.4. SWOT Analysis
- 12.1.1 Kiran Global Chem Limited
- 12.2. Market Entropy
- 12.2.1 Company's Key Areas Served
- 12.2.2 Recent Developments
- 12.3. Company Market Share Analysis 2025
- 12.3.1 Top 5 Companies Market Share Analysis
- 12.3.2 Top 3 Companies Market Share Analysis
- 12.4. List of Potential Customers
- 13. Research Methodology
List of Figures
- Figure 1: Global Sodium Silicate Market Revenue Breakdown (Billion, %) by Region 2025 & 2033
- Figure 2: Global Sodium Silicate Market Volume Breakdown (K Tons, %) by Region 2025 & 2033
- Figure 3: Asia Pacific Sodium Silicate Market Revenue (Billion), by Type 2025 & 2033
- Figure 4: Asia Pacific Sodium Silicate Market Volume (K Tons), by Type 2025 & 2033
- Figure 5: Asia Pacific Sodium Silicate Market Revenue Share (%), by Type 2025 & 2033
- Figure 6: Asia Pacific Sodium Silicate Market Volume Share (%), by Type 2025 & 2033
- Figure 7: Asia Pacific Sodium Silicate Market Revenue (Billion), by Application 2025 & 2033
- Figure 8: Asia Pacific Sodium Silicate Market Volume (K Tons), by Application 2025 & 2033
- Figure 9: Asia Pacific Sodium Silicate Market Revenue Share (%), by Application 2025 & 2033
- Figure 10: Asia Pacific Sodium Silicate Market Volume Share (%), by Application 2025 & 2033
- Figure 11: Asia Pacific Sodium Silicate Market Revenue (Billion), by Country 2025 & 2033
- Figure 12: Asia Pacific Sodium Silicate Market Volume (K Tons), by Country 2025 & 2033
- Figure 13: Asia Pacific Sodium Silicate Market Revenue Share (%), by Country 2025 & 2033
- Figure 14: Asia Pacific Sodium Silicate Market Volume Share (%), by Country 2025 & 2033
- Figure 15: North America Sodium Silicate Market Revenue (Billion), by Type 2025 & 2033
- Figure 16: North America Sodium Silicate Market Volume (K Tons), by Type 2025 & 2033
- Figure 17: North America Sodium Silicate Market Revenue Share (%), by Type 2025 & 2033
- Figure 18: North America Sodium Silicate Market Volume Share (%), by Type 2025 & 2033
- Figure 19: North America Sodium Silicate Market Revenue (Billion), by Application 2025 & 2033
- Figure 20: North America Sodium Silicate Market Volume (K Tons), by Application 2025 & 2033
- Figure 21: North America Sodium Silicate Market Revenue Share (%), by Application 2025 & 2033
- Figure 22: North America Sodium Silicate Market Volume Share (%), by Application 2025 & 2033
- Figure 23: North America Sodium Silicate Market Revenue (Billion), by Country 2025 & 2033
- Figure 24: North America Sodium Silicate Market Volume (K Tons), by Country 2025 & 2033
- Figure 25: North America Sodium Silicate Market Revenue Share (%), by Country 2025 & 2033
- Figure 26: North America Sodium Silicate Market Volume Share (%), by Country 2025 & 2033
- Figure 27: Europe Sodium Silicate Market Revenue (Billion), by Type 2025 & 2033
- Figure 28: Europe Sodium Silicate Market Volume (K Tons), by Type 2025 & 2033
- Figure 29: Europe Sodium Silicate Market Revenue Share (%), by Type 2025 & 2033
- Figure 30: Europe Sodium Silicate Market Volume Share (%), by Type 2025 & 2033
- Figure 31: Europe Sodium Silicate Market Revenue (Billion), by Application 2025 & 2033
- Figure 32: Europe Sodium Silicate Market Volume (K Tons), by Application 2025 & 2033
- Figure 33: Europe Sodium Silicate Market Revenue Share (%), by Application 2025 & 2033
- Figure 34: Europe Sodium Silicate Market Volume Share (%), by Application 2025 & 2033
- Figure 35: Europe Sodium Silicate Market Revenue (Billion), by Country 2025 & 2033
- Figure 36: Europe Sodium Silicate Market Volume (K Tons), by Country 2025 & 2033
- Figure 37: Europe Sodium Silicate Market Revenue Share (%), by Country 2025 & 2033
- Figure 38: Europe Sodium Silicate Market Volume Share (%), by Country 2025 & 2033
- Figure 39: South America Sodium Silicate Market Revenue (Billion), by Type 2025 & 2033
- Figure 40: South America Sodium Silicate Market Volume (K Tons), by Type 2025 & 2033
- Figure 41: South America Sodium Silicate Market Revenue Share (%), by Type 2025 & 2033
- Figure 42: South America Sodium Silicate Market Volume Share (%), by Type 2025 & 2033
- Figure 43: South America Sodium Silicate Market Revenue (Billion), by Application 2025 & 2033
- Figure 44: South America Sodium Silicate Market Volume (K Tons), by Application 2025 & 2033
- Figure 45: South America Sodium Silicate Market Revenue Share (%), by Application 2025 & 2033
- Figure 46: South America Sodium Silicate Market Volume Share (%), by Application 2025 & 2033
- Figure 47: South America Sodium Silicate Market Revenue (Billion), by Country 2025 & 2033
- Figure 48: South America Sodium Silicate Market Volume (K Tons), by Country 2025 & 2033
- Figure 49: South America Sodium Silicate Market Revenue Share (%), by Country 2025 & 2033
- Figure 50: South America Sodium Silicate Market Volume Share (%), by Country 2025 & 2033
- Figure 51: Middle East and Africa Sodium Silicate Market Revenue (Billion), by Type 2025 & 2033
- Figure 52: Middle East and Africa Sodium Silicate Market Volume (K Tons), by Type 2025 & 2033
- Figure 53: Middle East and Africa Sodium Silicate Market Revenue Share (%), by Type 2025 & 2033
- Figure 54: Middle East and Africa Sodium Silicate Market Volume Share (%), by Type 2025 & 2033
- Figure 55: Middle East and Africa Sodium Silicate Market Revenue (Billion), by Application 2025 & 2033
- Figure 56: Middle East and Africa Sodium Silicate Market Volume (K Tons), by Application 2025 & 2033
- Figure 57: Middle East and Africa Sodium Silicate Market Revenue Share (%), by Application 2025 & 2033
- Figure 58: Middle East and Africa Sodium Silicate Market Volume Share (%), by Application 2025 & 2033
- Figure 59: Middle East and Africa Sodium Silicate Market Revenue (Billion), by Country 2025 & 2033
- Figure 60: Middle East and Africa Sodium Silicate Market Volume (K Tons), by Country 2025 & 2033
- Figure 61: Middle East and Africa Sodium Silicate Market Revenue Share (%), by Country 2025 & 2033
- Figure 62: Middle East and Africa Sodium Silicate Market Volume Share (%), by Country 2025 & 2033
List of Tables
- Table 1: Global Sodium Silicate Market Revenue Billion Forecast, by Type 2020 & 2033
- Table 2: Global Sodium Silicate Market Volume K Tons Forecast, by Type 2020 & 2033
- Table 3: Global Sodium Silicate Market Revenue Billion Forecast, by Application 2020 & 2033
- Table 4: Global Sodium Silicate Market Volume K Tons Forecast, by Application 2020 & 2033
- Table 5: Global Sodium Silicate Market Revenue Billion Forecast, by Region 2020 & 2033
- Table 6: Global Sodium Silicate Market Volume K Tons Forecast, by Region 2020 & 2033
- Table 7: Global Sodium Silicate Market Revenue Billion Forecast, by Type 2020 & 2033
- Table 8: Global Sodium Silicate Market Volume K Tons Forecast, by Type 2020 & 2033
- Table 9: Global Sodium Silicate Market Revenue Billion Forecast, by Application 2020 & 2033
- Table 10: Global Sodium Silicate Market Volume K Tons Forecast, by Application 2020 & 2033
- Table 11: Global Sodium Silicate Market Revenue Billion Forecast, by Country 2020 & 2033
- Table 12: Global Sodium Silicate Market Volume K Tons Forecast, by Country 2020 & 2033
- Table 13: China Sodium Silicate Market Revenue (Billion) Forecast, by Application 2020 & 2033
- Table 14: China Sodium Silicate Market Volume (K Tons) Forecast, by Application 2020 & 2033
- Table 15: India Sodium Silicate Market Revenue (Billion) Forecast, by Application 2020 & 2033
- Table 16: India Sodium Silicate Market Volume (K Tons) Forecast, by Application 2020 & 2033
- Table 17: Japan Sodium Silicate Market Revenue (Billion) Forecast, by Application 2020 & 2033
- Table 18: Japan Sodium Silicate Market Volume (K Tons) Forecast, by Application 2020 & 2033
- Table 19: South Korea Sodium Silicate Market Revenue (Billion) Forecast, by Application 2020 & 2033
- Table 20: South Korea Sodium Silicate Market Volume (K Tons) Forecast, by Application 2020 & 2033
- Table 21: Rest of Asia Pacific Sodium Silicate Market Revenue (Billion) Forecast, by Application 2020 & 2033
- Table 22: Rest of Asia Pacific Sodium Silicate Market Volume (K Tons) Forecast, by Application 2020 & 2033
- Table 23: Global Sodium Silicate Market Revenue Billion Forecast, by Type 2020 & 2033
- Table 24: Global Sodium Silicate Market Volume K Tons Forecast, by Type 2020 & 2033
- Table 25: Global Sodium Silicate Market Revenue Billion Forecast, by Application 2020 & 2033
- Table 26: Global Sodium Silicate Market Volume K Tons Forecast, by Application 2020 & 2033
- Table 27: Global Sodium Silicate Market Revenue Billion Forecast, by Country 2020 & 2033
- Table 28: Global Sodium Silicate Market Volume K Tons Forecast, by Country 2020 & 2033
- Table 29: United States Sodium Silicate Market Revenue (Billion) Forecast, by Application 2020 & 2033
- Table 30: United States Sodium Silicate Market Volume (K Tons) Forecast, by Application 2020 & 2033
- Table 31: Canada Sodium Silicate Market Revenue (Billion) Forecast, by Application 2020 & 2033
- Table 32: Canada Sodium Silicate Market Volume (K Tons) Forecast, by Application 2020 & 2033
- Table 33: Mexico Sodium Silicate Market Revenue (Billion) Forecast, by Application 2020 & 2033
- Table 34: Mexico Sodium Silicate Market Volume (K Tons) Forecast, by Application 2020 & 2033
- Table 35: Global Sodium Silicate Market Revenue Billion Forecast, by Type 2020 & 2033
- Table 36: Global Sodium Silicate Market Volume K Tons Forecast, by Type 2020 & 2033
- Table 37: Global Sodium Silicate Market Revenue Billion Forecast, by Application 2020 & 2033
- Table 38: Global Sodium Silicate Market Volume K Tons Forecast, by Application 2020 & 2033
- Table 39: Global Sodium Silicate Market Revenue Billion Forecast, by Country 2020 & 2033
- Table 40: Global Sodium Silicate Market Volume K Tons Forecast, by Country 2020 & 2033
- Table 41: Germany Sodium Silicate Market Revenue (Billion) Forecast, by Application 2020 & 2033
- Table 42: Germany Sodium Silicate Market Volume (K Tons) Forecast, by Application 2020 & 2033
- Table 43: United Kingdom Sodium Silicate Market Revenue (Billion) Forecast, by Application 2020 & 2033
- Table 44: United Kingdom Sodium Silicate Market Volume (K Tons) Forecast, by Application 2020 & 2033
- Table 45: Italy Sodium Silicate Market Revenue (Billion) Forecast, by Application 2020 & 2033
- Table 46: Italy Sodium Silicate Market Volume (K Tons) Forecast, by Application 2020 & 2033
- Table 47: France Sodium Silicate Market Revenue (Billion) Forecast, by Application 2020 & 2033
- Table 48: France Sodium Silicate Market Volume (K Tons) Forecast, by Application 2020 & 2033
- Table 49: Rest of Europe Sodium Silicate Market Revenue (Billion) Forecast, by Application 2020 & 2033
- Table 50: Rest of Europe Sodium Silicate Market Volume (K Tons) Forecast, by Application 2020 & 2033
- Table 51: Global Sodium Silicate Market Revenue Billion Forecast, by Type 2020 & 2033
- Table 52: Global Sodium Silicate Market Volume K Tons Forecast, by Type 2020 & 2033
- Table 53: Global Sodium Silicate Market Revenue Billion Forecast, by Application 2020 & 2033
- Table 54: Global Sodium Silicate Market Volume K Tons Forecast, by Application 2020 & 2033
- Table 55: Global Sodium Silicate Market Revenue Billion Forecast, by Country 2020 & 2033
- Table 56: Global Sodium Silicate Market Volume K Tons Forecast, by Country 2020 & 2033
- Table 57: Brazil Sodium Silicate Market Revenue (Billion) Forecast, by Application 2020 & 2033
- Table 58: Brazil Sodium Silicate Market Volume (K Tons) Forecast, by Application 2020 & 2033
- Table 59: Argentina Sodium Silicate Market Revenue (Billion) Forecast, by Application 2020 & 2033
- Table 60: Argentina Sodium Silicate Market Volume (K Tons) Forecast, by Application 2020 & 2033
- Table 61: Rest of South America Sodium Silicate Market Revenue (Billion) Forecast, by Application 2020 & 2033
- Table 62: Rest of South America Sodium Silicate Market Volume (K Tons) Forecast, by Application 2020 & 2033
- Table 63: Global Sodium Silicate Market Revenue Billion Forecast, by Type 2020 & 2033
- Table 64: Global Sodium Silicate Market Volume K Tons Forecast, by Type 2020 & 2033
- Table 65: Global Sodium Silicate Market Revenue Billion Forecast, by Application 2020 & 2033
- Table 66: Global Sodium Silicate Market Volume K Tons Forecast, by Application 2020 & 2033
- Table 67: Global Sodium Silicate Market Revenue Billion Forecast, by Country 2020 & 2033
- Table 68: Global Sodium Silicate Market Volume K Tons Forecast, by Country 2020 & 2033
- Table 69: Saudi Arabia Sodium Silicate Market Revenue (Billion) Forecast, by Application 2020 & 2033
- Table 70: Saudi Arabia Sodium Silicate Market Volume (K Tons) Forecast, by Application 2020 & 2033
- Table 71: South Africa Sodium Silicate Market Revenue (Billion) Forecast, by Application 2020 & 2033
- Table 72: South Africa Sodium Silicate Market Volume (K Tons) Forecast, by Application 2020 & 2033
- Table 73: Rest of Middle East and Africa Sodium Silicate Market Revenue (Billion) Forecast, by Application 2020 & 2033
- Table 74: Rest of Middle East and Africa Sodium Silicate Market Volume (K Tons) Forecast, by Application 2020 & 2033
Frequently Asked Questions
1. What is the projected Compound Annual Growth Rate (CAGR) of the Sodium Silicate Market?
The projected CAGR is approximately 3.6%.
2. Which companies are prominent players in the Sodium Silicate Market?
Key companies in the market include Kiran Global Chem Limited, Occidental Petroleum Corporation, FUJI SILYSIA CHEMICAL LTD, Hindcon, Evonik Industries AG, Silmaco, BASF SE, PQ Corporation, Z Ch Rudniki S A, C THAI GROUP, Alumina doo Zvornik, W R Grace & Co -Conn, CIECH Group.
3. What are the main segments of the Sodium Silicate Market?
The market segments include Type, Application.
4. Can you provide details about the market size?
The market size is estimated to be USD 6.62 Billion as of 2022.
5. What are some drivers contributing to market growth?
Increasing Demand for Waste Paper Recycling; Rising Demand for Precipitated Silica from the Rubber and Tyre Industry; Other Drivers.
6. What are the notable trends driving market growth?
Detergents Segment to Witness Healthy Demand.
7. Are there any restraints impacting market growth?
Hazardous Effects of Sodium Silicate; Other Restraints.
8. Can you provide examples of recent developments in the market?
September 2022: Evonik, one of the world's leading silica producers, has entered a strategic cooperation with the Porner Group, Austria and Phichit Bio Power Co., Ltd., Thailand, to supply sustainable ULTRASIL precipitated silica to tire manufacturers.
9. What pricing options are available for accessing the report?
Pricing options include single-user, multi-user, and enterprise licenses priced at USD 4750, USD 5250, and USD 8750 respectively.
10. Is the market size provided in terms of value or volume?
The market size is provided in terms of value, measured in Billion and volume, measured in K Tons.
11. Are there any specific market keywords associated with the report?
Yes, the market keyword associated with the report is "Sodium Silicate Market," which aids in identifying and referencing the specific market segment covered.
12. How do I determine which pricing option suits my needs best?
The pricing options vary based on user requirements and access needs. Individual users may opt for single-user licenses, while businesses requiring broader access may choose multi-user or enterprise licenses for cost-effective access to the report.
13. Are there any additional resources or data provided in the Sodium Silicate Market report?
While the report offers comprehensive insights, it's advisable to review the specific contents or supplementary materials provided to ascertain if additional resources or data are available.
14. How can I stay updated on further developments or reports in the Sodium Silicate Market?
To stay informed about further developments, trends, and reports in the Sodium Silicate Market, consider subscribing to industry newsletters, following relevant companies and organizations, or regularly checking reputable industry news sources and publications.
Methodology
Step 1 - Identification of Relevant Samples Size from Population Database


Step 2 - Approaches for Defining Global Market Size (Value, Volume* & Price*)

Note*: In applicable scenarios
Step 3 - Data Sources
Primary Research
- Web Analytics
- Survey Reports
- Research Institute
- Latest Research Reports
- Opinion Leaders
Secondary Research
- Annual Reports
- White Paper
- Latest Press Release
- Industry Association
- Paid Database
- Investor Presentations

Step 4 - Data Triangulation
Involves using different sources of information in order to increase the validity of a study
These sources are likely to be stakeholders in a program - participants, other researchers, program staff, other community members, and so on.
Then we put all data in single framework & apply various statistical tools to find out the dynamic on the market.
During the analysis stage, feedback from the stakeholder groups would be compared to determine areas of agreement as well as areas of divergence