
Key Insights
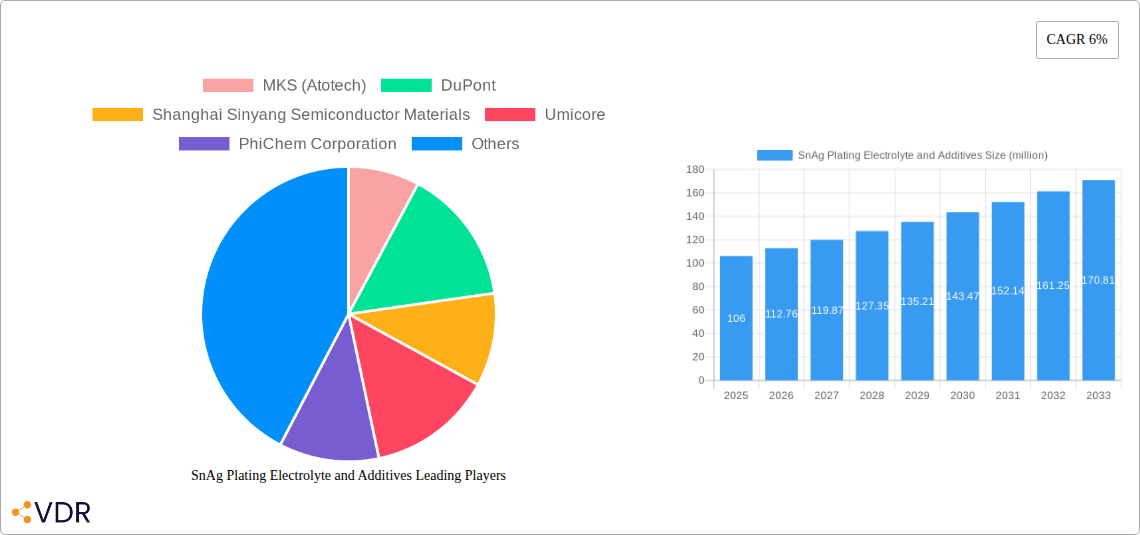
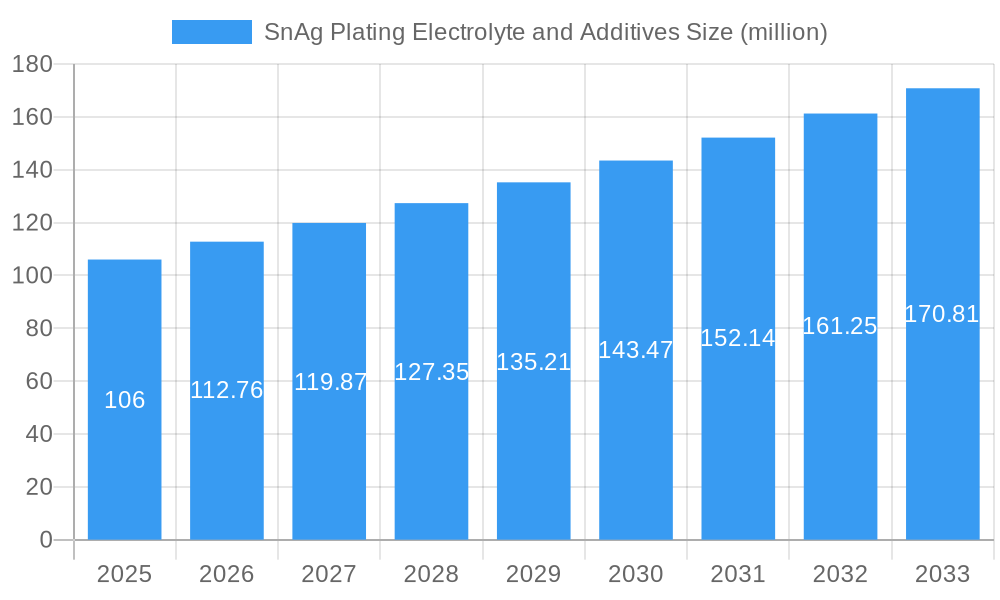
The SnAg plating electrolyte and additives market, currently valued at $106 million in 2025, is projected to experience robust growth, driven by the increasing demand for high-reliability electronics and the miniaturization of components in diverse sectors like consumer electronics, automotive, and renewable energy. The market's Compound Annual Growth Rate (CAGR) of 6% from 2025 to 2033 indicates a steady expansion, fueled by the superior properties of SnAg plating—its excellent solderability, low cost compared to lead-based alternatives, and suitability for various applications requiring high conductivity and durability. Key trends include the development of eco-friendly electrolytes to meet stringent environmental regulations and the growing adoption of advanced plating techniques for improved process efficiency and product quality. Competitive pressures from established players like MKS (Atotech), DuPont, Umicore, and emerging regional manufacturers are shaping the market landscape, pushing innovation and cost optimization.
SnAg Plating Electrolyte and Additives Market Size (In Million)

However, the market growth trajectory might be slightly moderated by factors like the cyclical nature of the electronics industry and the potential for price volatility in raw materials. The consistent demand for reliable and efficient electronics manufacturing, particularly in the burgeoning sectors of electric vehicles and 5G infrastructure, is likely to offset these restraining factors. The market segmentation, while currently unspecified, is expected to encompass various electrolyte types (acidic, alkaline), additive functionalities (brighteners, levelers, wetting agents), and applications (PCB, semiconductor packaging). Companies are focusing on product differentiation, including customized solutions tailored to specific applications, to gain a competitive edge. Regional variations in market growth will likely reflect the distribution of electronics manufacturing hubs globally, with regions like Asia-Pacific expected to dominate due to their significant concentration of electronics production.
SnAg Plating Electrolyte and Additives Company Market Share
SnAg Plating Electrolyte and Additives Market Report: 2019-2033
This comprehensive report provides a detailed analysis of the global SnAg plating electrolyte and additives market, encompassing market dynamics, growth trends, regional analysis, competitive landscape, and future outlook. The report covers the period from 2019 to 2033, with 2025 serving as the base and estimated year. This in-depth study is invaluable for industry professionals, investors, and researchers seeking to understand and capitalize on opportunities within this rapidly evolving market. The parent market is the electronics industry, with the child market being the semiconductor and electronics packaging sectors.
SnAg Plating Electrolyte and Additives Market Dynamics & Structure
This section analyzes the market's competitive intensity, technological advancements, regulatory landscape, and market trends influencing the SnAg plating electrolyte and additives market. The analysis considers factors impacting market structure, including mergers and acquisitions (M&A) activity.
Market Concentration: The market exhibits a moderately concentrated structure with key players holding significant market share. MKS (Atotech), DuPont, and Umicore are among the leading companies, collectively accounting for approximately xx% of the global market share in 2025. Smaller players focus on niche applications and regional markets.
Technological Innovation: Continuous innovation in SnAg plating electrolyte formulations drives performance improvements and cost reductions. Research focuses on enhancing solderability, reducing porosity, and improving the overall reliability of electronic components.
Regulatory Framework: Environmental regulations related to hazardous waste disposal significantly impact the industry. Compliance necessitates the development of eco-friendly electrolytes and effective waste management practices.
Competitive Product Substitutes: Other lead-free solders, like SnBi and SnCu, present competitive alternatives. However, SnAg plating maintains its advantage due to its superior performance characteristics.
End-User Demographics: The primary end-users are electronics manufacturers, particularly in the semiconductor, automotive, and consumer electronics sectors. Growth in these industries directly correlates with market expansion.
M&A Trends: The past five years have witnessed xx M&A deals in the industry, primarily driven by strategies to enhance market share and expand product portfolios.
- Market Size (2025): $xx Million
- CAGR (2025-2033): xx%
- Major Players' Market Share (2025): MKS (Atotech) - xx%, DuPont - xx%, Umicore - xx%, Others - xx%
SnAg Plating Electrolyte and Additives Growth Trends & Insights
The SnAg plating electrolyte and additives market has experienced substantial growth between 2019 and 2024, driven by the increasing demand for miniaturized and high-performance electronic devices. The miniaturization trend necessitates the use of reliable and high-quality solder materials, boosting the demand for SnAg plating electrolytes and additives.
Technological advancements in electronics packaging, such as the growing adoption of advanced packaging technologies and high-density interconnect solutions, have fueled significant growth in the market. The increasing demand for smaller, faster, and more power-efficient electronics, combined with the stringent requirements for reliability and performance, has led to a rising adoption rate of SnAg plating electrolytes and additives.
Consumer behavior shifts towards more sophisticated electronic gadgets, such as smartphones, laptops, and wearable devices, have also contributed to the market's growth. The market is expected to continue this growth trajectory through 2033, driven by ongoing technological advancements in the electronics industry.
- Market Size (2019): $xx Million
- Market Size (2024): $xx Million
- Market Size (2033): $xx Million
- CAGR (2019-2024): xx%
- Market Penetration (2025): xx%
Dominant Regions, Countries, or Segments in SnAg Plating Electrolyte and Additives
The Asia-Pacific region, particularly China, holds the dominant position in the global SnAg plating electrolyte and additives market, driven by the region’s substantial electronics manufacturing sector and rapid technological advancements.
Key Drivers in Asia-Pacific:
- Strong presence of major electronics manufacturers
- Government support for technological innovation
- Rapid growth of consumer electronics demand
- Increasing investments in semiconductor manufacturing facilities.
Dominance Factors:
- High concentration of electronics manufacturing facilities
- Favorable government policies promoting electronics manufacturing
- Relatively lower labor costs compared to other regions
- Robust domestic demand and export-oriented manufacturing.
North America and Europe also hold significant market shares, driven by the presence of established electronics manufacturers and a focus on advanced technologies. However, the Asia-Pacific region's rapid expansion is expected to maintain its leadership throughout the forecast period.
SnAg Plating Electrolyte and Additives Product Landscape
The SnAg plating electrolyte and additives market offers a diverse range of products tailored to various applications and performance requirements. Innovations focus on enhancing solderability, reducing porosity, and improving the overall quality of the plating. These products are categorized based on their chemical composition, such as brighteners, wetting agents, and levelers, each designed to optimize specific properties of the SnAg plating. Advancements include the development of eco-friendly formulations to comply with increasingly stringent environmental regulations.
Key Drivers, Barriers & Challenges in SnAg Plating Electrolyte and Additives
Key Drivers:
The primary driver is the increasing demand for lead-free solders in electronics manufacturing due to stringent environmental regulations. The rising adoption of miniaturization and advanced packaging techniques in electronics further fuels the demand for high-quality SnAg plating. The growth of the semiconductor and consumer electronics industries globally also significantly contributes to market expansion.
Key Challenges & Restraints:
The market faces challenges from fluctuating raw material prices and supply chain disruptions, impacting profitability and product availability. Stringent environmental regulations necessitate continuous investment in R&D for eco-friendly electrolytes, adding to the production costs. The emergence of alternative lead-free soldering technologies presents competitive pressure. The overall cost of adoption for SnAg plating can also be a barrier to entry for some manufacturers. Furthermore, inconsistencies in regulatory frameworks across different regions present hurdles to seamless market operations.
Emerging Opportunities in SnAg Plating Electrolyte and Additives
Untapped markets in developing economies, particularly in Africa and Latin America, present significant growth opportunities. The increasing adoption of advanced electronics in emerging industries like automotive, renewable energy, and healthcare opens new application areas. Innovative applications, such as in 5G infrastructure and high-frequency electronics, also promise significant market expansion. The development of highly specialized electrolytes tailored to specific performance requirements offers further opportunities for market differentiation.
Growth Accelerators in the SnAg Plating Electrolyte and Additives Industry
Strategic partnerships between electrolyte manufacturers and electronics companies enhance product development and market penetration. Technological breakthroughs in electrolyte formulation, focusing on improved performance and eco-friendliness, accelerate market growth. Expansion into new geographical markets and diversification into related industries like photovoltaic and battery technologies broaden the market base.
Key Players Shaping the SnAg Plating Electrolyte and Additives Market
- MKS (Atotech)
- DuPont
- Shanghai Sinyang Semiconductor Materials
- Umicore
- PhiChem Corporation
- RESOUND TECH INC.
Notable Milestones in SnAg Plating Electrolyte and Additives Sector
- 2020: MKS (Atotech) launched a new generation of environmentally friendly SnAg plating electrolyte.
- 2021: DuPont introduced a high-performance additive enhancing the solderability of SnAg plating.
- 2022: Umicore acquired a smaller competitor, expanding its market presence.
- 2023: Significant investments were made in R&D focused on reducing the environmental impact of SnAg plating. (Specific company details unavailable.)
- 2024: Several industry players collaborated on developing new standards for SnAg plating quality and testing. (Specific company details unavailable.)
In-Depth SnAg Plating Electrolyte and Additives Market Outlook
The SnAg plating electrolyte and additives market is poised for continued growth driven by technological advancements in electronics, increasing demand for miniaturized devices, and the need for environmentally friendly soldering solutions. Strategic partnerships, innovations in electrolyte formulations, and expansion into new application areas will shape future market dynamics. Companies focusing on sustainable practices and delivering high-performance products are well-positioned to capitalize on the considerable opportunities presented by this market.
SnAg Plating Electrolyte and Additives Segmentation
-
1. Application
- 1.1. Through-Hole Plating
- 1.2. Gold Bump
- 1.3. Other
-
2. Types
- 2.1. SnAg Plating Electrolyte
- 2.2. Additives
SnAg Plating Electrolyte and Additives Segmentation By Geography
-
1. North America
- 1.1. United States
- 1.2. Canada
- 1.3. Mexico
-
2. South America
- 2.1. Brazil
- 2.2. Argentina
- 2.3. Rest of South America
-
3. Europe
- 3.1. United Kingdom
- 3.2. Germany
- 3.3. France
- 3.4. Italy
- 3.5. Spain
- 3.6. Russia
- 3.7. Benelux
- 3.8. Nordics
- 3.9. Rest of Europe
-
4. Middle East & Africa
- 4.1. Turkey
- 4.2. Israel
- 4.3. GCC
- 4.4. North Africa
- 4.5. South Africa
- 4.6. Rest of Middle East & Africa
-
5. Asia Pacific
- 5.1. China
- 5.2. India
- 5.3. Japan
- 5.4. South Korea
- 5.5. ASEAN
- 5.6. Oceania
- 5.7. Rest of Asia Pacific
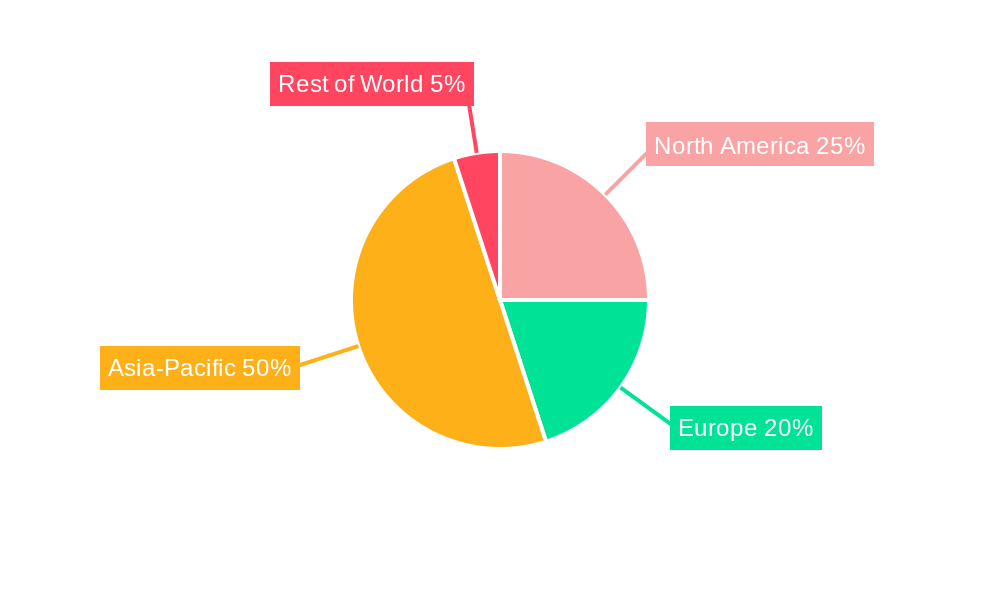
SnAg Plating Electrolyte and Additives Regional Market Share
Geographic Coverage of SnAg Plating Electrolyte and Additives
SnAg Plating Electrolyte and Additives REPORT HIGHLIGHTS
| Aspects | Details |
|---|---|
| Study Period | 2020-2034 |
| Base Year | 2025 |
| Estimated Year | 2026 |
| Forecast Period | 2026-2034 |
| Historical Period | 2020-2025 |
| Growth Rate | CAGR of 6% from 2020-2034 |
| Segmentation |
|
Table of Contents
- 1. Introduction
- 1.1. Research Scope
- 1.2. Market Segmentation
- 1.3. Research Methodology
- 1.4. Definitions and Assumptions
- 2. Executive Summary
- 2.1. Introduction
- 3. Market Dynamics
- 3.1. Introduction
- 3.2. Market Drivers
- 3.3. Market Restrains
- 3.4. Market Trends
- 4. Market Factor Analysis
- 4.1. Porters Five Forces
- 4.2. Supply/Value Chain
- 4.3. PESTEL analysis
- 4.4. Market Entropy
- 4.5. Patent/Trademark Analysis
- 5. Global SnAg Plating Electrolyte and Additives Analysis, Insights and Forecast, 2020-2032
- 5.1. Market Analysis, Insights and Forecast - by Application
- 5.1.1. Through-Hole Plating
- 5.1.2. Gold Bump
- 5.1.3. Other
- 5.2. Market Analysis, Insights and Forecast - by Types
- 5.2.1. SnAg Plating Electrolyte
- 5.2.2. Additives
- 5.3. Market Analysis, Insights and Forecast - by Region
- 5.3.1. North America
- 5.3.2. South America
- 5.3.3. Europe
- 5.3.4. Middle East & Africa
- 5.3.5. Asia Pacific
- 5.1. Market Analysis, Insights and Forecast - by Application
- 6. North America SnAg Plating Electrolyte and Additives Analysis, Insights and Forecast, 2020-2032
- 6.1. Market Analysis, Insights and Forecast - by Application
- 6.1.1. Through-Hole Plating
- 6.1.2. Gold Bump
- 6.1.3. Other
- 6.2. Market Analysis, Insights and Forecast - by Types
- 6.2.1. SnAg Plating Electrolyte
- 6.2.2. Additives
- 6.1. Market Analysis, Insights and Forecast - by Application
- 7. South America SnAg Plating Electrolyte and Additives Analysis, Insights and Forecast, 2020-2032
- 7.1. Market Analysis, Insights and Forecast - by Application
- 7.1.1. Through-Hole Plating
- 7.1.2. Gold Bump
- 7.1.3. Other
- 7.2. Market Analysis, Insights and Forecast - by Types
- 7.2.1. SnAg Plating Electrolyte
- 7.2.2. Additives
- 7.1. Market Analysis, Insights and Forecast - by Application
- 8. Europe SnAg Plating Electrolyte and Additives Analysis, Insights and Forecast, 2020-2032
- 8.1. Market Analysis, Insights and Forecast - by Application
- 8.1.1. Through-Hole Plating
- 8.1.2. Gold Bump
- 8.1.3. Other
- 8.2. Market Analysis, Insights and Forecast - by Types
- 8.2.1. SnAg Plating Electrolyte
- 8.2.2. Additives
- 8.1. Market Analysis, Insights and Forecast - by Application
- 9. Middle East & Africa SnAg Plating Electrolyte and Additives Analysis, Insights and Forecast, 2020-2032
- 9.1. Market Analysis, Insights and Forecast - by Application
- 9.1.1. Through-Hole Plating
- 9.1.2. Gold Bump
- 9.1.3. Other
- 9.2. Market Analysis, Insights and Forecast - by Types
- 9.2.1. SnAg Plating Electrolyte
- 9.2.2. Additives
- 9.1. Market Analysis, Insights and Forecast - by Application
- 10. Asia Pacific SnAg Plating Electrolyte and Additives Analysis, Insights and Forecast, 2020-2032
- 10.1. Market Analysis, Insights and Forecast - by Application
- 10.1.1. Through-Hole Plating
- 10.1.2. Gold Bump
- 10.1.3. Other
- 10.2. Market Analysis, Insights and Forecast - by Types
- 10.2.1. SnAg Plating Electrolyte
- 10.2.2. Additives
- 10.1. Market Analysis, Insights and Forecast - by Application
- 11. Competitive Analysis
- 11.1. Global Market Share Analysis 2025
- 11.2. Company Profiles
- 11.2.1 MKS (Atotech)
- 11.2.1.1. Overview
- 11.2.1.2. Products
- 11.2.1.3. SWOT Analysis
- 11.2.1.4. Recent Developments
- 11.2.1.5. Financials (Based on Availability)
- 11.2.2 DuPont
- 11.2.2.1. Overview
- 11.2.2.2. Products
- 11.2.2.3. SWOT Analysis
- 11.2.2.4. Recent Developments
- 11.2.2.5. Financials (Based on Availability)
- 11.2.3 Shanghai Sinyang Semiconductor Materials
- 11.2.3.1. Overview
- 11.2.3.2. Products
- 11.2.3.3. SWOT Analysis
- 11.2.3.4. Recent Developments
- 11.2.3.5. Financials (Based on Availability)
- 11.2.4 Umicore
- 11.2.4.1. Overview
- 11.2.4.2. Products
- 11.2.4.3. SWOT Analysis
- 11.2.4.4. Recent Developments
- 11.2.4.5. Financials (Based on Availability)
- 11.2.5 PhiChem Corporation
- 11.2.5.1. Overview
- 11.2.5.2. Products
- 11.2.5.3. SWOT Analysis
- 11.2.5.4. Recent Developments
- 11.2.5.5. Financials (Based on Availability)
- 11.2.6 RESOUND TECH INC.
- 11.2.6.1. Overview
- 11.2.6.2. Products
- 11.2.6.3. SWOT Analysis
- 11.2.6.4. Recent Developments
- 11.2.6.5. Financials (Based on Availability)
- 11.2.1 MKS (Atotech)
List of Figures
- Figure 1: Global SnAg Plating Electrolyte and Additives Revenue Breakdown (million, %) by Region 2025 & 2033
- Figure 2: North America SnAg Plating Electrolyte and Additives Revenue (million), by Application 2025 & 2033
- Figure 3: North America SnAg Plating Electrolyte and Additives Revenue Share (%), by Application 2025 & 2033
- Figure 4: North America SnAg Plating Electrolyte and Additives Revenue (million), by Types 2025 & 2033
- Figure 5: North America SnAg Plating Electrolyte and Additives Revenue Share (%), by Types 2025 & 2033
- Figure 6: North America SnAg Plating Electrolyte and Additives Revenue (million), by Country 2025 & 2033
- Figure 7: North America SnAg Plating Electrolyte and Additives Revenue Share (%), by Country 2025 & 2033
- Figure 8: South America SnAg Plating Electrolyte and Additives Revenue (million), by Application 2025 & 2033
- Figure 9: South America SnAg Plating Electrolyte and Additives Revenue Share (%), by Application 2025 & 2033
- Figure 10: South America SnAg Plating Electrolyte and Additives Revenue (million), by Types 2025 & 2033
- Figure 11: South America SnAg Plating Electrolyte and Additives Revenue Share (%), by Types 2025 & 2033
- Figure 12: South America SnAg Plating Electrolyte and Additives Revenue (million), by Country 2025 & 2033
- Figure 13: South America SnAg Plating Electrolyte and Additives Revenue Share (%), by Country 2025 & 2033
- Figure 14: Europe SnAg Plating Electrolyte and Additives Revenue (million), by Application 2025 & 2033
- Figure 15: Europe SnAg Plating Electrolyte and Additives Revenue Share (%), by Application 2025 & 2033
- Figure 16: Europe SnAg Plating Electrolyte and Additives Revenue (million), by Types 2025 & 2033
- Figure 17: Europe SnAg Plating Electrolyte and Additives Revenue Share (%), by Types 2025 & 2033
- Figure 18: Europe SnAg Plating Electrolyte and Additives Revenue (million), by Country 2025 & 2033
- Figure 19: Europe SnAg Plating Electrolyte and Additives Revenue Share (%), by Country 2025 & 2033
- Figure 20: Middle East & Africa SnAg Plating Electrolyte and Additives Revenue (million), by Application 2025 & 2033
- Figure 21: Middle East & Africa SnAg Plating Electrolyte and Additives Revenue Share (%), by Application 2025 & 2033
- Figure 22: Middle East & Africa SnAg Plating Electrolyte and Additives Revenue (million), by Types 2025 & 2033
- Figure 23: Middle East & Africa SnAg Plating Electrolyte and Additives Revenue Share (%), by Types 2025 & 2033
- Figure 24: Middle East & Africa SnAg Plating Electrolyte and Additives Revenue (million), by Country 2025 & 2033
- Figure 25: Middle East & Africa SnAg Plating Electrolyte and Additives Revenue Share (%), by Country 2025 & 2033
- Figure 26: Asia Pacific SnAg Plating Electrolyte and Additives Revenue (million), by Application 2025 & 2033
- Figure 27: Asia Pacific SnAg Plating Electrolyte and Additives Revenue Share (%), by Application 2025 & 2033
- Figure 28: Asia Pacific SnAg Plating Electrolyte and Additives Revenue (million), by Types 2025 & 2033
- Figure 29: Asia Pacific SnAg Plating Electrolyte and Additives Revenue Share (%), by Types 2025 & 2033
- Figure 30: Asia Pacific SnAg Plating Electrolyte and Additives Revenue (million), by Country 2025 & 2033
- Figure 31: Asia Pacific SnAg Plating Electrolyte and Additives Revenue Share (%), by Country 2025 & 2033
List of Tables
- Table 1: Global SnAg Plating Electrolyte and Additives Revenue million Forecast, by Application 2020 & 2033
- Table 2: Global SnAg Plating Electrolyte and Additives Revenue million Forecast, by Types 2020 & 2033
- Table 3: Global SnAg Plating Electrolyte and Additives Revenue million Forecast, by Region 2020 & 2033
- Table 4: Global SnAg Plating Electrolyte and Additives Revenue million Forecast, by Application 2020 & 2033
- Table 5: Global SnAg Plating Electrolyte and Additives Revenue million Forecast, by Types 2020 & 2033
- Table 6: Global SnAg Plating Electrolyte and Additives Revenue million Forecast, by Country 2020 & 2033
- Table 7: United States SnAg Plating Electrolyte and Additives Revenue (million) Forecast, by Application 2020 & 2033
- Table 8: Canada SnAg Plating Electrolyte and Additives Revenue (million) Forecast, by Application 2020 & 2033
- Table 9: Mexico SnAg Plating Electrolyte and Additives Revenue (million) Forecast, by Application 2020 & 2033
- Table 10: Global SnAg Plating Electrolyte and Additives Revenue million Forecast, by Application 2020 & 2033
- Table 11: Global SnAg Plating Electrolyte and Additives Revenue million Forecast, by Types 2020 & 2033
- Table 12: Global SnAg Plating Electrolyte and Additives Revenue million Forecast, by Country 2020 & 2033
- Table 13: Brazil SnAg Plating Electrolyte and Additives Revenue (million) Forecast, by Application 2020 & 2033
- Table 14: Argentina SnAg Plating Electrolyte and Additives Revenue (million) Forecast, by Application 2020 & 2033
- Table 15: Rest of South America SnAg Plating Electrolyte and Additives Revenue (million) Forecast, by Application 2020 & 2033
- Table 16: Global SnAg Plating Electrolyte and Additives Revenue million Forecast, by Application 2020 & 2033
- Table 17: Global SnAg Plating Electrolyte and Additives Revenue million Forecast, by Types 2020 & 2033
- Table 18: Global SnAg Plating Electrolyte and Additives Revenue million Forecast, by Country 2020 & 2033
- Table 19: United Kingdom SnAg Plating Electrolyte and Additives Revenue (million) Forecast, by Application 2020 & 2033
- Table 20: Germany SnAg Plating Electrolyte and Additives Revenue (million) Forecast, by Application 2020 & 2033
- Table 21: France SnAg Plating Electrolyte and Additives Revenue (million) Forecast, by Application 2020 & 2033
- Table 22: Italy SnAg Plating Electrolyte and Additives Revenue (million) Forecast, by Application 2020 & 2033
- Table 23: Spain SnAg Plating Electrolyte and Additives Revenue (million) Forecast, by Application 2020 & 2033
- Table 24: Russia SnAg Plating Electrolyte and Additives Revenue (million) Forecast, by Application 2020 & 2033
- Table 25: Benelux SnAg Plating Electrolyte and Additives Revenue (million) Forecast, by Application 2020 & 2033
- Table 26: Nordics SnAg Plating Electrolyte and Additives Revenue (million) Forecast, by Application 2020 & 2033
- Table 27: Rest of Europe SnAg Plating Electrolyte and Additives Revenue (million) Forecast, by Application 2020 & 2033
- Table 28: Global SnAg Plating Electrolyte and Additives Revenue million Forecast, by Application 2020 & 2033
- Table 29: Global SnAg Plating Electrolyte and Additives Revenue million Forecast, by Types 2020 & 2033
- Table 30: Global SnAg Plating Electrolyte and Additives Revenue million Forecast, by Country 2020 & 2033
- Table 31: Turkey SnAg Plating Electrolyte and Additives Revenue (million) Forecast, by Application 2020 & 2033
- Table 32: Israel SnAg Plating Electrolyte and Additives Revenue (million) Forecast, by Application 2020 & 2033
- Table 33: GCC SnAg Plating Electrolyte and Additives Revenue (million) Forecast, by Application 2020 & 2033
- Table 34: North Africa SnAg Plating Electrolyte and Additives Revenue (million) Forecast, by Application 2020 & 2033
- Table 35: South Africa SnAg Plating Electrolyte and Additives Revenue (million) Forecast, by Application 2020 & 2033
- Table 36: Rest of Middle East & Africa SnAg Plating Electrolyte and Additives Revenue (million) Forecast, by Application 2020 & 2033
- Table 37: Global SnAg Plating Electrolyte and Additives Revenue million Forecast, by Application 2020 & 2033
- Table 38: Global SnAg Plating Electrolyte and Additives Revenue million Forecast, by Types 2020 & 2033
- Table 39: Global SnAg Plating Electrolyte and Additives Revenue million Forecast, by Country 2020 & 2033
- Table 40: China SnAg Plating Electrolyte and Additives Revenue (million) Forecast, by Application 2020 & 2033
- Table 41: India SnAg Plating Electrolyte and Additives Revenue (million) Forecast, by Application 2020 & 2033
- Table 42: Japan SnAg Plating Electrolyte and Additives Revenue (million) Forecast, by Application 2020 & 2033
- Table 43: South Korea SnAg Plating Electrolyte and Additives Revenue (million) Forecast, by Application 2020 & 2033
- Table 44: ASEAN SnAg Plating Electrolyte and Additives Revenue (million) Forecast, by Application 2020 & 2033
- Table 45: Oceania SnAg Plating Electrolyte and Additives Revenue (million) Forecast, by Application 2020 & 2033
- Table 46: Rest of Asia Pacific SnAg Plating Electrolyte and Additives Revenue (million) Forecast, by Application 2020 & 2033
Frequently Asked Questions
1. What is the projected Compound Annual Growth Rate (CAGR) of the SnAg Plating Electrolyte and Additives?
The projected CAGR is approximately 6%.
2. Which companies are prominent players in the SnAg Plating Electrolyte and Additives?
Key companies in the market include MKS (Atotech), DuPont, Shanghai Sinyang Semiconductor Materials, Umicore, PhiChem Corporation, RESOUND TECH INC..
3. What are the main segments of the SnAg Plating Electrolyte and Additives?
The market segments include Application, Types.
4. Can you provide details about the market size?
The market size is estimated to be USD 106 million as of 2022.
5. What are some drivers contributing to market growth?
N/A
6. What are the notable trends driving market growth?
N/A
7. Are there any restraints impacting market growth?
N/A
8. Can you provide examples of recent developments in the market?
N/A
9. What pricing options are available for accessing the report?
Pricing options include single-user, multi-user, and enterprise licenses priced at USD 2900.00, USD 4350.00, and USD 5800.00 respectively.
10. Is the market size provided in terms of value or volume?
The market size is provided in terms of value, measured in million.
11. Are there any specific market keywords associated with the report?
Yes, the market keyword associated with the report is "SnAg Plating Electrolyte and Additives," which aids in identifying and referencing the specific market segment covered.
12. How do I determine which pricing option suits my needs best?
The pricing options vary based on user requirements and access needs. Individual users may opt for single-user licenses, while businesses requiring broader access may choose multi-user or enterprise licenses for cost-effective access to the report.
13. Are there any additional resources or data provided in the SnAg Plating Electrolyte and Additives report?
While the report offers comprehensive insights, it's advisable to review the specific contents or supplementary materials provided to ascertain if additional resources or data are available.
14. How can I stay updated on further developments or reports in the SnAg Plating Electrolyte and Additives?
To stay informed about further developments, trends, and reports in the SnAg Plating Electrolyte and Additives, consider subscribing to industry newsletters, following relevant companies and organizations, or regularly checking reputable industry news sources and publications.
Methodology
Step 1 - Identification of Relevant Samples Size from Population Database


Step 2 - Approaches for Defining Global Market Size (Value, Volume* & Price*)

Note*: In applicable scenarios
Step 3 - Data Sources
Primary Research
- Web Analytics
- Survey Reports
- Research Institute
- Latest Research Reports
- Opinion Leaders
Secondary Research
- Annual Reports
- White Paper
- Latest Press Release
- Industry Association
- Paid Database
- Investor Presentations

Step 4 - Data Triangulation
Involves using different sources of information in order to increase the validity of a study
These sources are likely to be stakeholders in a program - participants, other researchers, program staff, other community members, and so on.
Then we put all data in single framework & apply various statistical tools to find out the dynamic on the market.
During the analysis stage, feedback from the stakeholder groups would be compared to determine areas of agreement as well as areas of divergence

