

Key Insights
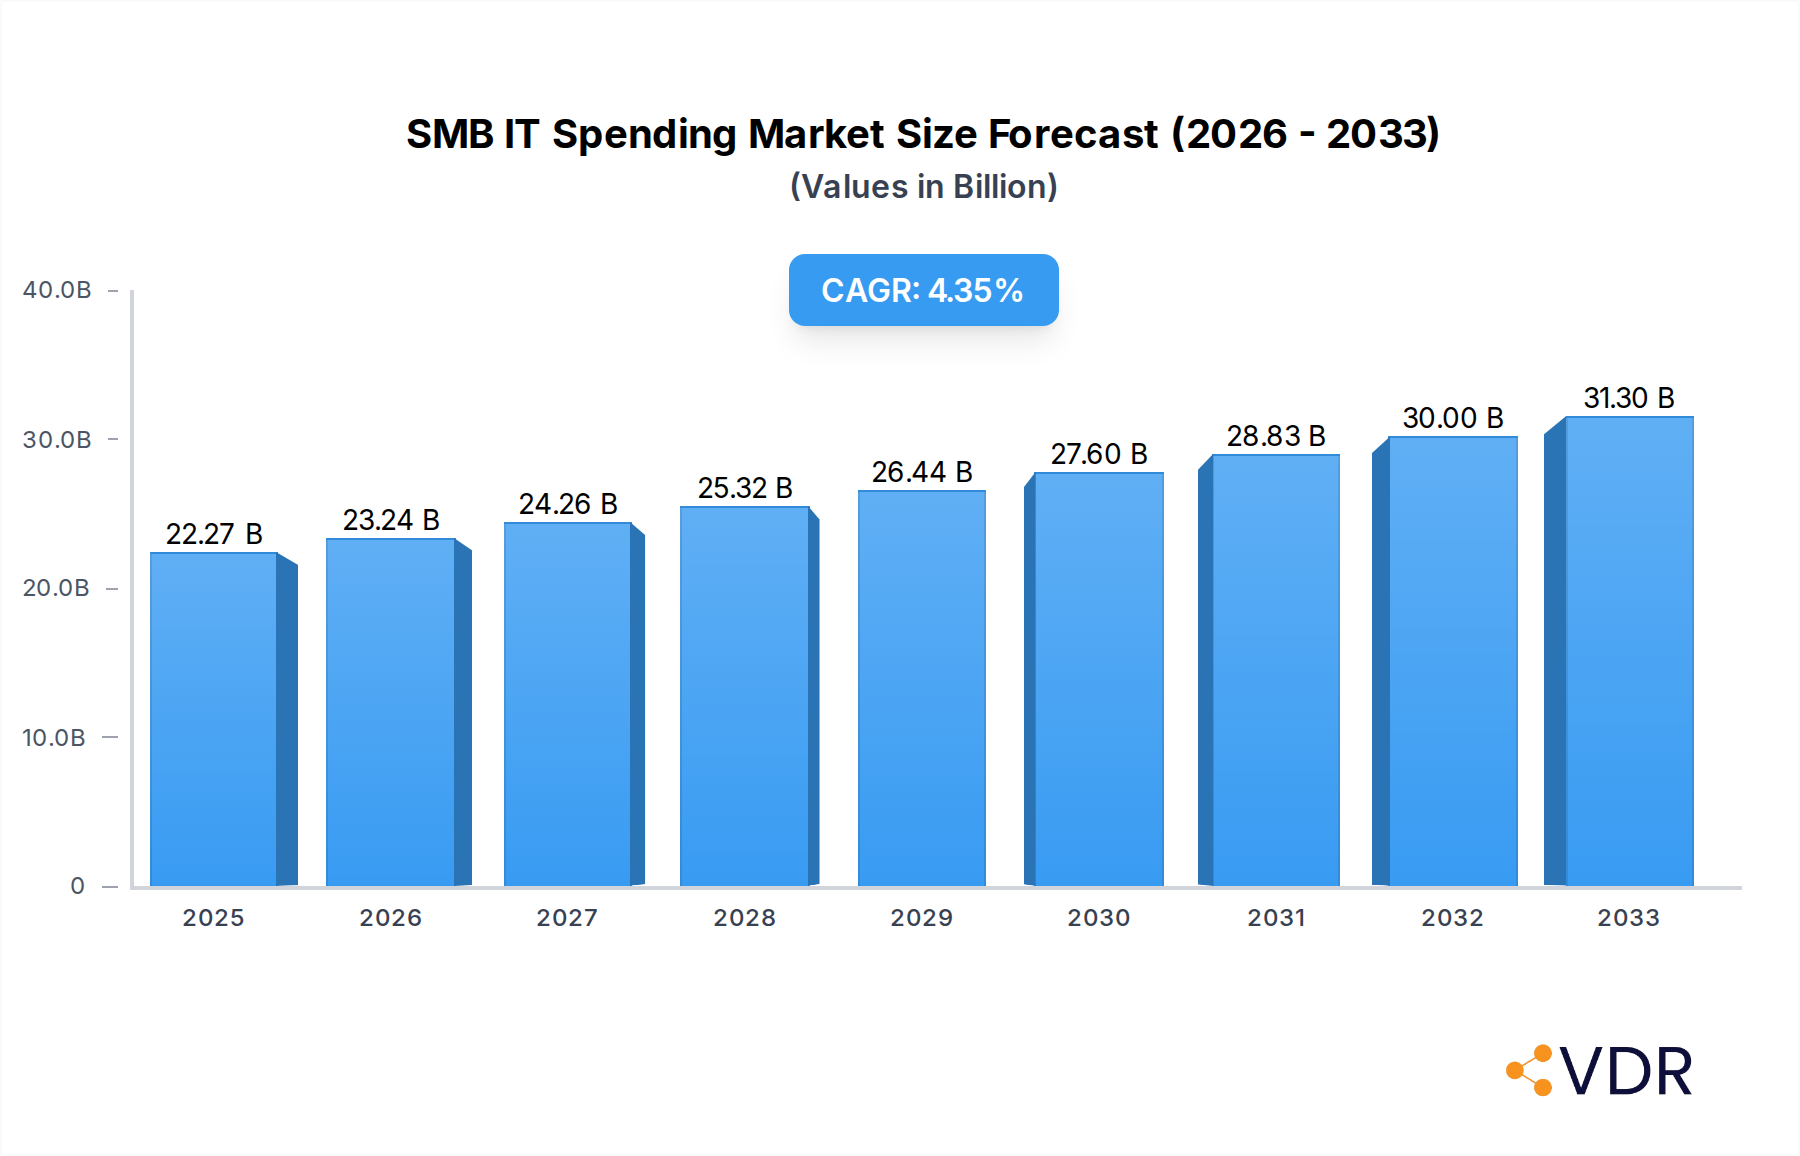
The SMB (Small and Medium-sized Business) IT spending market, valued at $667.69 million in 2025, is projected to experience robust growth, driven by several key factors. The increasing adoption of cloud-based solutions, a crucial trend, offers SMBs scalability, cost-effectiveness, and enhanced accessibility to advanced technologies. Furthermore, the rising need for cybersecurity measures, in response to escalating cyber threats, is significantly boosting IT investments. Improved digital infrastructure and government initiatives promoting digital transformation within SMBs are also contributing to market expansion. While factors such as economic fluctuations and the complexity of implementing new technologies can pose challenges, the overall market outlook remains positive, with a projected Compound Annual Growth Rate (CAGR) of 3.9% from 2025 to 2033. This growth is expected to be fuelled by continued technological advancements, the growing importance of data analytics for business decision-making within the SMB sector, and a rising demand for improved operational efficiency through IT solutions.

SMB IT Spending Market Size (In Million)
Competition in the SMB IT spending market is fierce, with major players like Fujitsu, Lenovo, Microsoft, Oracle, SAP, Cisco Systems, IBM, Dell, Toshiba, and HP vying for market share. These established players are constantly innovating and expanding their product portfolios to cater to the diverse needs of SMBs across various sectors and sizes. The market is also seeing the emergence of niche players offering specialized solutions, creating a dynamic and competitive landscape. Strategic partnerships, mergers, and acquisitions are expected to further shape the market's competitive dynamics in the coming years. The focus for these companies will likely be on providing integrated, user-friendly, and affordable solutions that address the specific IT challenges faced by SMBs, ensuring a continued upward trajectory for market growth.
SMB IT Spending Company Market Share
SMB IT Spending Market Report: 2019-2033
Uncover the lucrative potential of the Small and Medium-sized Business (SMB) IT spending market with this comprehensive report. This in-depth analysis provides a detailed overview of market dynamics, growth trends, key players, and future opportunities from 2019 to 2033. Targeting the parent market of IT spending and the child market of SMB IT, this report is essential for investors, technology providers, and industry professionals seeking to navigate this rapidly evolving landscape. The report covers a market valued at xx million in 2025, projected to reach xx million by 2033.
SMB IT Spending Market Dynamics & Structure
This section analyzes the SMB IT spending market's competitive landscape, technological advancements, and regulatory influences. The study period of 2019-2033 provides a comprehensive view of historical trends and future projections. The report examines market concentration, revealing the market share held by key players like Fujitsu, Lenovo Group, Microsoft, Oracle, SAP, Cisco Systems, IBM, Dell, Toshiba, and HP.
- Market Concentration: The market exhibits a moderately concentrated structure, with the top 5 players holding approximately xx% of the market share in 2025.
- Technological Innovation: Cloud computing, AI, and cybersecurity are major drivers, fostering increased adoption of SaaS and cloud-based solutions. Innovation barriers include cost of implementation and lack of skilled IT staff within SMBs.
- Regulatory Frameworks: Data privacy regulations (e.g., GDPR, CCPA) significantly impact IT spending decisions, driving demand for compliance solutions.
- Competitive Product Substitutes: Open-source alternatives and smaller niche players challenge established vendors, increasing competition and driving down prices.
- End-User Demographics: The report segments SMBs by size, industry, and geographic location, providing granular insights into spending patterns and preferences.
- M&A Trends: The report analyzes merger and acquisition activity in the sector, with xx M&A deals recorded between 2019 and 2024, primarily focusing on expanding service offerings and market reach.
SMB IT Spending Growth Trends & Insights
Utilizing a robust methodology (XXX), this section details the evolution of the SMB IT spending market, including CAGR and market penetration rates. The analysis encompasses market size from 2019 to 2033, highlighting shifts in technology adoption and consumer behavior. Key technological disruptions such as the rise of 5G, IoT, and edge computing are analyzed for their impact on market growth. The base year is 2025, and the forecast period is 2025-2033, with the historical period covering 2019-2024. The estimated market size in 2025 is xx million. The report identifies a CAGR of xx% during the forecast period, driven by increasing digital transformation initiatives among SMBs and growing adoption of cloud-based services.
Dominant Regions, Countries, or Segments in SMB IT Spending
This section pinpoints the leading regions and segments driving market growth. North America and Europe currently hold significant market shares, but the Asia-Pacific region is projected to experience the highest growth rate during the forecast period.
- Key Drivers: Government initiatives promoting digitalization, robust infrastructure development, and a growing entrepreneurial ecosystem are key drivers in specific regions.
- Dominance Factors: High internet penetration, strong economic growth, and favorable regulatory environments contribute to regional dominance. The report analyzes market share and growth potential for each region and segment, providing insights into future investment opportunities.
SMB IT Spending Product Landscape
This section offers a concise overview of product innovations and technological advancements within the SMB IT spending market. New product categories and emerging technologies are highlighted, along with analysis of their unique selling propositions and performance metrics. The focus is on solutions that address the specific needs and challenges faced by SMBs.
Key Drivers, Barriers & Challenges in SMB IT Spending
Key Drivers: The market is propelled by factors such as increasing digitalization, the need for enhanced cybersecurity, and the adoption of cloud-based solutions for improved efficiency and scalability. Government initiatives supporting digital transformation within SMBs further fuel market growth.
Challenges & Restraints: Significant challenges include budget constraints within SMBs, lack of technical expertise, and concerns regarding data security. Supply chain disruptions and regulatory complexities also pose significant hurdles. The report quantifies the impact of these challenges on market growth.
Emerging Opportunities in SMB IT Spending
The SMB IT spending market presents substantial untapped potential in emerging markets and underserved industries. Opportunities lie in leveraging innovative technologies, such as AI and IoT, to meet the specific needs of various SMB segments. The evolving preferences of consumers also create opportunities for tailored solutions and services.
Growth Accelerators in the SMB IT Spending Industry
Long-term growth will be accelerated by technological advancements, strategic partnerships, and expansion into new markets. Innovative solutions, coupled with strategic alliances between technology providers and SMB service providers, will significantly enhance market expansion and adoption.
Key Players Shaping the SMB IT Spending Market
- Fujitsu
- Lenovo Group
- Microsoft
- Oracle
- SAP
- Cisco Systems
- IBM
- Dell
- Toshiba
- HP
Notable Milestones in SMB IT Spending Sector
- 2020, Q3: Significant increase in cloud adoption driven by the pandemic.
- 2021, Q1: Launch of several new cybersecurity solutions targeting SMBs.
- 2022, Q4: Major M&A activity consolidating market share among key players.
- 2023, Q2: Government initiatives launched to support digital transformation amongst SMBs.
In-Depth SMB IT Spending Market Outlook
The SMB IT spending market shows robust growth potential, driven by continued technological innovation, increasing digitalization, and supportive government policies. Strategic partnerships and targeted investments in emerging technologies present lucrative opportunities for players seeking to capitalize on this dynamic market. The report offers a comprehensive outlook on future market trends and potential investment avenues.
SMB IT Spending Segmentation
-
1. Application
- 1.1. Small Businesses
- 1.2. Medium-sized Businesses
-
2. Types
- 2.1. Hardware
- 2.2. Software
- 2.3. Services
SMB IT Spending Segmentation By Geography
-
1. North America
- 1.1. United States
- 1.2. Canada
- 1.3. Mexico
-
2. South America
- 2.1. Brazil
- 2.2. Argentina
- 2.3. Rest of South America
-
3. Europe
- 3.1. United Kingdom
- 3.2. Germany
- 3.3. France
- 3.4. Italy
- 3.5. Spain
- 3.6. Russia
- 3.7. Benelux
- 3.8. Nordics
- 3.9. Rest of Europe
-
4. Middle East & Africa
- 4.1. Turkey
- 4.2. Israel
- 4.3. GCC
- 4.4. North Africa
- 4.5. South Africa
- 4.6. Rest of Middle East & Africa
-
5. Asia Pacific
- 5.1. China
- 5.2. India
- 5.3. Japan
- 5.4. South Korea
- 5.5. ASEAN
- 5.6. Oceania
- 5.7. Rest of Asia Pacific
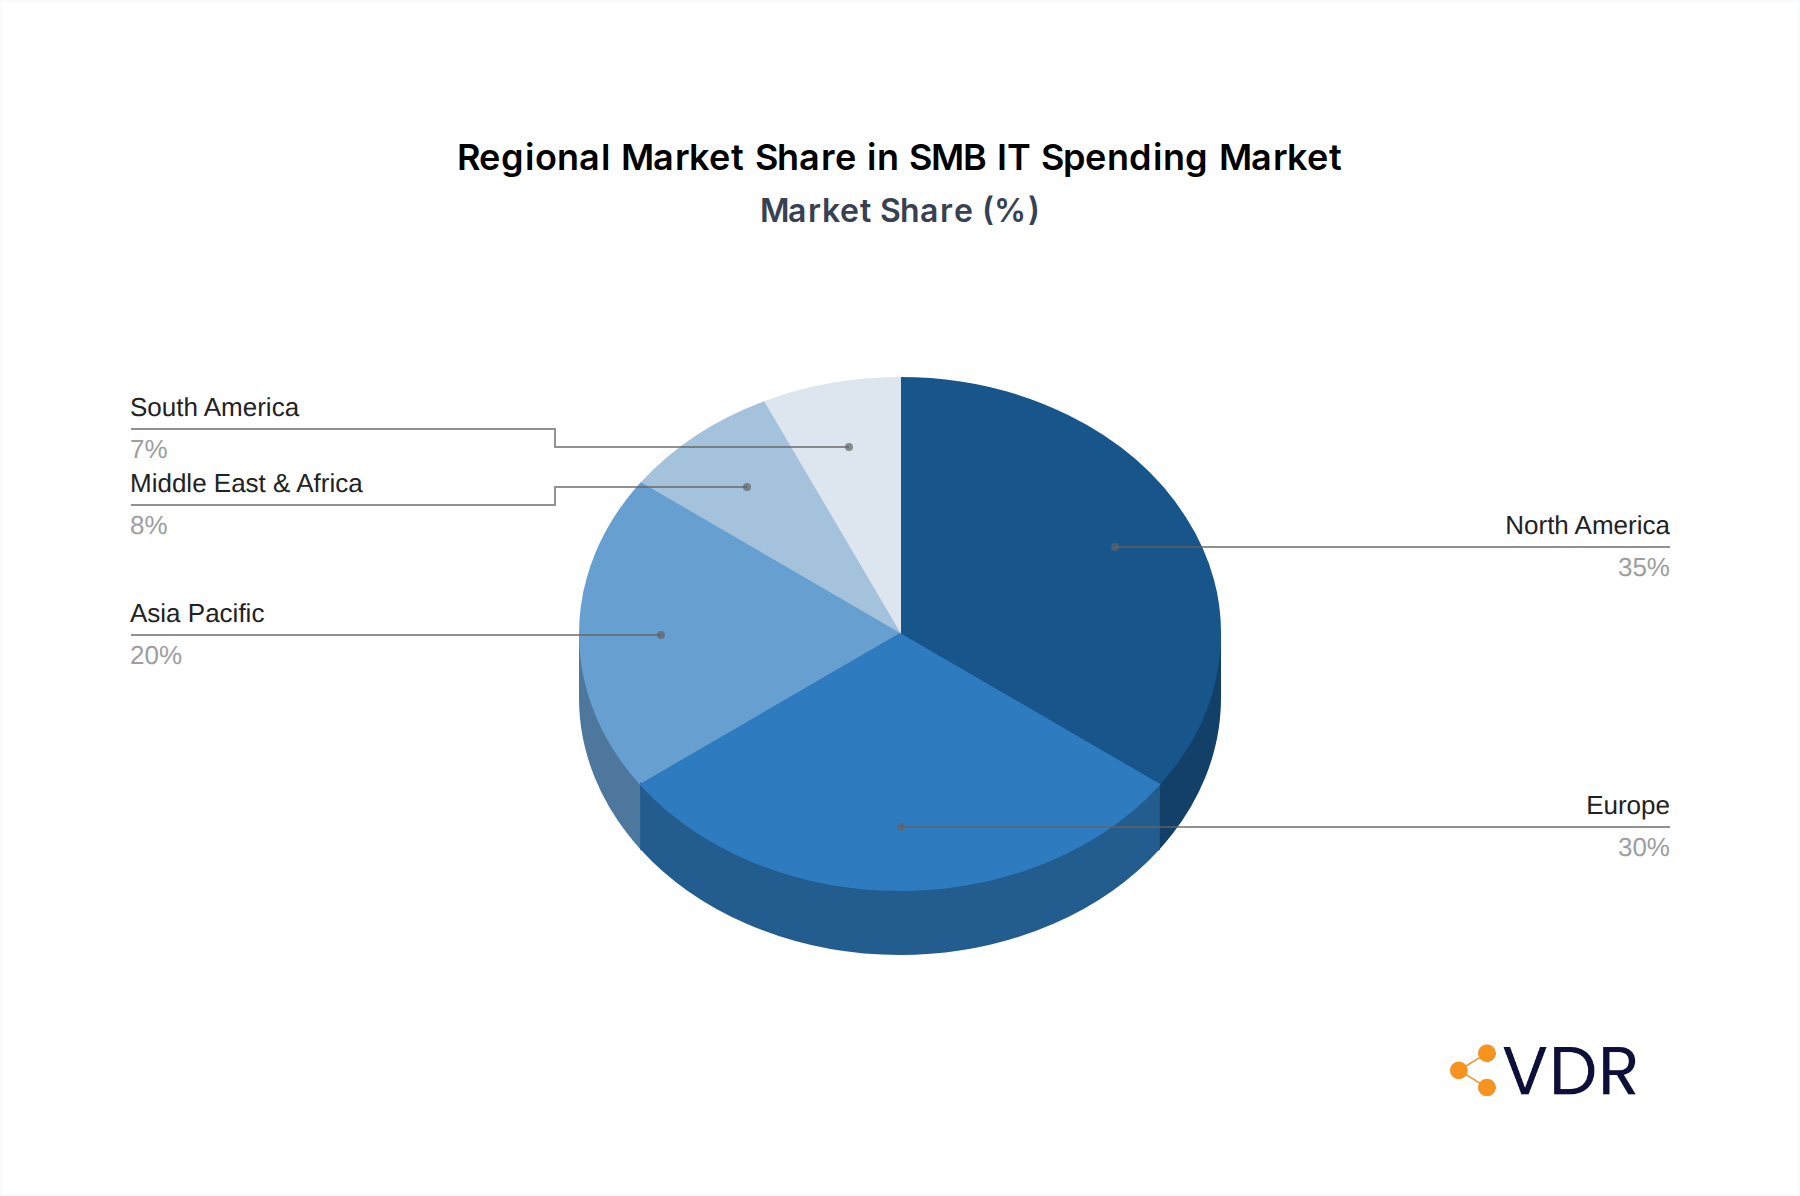
SMB IT Spending Regional Market Share
Geographic Coverage of SMB IT Spending
SMB IT Spending REPORT HIGHLIGHTS
| Aspects | Details |
|---|---|
| Study Period | 2020-2034 |
| Base Year | 2025 |
| Estimated Year | 2026 |
| Forecast Period | 2026-2034 |
| Historical Period | 2020-2025 |
| Growth Rate | CAGR of 3.9% from 2020-2034 |
| Segmentation |
|
Table of Contents
- 1. Introduction
- 1.1. Research Scope
- 1.2. Market Segmentation
- 1.3. Research Methodology
- 1.4. Definitions and Assumptions
- 2. Executive Summary
- 2.1. Introduction
- 3. Market Dynamics
- 3.1. Introduction
- 3.2. Market Drivers
- 3.3. Market Restrains
- 3.4. Market Trends
- 4. Market Factor Analysis
- 4.1. Porters Five Forces
- 4.2. Supply/Value Chain
- 4.3. PESTEL analysis
- 4.4. Market Entropy
- 4.5. Patent/Trademark Analysis
- 5. Global SMB IT Spending Analysis, Insights and Forecast, 2020-2032
- 5.1. Market Analysis, Insights and Forecast - by Application
- 5.1.1. Small Businesses
- 5.1.2. Medium-sized Businesses
- 5.2. Market Analysis, Insights and Forecast - by Types
- 5.2.1. Hardware
- 5.2.2. Software
- 5.2.3. Services
- 5.3. Market Analysis, Insights and Forecast - by Region
- 5.3.1. North America
- 5.3.2. South America
- 5.3.3. Europe
- 5.3.4. Middle East & Africa
- 5.3.5. Asia Pacific
- 5.1. Market Analysis, Insights and Forecast - by Application
- 6. North America SMB IT Spending Analysis, Insights and Forecast, 2020-2032
- 6.1. Market Analysis, Insights and Forecast - by Application
- 6.1.1. Small Businesses
- 6.1.2. Medium-sized Businesses
- 6.2. Market Analysis, Insights and Forecast - by Types
- 6.2.1. Hardware
- 6.2.2. Software
- 6.2.3. Services
- 6.1. Market Analysis, Insights and Forecast - by Application
- 7. South America SMB IT Spending Analysis, Insights and Forecast, 2020-2032
- 7.1. Market Analysis, Insights and Forecast - by Application
- 7.1.1. Small Businesses
- 7.1.2. Medium-sized Businesses
- 7.2. Market Analysis, Insights and Forecast - by Types
- 7.2.1. Hardware
- 7.2.2. Software
- 7.2.3. Services
- 7.1. Market Analysis, Insights and Forecast - by Application
- 8. Europe SMB IT Spending Analysis, Insights and Forecast, 2020-2032
- 8.1. Market Analysis, Insights and Forecast - by Application
- 8.1.1. Small Businesses
- 8.1.2. Medium-sized Businesses
- 8.2. Market Analysis, Insights and Forecast - by Types
- 8.2.1. Hardware
- 8.2.2. Software
- 8.2.3. Services
- 8.1. Market Analysis, Insights and Forecast - by Application
- 9. Middle East & Africa SMB IT Spending Analysis, Insights and Forecast, 2020-2032
- 9.1. Market Analysis, Insights and Forecast - by Application
- 9.1.1. Small Businesses
- 9.1.2. Medium-sized Businesses
- 9.2. Market Analysis, Insights and Forecast - by Types
- 9.2.1. Hardware
- 9.2.2. Software
- 9.2.3. Services
- 9.1. Market Analysis, Insights and Forecast - by Application
- 10. Asia Pacific SMB IT Spending Analysis, Insights and Forecast, 2020-2032
- 10.1. Market Analysis, Insights and Forecast - by Application
- 10.1.1. Small Businesses
- 10.1.2. Medium-sized Businesses
- 10.2. Market Analysis, Insights and Forecast - by Types
- 10.2.1. Hardware
- 10.2.2. Software
- 10.2.3. Services
- 10.1. Market Analysis, Insights and Forecast - by Application
- 11. Competitive Analysis
- 11.1. Global Market Share Analysis 2025
- 11.2. Company Profiles
- 11.2.1 Fujitsu
- 11.2.1.1. Overview
- 11.2.1.2. Products
- 11.2.1.3. SWOT Analysis
- 11.2.1.4. Recent Developments
- 11.2.1.5. Financials (Based on Availability)
- 11.2.2 Lenovo Group
- 11.2.2.1. Overview
- 11.2.2.2. Products
- 11.2.2.3. SWOT Analysis
- 11.2.2.4. Recent Developments
- 11.2.2.5. Financials (Based on Availability)
- 11.2.3 Microsoft
- 11.2.3.1. Overview
- 11.2.3.2. Products
- 11.2.3.3. SWOT Analysis
- 11.2.3.4. Recent Developments
- 11.2.3.5. Financials (Based on Availability)
- 11.2.4 Oracle
- 11.2.4.1. Overview
- 11.2.4.2. Products
- 11.2.4.3. SWOT Analysis
- 11.2.4.4. Recent Developments
- 11.2.4.5. Financials (Based on Availability)
- 11.2.5 SAP
- 11.2.5.1. Overview
- 11.2.5.2. Products
- 11.2.5.3. SWOT Analysis
- 11.2.5.4. Recent Developments
- 11.2.5.5. Financials (Based on Availability)
- 11.2.6 Cisco Systems
- 11.2.6.1. Overview
- 11.2.6.2. Products
- 11.2.6.3. SWOT Analysis
- 11.2.6.4. Recent Developments
- 11.2.6.5. Financials (Based on Availability)
- 11.2.7 IBM
- 11.2.7.1. Overview
- 11.2.7.2. Products
- 11.2.7.3. SWOT Analysis
- 11.2.7.4. Recent Developments
- 11.2.7.5. Financials (Based on Availability)
- 11.2.8 Dell
- 11.2.8.1. Overview
- 11.2.8.2. Products
- 11.2.8.3. SWOT Analysis
- 11.2.8.4. Recent Developments
- 11.2.8.5. Financials (Based on Availability)
- 11.2.9 Toshiba
- 11.2.9.1. Overview
- 11.2.9.2. Products
- 11.2.9.3. SWOT Analysis
- 11.2.9.4. Recent Developments
- 11.2.9.5. Financials (Based on Availability)
- 11.2.10 HP
- 11.2.10.1. Overview
- 11.2.10.2. Products
- 11.2.10.3. SWOT Analysis
- 11.2.10.4. Recent Developments
- 11.2.10.5. Financials (Based on Availability)
- 11.2.1 Fujitsu
List of Figures
- Figure 1: Global SMB IT Spending Revenue Breakdown (million, %) by Region 2025 & 2033
- Figure 2: North America SMB IT Spending Revenue (million), by Application 2025 & 2033
- Figure 3: North America SMB IT Spending Revenue Share (%), by Application 2025 & 2033
- Figure 4: North America SMB IT Spending Revenue (million), by Types 2025 & 2033
- Figure 5: North America SMB IT Spending Revenue Share (%), by Types 2025 & 2033
- Figure 6: North America SMB IT Spending Revenue (million), by Country 2025 & 2033
- Figure 7: North America SMB IT Spending Revenue Share (%), by Country 2025 & 2033
- Figure 8: South America SMB IT Spending Revenue (million), by Application 2025 & 2033
- Figure 9: South America SMB IT Spending Revenue Share (%), by Application 2025 & 2033
- Figure 10: South America SMB IT Spending Revenue (million), by Types 2025 & 2033
- Figure 11: South America SMB IT Spending Revenue Share (%), by Types 2025 & 2033
- Figure 12: South America SMB IT Spending Revenue (million), by Country 2025 & 2033
- Figure 13: South America SMB IT Spending Revenue Share (%), by Country 2025 & 2033
- Figure 14: Europe SMB IT Spending Revenue (million), by Application 2025 & 2033
- Figure 15: Europe SMB IT Spending Revenue Share (%), by Application 2025 & 2033
- Figure 16: Europe SMB IT Spending Revenue (million), by Types 2025 & 2033
- Figure 17: Europe SMB IT Spending Revenue Share (%), by Types 2025 & 2033
- Figure 18: Europe SMB IT Spending Revenue (million), by Country 2025 & 2033
- Figure 19: Europe SMB IT Spending Revenue Share (%), by Country 2025 & 2033
- Figure 20: Middle East & Africa SMB IT Spending Revenue (million), by Application 2025 & 2033
- Figure 21: Middle East & Africa SMB IT Spending Revenue Share (%), by Application 2025 & 2033
- Figure 22: Middle East & Africa SMB IT Spending Revenue (million), by Types 2025 & 2033
- Figure 23: Middle East & Africa SMB IT Spending Revenue Share (%), by Types 2025 & 2033
- Figure 24: Middle East & Africa SMB IT Spending Revenue (million), by Country 2025 & 2033
- Figure 25: Middle East & Africa SMB IT Spending Revenue Share (%), by Country 2025 & 2033
- Figure 26: Asia Pacific SMB IT Spending Revenue (million), by Application 2025 & 2033
- Figure 27: Asia Pacific SMB IT Spending Revenue Share (%), by Application 2025 & 2033
- Figure 28: Asia Pacific SMB IT Spending Revenue (million), by Types 2025 & 2033
- Figure 29: Asia Pacific SMB IT Spending Revenue Share (%), by Types 2025 & 2033
- Figure 30: Asia Pacific SMB IT Spending Revenue (million), by Country 2025 & 2033
- Figure 31: Asia Pacific SMB IT Spending Revenue Share (%), by Country 2025 & 2033
List of Tables
- Table 1: Global SMB IT Spending Revenue million Forecast, by Application 2020 & 2033
- Table 2: Global SMB IT Spending Revenue million Forecast, by Types 2020 & 2033
- Table 3: Global SMB IT Spending Revenue million Forecast, by Region 2020 & 2033
- Table 4: Global SMB IT Spending Revenue million Forecast, by Application 2020 & 2033
- Table 5: Global SMB IT Spending Revenue million Forecast, by Types 2020 & 2033
- Table 6: Global SMB IT Spending Revenue million Forecast, by Country 2020 & 2033
- Table 7: United States SMB IT Spending Revenue (million) Forecast, by Application 2020 & 2033
- Table 8: Canada SMB IT Spending Revenue (million) Forecast, by Application 2020 & 2033
- Table 9: Mexico SMB IT Spending Revenue (million) Forecast, by Application 2020 & 2033
- Table 10: Global SMB IT Spending Revenue million Forecast, by Application 2020 & 2033
- Table 11: Global SMB IT Spending Revenue million Forecast, by Types 2020 & 2033
- Table 12: Global SMB IT Spending Revenue million Forecast, by Country 2020 & 2033
- Table 13: Brazil SMB IT Spending Revenue (million) Forecast, by Application 2020 & 2033
- Table 14: Argentina SMB IT Spending Revenue (million) Forecast, by Application 2020 & 2033
- Table 15: Rest of South America SMB IT Spending Revenue (million) Forecast, by Application 2020 & 2033
- Table 16: Global SMB IT Spending Revenue million Forecast, by Application 2020 & 2033
- Table 17: Global SMB IT Spending Revenue million Forecast, by Types 2020 & 2033
- Table 18: Global SMB IT Spending Revenue million Forecast, by Country 2020 & 2033
- Table 19: United Kingdom SMB IT Spending Revenue (million) Forecast, by Application 2020 & 2033
- Table 20: Germany SMB IT Spending Revenue (million) Forecast, by Application 2020 & 2033
- Table 21: France SMB IT Spending Revenue (million) Forecast, by Application 2020 & 2033
- Table 22: Italy SMB IT Spending Revenue (million) Forecast, by Application 2020 & 2033
- Table 23: Spain SMB IT Spending Revenue (million) Forecast, by Application 2020 & 2033
- Table 24: Russia SMB IT Spending Revenue (million) Forecast, by Application 2020 & 2033
- Table 25: Benelux SMB IT Spending Revenue (million) Forecast, by Application 2020 & 2033
- Table 26: Nordics SMB IT Spending Revenue (million) Forecast, by Application 2020 & 2033
- Table 27: Rest of Europe SMB IT Spending Revenue (million) Forecast, by Application 2020 & 2033
- Table 28: Global SMB IT Spending Revenue million Forecast, by Application 2020 & 2033
- Table 29: Global SMB IT Spending Revenue million Forecast, by Types 2020 & 2033
- Table 30: Global SMB IT Spending Revenue million Forecast, by Country 2020 & 2033
- Table 31: Turkey SMB IT Spending Revenue (million) Forecast, by Application 2020 & 2033
- Table 32: Israel SMB IT Spending Revenue (million) Forecast, by Application 2020 & 2033
- Table 33: GCC SMB IT Spending Revenue (million) Forecast, by Application 2020 & 2033
- Table 34: North Africa SMB IT Spending Revenue (million) Forecast, by Application 2020 & 2033
- Table 35: South Africa SMB IT Spending Revenue (million) Forecast, by Application 2020 & 2033
- Table 36: Rest of Middle East & Africa SMB IT Spending Revenue (million) Forecast, by Application 2020 & 2033
- Table 37: Global SMB IT Spending Revenue million Forecast, by Application 2020 & 2033
- Table 38: Global SMB IT Spending Revenue million Forecast, by Types 2020 & 2033
- Table 39: Global SMB IT Spending Revenue million Forecast, by Country 2020 & 2033
- Table 40: China SMB IT Spending Revenue (million) Forecast, by Application 2020 & 2033
- Table 41: India SMB IT Spending Revenue (million) Forecast, by Application 2020 & 2033
- Table 42: Japan SMB IT Spending Revenue (million) Forecast, by Application 2020 & 2033
- Table 43: South Korea SMB IT Spending Revenue (million) Forecast, by Application 2020 & 2033
- Table 44: ASEAN SMB IT Spending Revenue (million) Forecast, by Application 2020 & 2033
- Table 45: Oceania SMB IT Spending Revenue (million) Forecast, by Application 2020 & 2033
- Table 46: Rest of Asia Pacific SMB IT Spending Revenue (million) Forecast, by Application 2020 & 2033
Frequently Asked Questions
1. What is the projected Compound Annual Growth Rate (CAGR) of the SMB IT Spending?
The projected CAGR is approximately 3.9%.
2. Which companies are prominent players in the SMB IT Spending?
Key companies in the market include Fujitsu, Lenovo Group, Microsoft, Oracle, SAP, Cisco Systems, IBM, Dell, Toshiba, HP.
3. What are the main segments of the SMB IT Spending?
The market segments include Application, Types.
4. Can you provide details about the market size?
The market size is estimated to be USD 667690 million as of 2022.
5. What are some drivers contributing to market growth?
N/A
6. What are the notable trends driving market growth?
N/A
7. Are there any restraints impacting market growth?
N/A
8. Can you provide examples of recent developments in the market?
N/A
9. What pricing options are available for accessing the report?
Pricing options include single-user, multi-user, and enterprise licenses priced at USD 3350.00, USD 5025.00, and USD 6700.00 respectively.
10. Is the market size provided in terms of value or volume?
The market size is provided in terms of value, measured in million.
11. Are there any specific market keywords associated with the report?
Yes, the market keyword associated with the report is "SMB IT Spending," which aids in identifying and referencing the specific market segment covered.
12. How do I determine which pricing option suits my needs best?
The pricing options vary based on user requirements and access needs. Individual users may opt for single-user licenses, while businesses requiring broader access may choose multi-user or enterprise licenses for cost-effective access to the report.
13. Are there any additional resources or data provided in the SMB IT Spending report?
While the report offers comprehensive insights, it's advisable to review the specific contents or supplementary materials provided to ascertain if additional resources or data are available.
14. How can I stay updated on further developments or reports in the SMB IT Spending?
To stay informed about further developments, trends, and reports in the SMB IT Spending, consider subscribing to industry newsletters, following relevant companies and organizations, or regularly checking reputable industry news sources and publications.
Methodology
Step 1 - Identification of Relevant Samples Size from Population Database


Step 2 - Approaches for Defining Global Market Size (Value, Volume* & Price*)

Note*: In applicable scenarios
Step 3 - Data Sources
Primary Research
- Web Analytics
- Survey Reports
- Research Institute
- Latest Research Reports
- Opinion Leaders
Secondary Research
- Annual Reports
- White Paper
- Latest Press Release
- Industry Association
- Paid Database
- Investor Presentations

Step 4 - Data Triangulation
Involves using different sources of information in order to increase the validity of a study
These sources are likely to be stakeholders in a program - participants, other researchers, program staff, other community members, and so on.
Then we put all data in single framework & apply various statistical tools to find out the dynamic on the market.
During the analysis stage, feedback from the stakeholder groups would be compared to determine areas of agreement as well as areas of divergence