

Key Insights
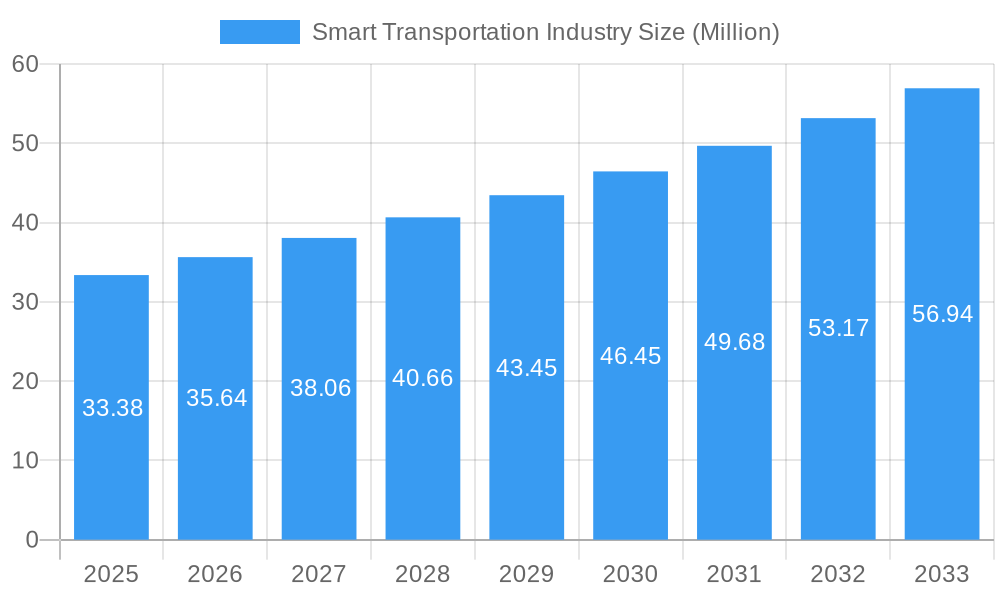
The global Smart Transportation market is projected for robust expansion, with an estimated market size of USD 33.38 million in 2025, poised to grow at a Compound Annual Growth Rate (CAGR) of 6.79% through 2033. This significant growth is propelled by escalating demand for efficient traffic management solutions, a heightened focus on road safety and security, and the increasing adoption of smart parking systems. The proliferation of connected vehicles and the burgeoning automotive telematics sector are further contributing to market momentum. Furthermore, the growing need for optimized public transport operations and the efficiency gains offered by smart freight management are key drivers. Emerging economies are increasingly investing in smart city initiatives, integrating advanced transportation technologies to alleviate congestion, reduce pollution, and enhance the overall urban mobility experience. This surge in investment and technological advancement underscores a transformative period for the transportation landscape.
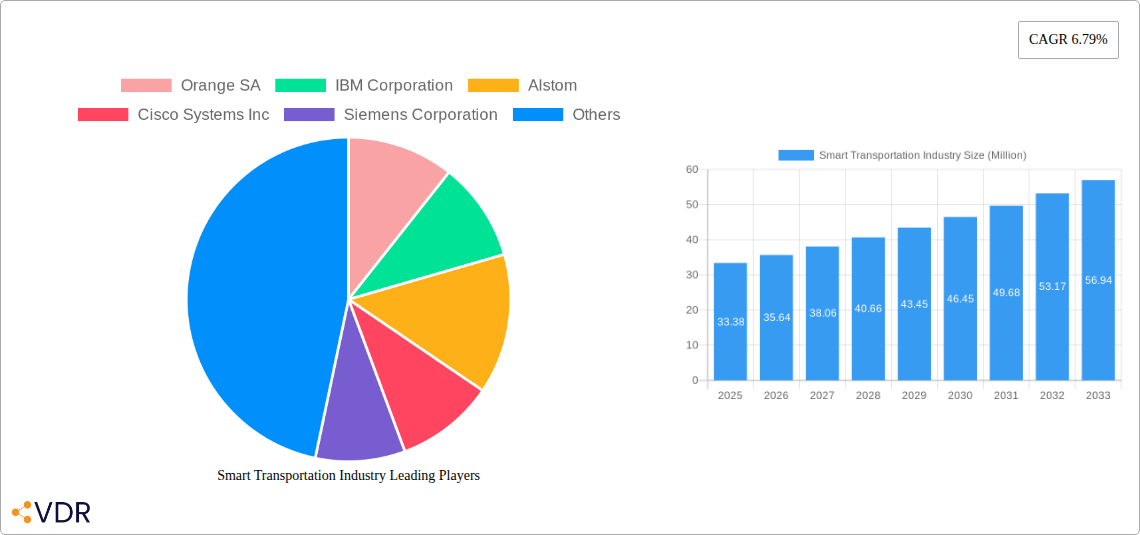
Smart Transportation Industry Market Size (In Million)
Key trends shaping the Smart Transportation industry include the widespread implementation of Advanced Traveler Information Systems (ATIS) for real-time traffic updates and route optimization, and the deployment of Advanced Transportation Management Systems (ATMS) for dynamic traffic signal control and incident management. The integration of Cooperative Vehicle Systems (CVS), enabling vehicles to communicate with each other and with infrastructure, is a critical advancement for improving safety and traffic flow. While the market experiences strong tailwinds, potential restraints such as high initial investment costs for infrastructure upgrades and concerns surrounding data privacy and cybersecurity need to be strategically addressed. However, ongoing technological innovations, supportive government policies, and increasing consumer awareness regarding the benefits of smart transportation are expected to overcome these challenges, paving the way for sustained and accelerated market growth across diverse applications and product segments globally.
Smart Transportation Industry Company Market Share
Smart Transportation Industry Report: Navigating the Future of Mobility
This comprehensive report provides an in-depth analysis of the global Smart Transportation Industry, encompassing a detailed market outlook from 2019 to 2033, with a base year of 2025. We delve into the intricate dynamics, growth trends, dominant regions, and the product landscape of this rapidly evolving sector. The report highlights key players, significant milestones, and emerging opportunities that are shaping the future of intelligent mobility solutions. Focusing on both parent and child market segments, this report offers actionable insights for industry professionals, investors, and policymakers seeking to understand and capitalize on the transformative power of smart transportation. All quantitative data is presented in million units.
Smart Transportation Industry Market Dynamics & Structure
The Smart Transportation Industry is characterized by a dynamic interplay of technological innovation, evolving regulatory frameworks, and increasing end-user demand for efficient, safe, and sustainable mobility. Market concentration varies across different sub-segments, with a notable presence of large technology corporations and specialized solution providers. Technological innovation is primarily driven by advancements in Artificial Intelligence (AI), Internet of Things (IoT), 5G connectivity, and big data analytics, which are crucial for developing sophisticated traffic management systems, autonomous vehicles, and integrated mobility platforms.
- Market Concentration: The market exhibits moderate to high concentration in segments like Advanced Transportation Management Systems (ATMS) and Automotive Telematics, where established players have a strong foothold. However, emerging areas like Cooperative Vehicle Systems are seeing increased competition from new entrants.
- Technological Innovation Drivers:
- AI and Machine Learning: For predictive analytics in traffic flow, route optimization, and demand forecasting.
- IoT and Connectivity: Enabling real-time data exchange between vehicles, infrastructure, and users.
- 5G Technology: Facilitating low latency and high bandwidth for advanced applications like autonomous driving and vehicle-to-everything (V2X) communication.
- Big Data Analytics: Deriving actionable insights from vast amounts of transportation data.
- Regulatory Frameworks: Governments worldwide are increasingly implementing policies to support smart city initiatives, promote electric vehicle adoption, and standardize data sharing protocols. These regulations are crucial for fostering market growth and ensuring interoperability.
- Competitive Product Substitutes: While direct substitutes are limited, conventional transportation systems and incremental technological upgrades represent indirect competition. The focus remains on providing superior efficiency, safety, and user experience.
- End-User Demographics: A growing urban population, increasing environmental consciousness, and a demand for personalized and on-demand mobility services are key demographic drivers. The rise of the sharing economy and the adoption of smart devices further influence consumer behavior.
- Mergers & Acquisitions (M&A) Trends: The industry is witnessing strategic M&A activities as larger companies seek to acquire innovative technologies, expand their market reach, and consolidate their positions. Deal volumes in recent years indicate a trend towards vertical integration and the acquisition of specialized startups.
Smart Transportation Industry Growth Trends & Insights
The global Smart Transportation Industry is poised for substantial growth, driven by an unprecedented surge in adoption rates across various applications and a profound shift in consumer behavior towards more connected and sustainable mobility solutions. Market size evolution is projected to be robust, fueled by significant investments in smart city infrastructure and the increasing integration of advanced technologies into existing transportation networks. The base year of 2025 marks a pivotal point, with the forecast period of 2025–2033 expected to witness accelerated expansion.
Technological disruptions are at the forefront of this growth, with innovations in Artificial Intelligence (AI), the Internet of Things (IoT), 5G connectivity, and autonomous driving systems fundamentally reshaping how people and goods move. These advancements are not only enhancing the efficiency and safety of transportation but also creating new service models and revenue streams. For instance, the widespread deployment of smart traffic management systems, enabled by real-time data analytics, is leading to significant reductions in congestion and travel times, thereby improving urban livability.
Consumer behavior is demonstrably shifting towards embracing these new technologies. There is a growing preference for integrated mobility platforms that offer seamless journey planning, real-time updates, and personalized services. The demand for on-demand services, such as ride-sharing and micro-mobility, continues to rise, further pushing the adoption of smart transportation solutions. Furthermore, increasing environmental awareness is driving the demand for electric and shared mobility options, aligning perfectly with the goals of smart transportation initiatives.
Market penetration of smart transportation solutions is steadily increasing across developed and developing economies. Advanced Traveler Information Systems (ATIS) are becoming ubiquitous, providing drivers and public transport users with critical real-time information. Similarly, Advanced Transportation Management Systems (ATMS) are being deployed more extensively to optimize traffic flow and manage infrastructure. The growing emphasis on road safety and security is also a significant growth driver, with connected and intelligent systems playing a crucial role in accident prevention and emergency response.
The freight sector is also experiencing a digital transformation, with smart logistics and supply chain management solutions enhancing efficiency and transparency. The deployment of IoT devices for tracking shipments, optimizing delivery routes, and managing warehouse operations is becoming standard practice. This overall trend signifies a robust CAGR (Compound Annual Growth Rate) for the Smart Transportation Industry, indicating sustained and significant market expansion over the coming decade. The confluence of technological advancements, supportive policies, and evolving consumer preferences positions the Smart Transportation Industry for remarkable growth and innovation.
Dominant Regions, Countries, or Segments in Smart Transportation Industry
The Smart Transportation Industry exhibits distinct patterns of dominance across various regions, countries, and application segments, driven by a complex interplay of economic policies, infrastructure development, technological adoption, and societal needs. Understanding these dominant forces is crucial for strategic planning and market entry.
Dominant Region: North America
North America, particularly the United States, stands out as a dominant force in the Smart Transportation Industry. This leadership is attributed to several key factors:
- Economic Policies and Investment: Significant government funding and private sector investment in smart city initiatives, autonomous vehicle research, and intelligent infrastructure development have been pivotal. Policies promoting public-private partnerships further accelerate innovation and deployment.
- Infrastructure Development: The region boasts a well-established and technologically advanced transportation infrastructure, which serves as a strong foundation for integrating smart solutions. Continuous upgrades and investments in smart roads, connected traffic signals, and advanced public transport systems are prevalent.
- Technological Adoption and R&D: North America is a global hub for technological innovation, with leading companies heavily investing in research and development for AI, IoT, and autonomous driving. This fosters a fertile ground for the creation and deployment of cutting-edge smart transportation products and services.
- Market Demand: A large and digitally-savvy population, coupled with increasing urbanization, drives a high demand for efficient, safe, and convenient transportation solutions. The growing acceptance of ride-sharing, car-sharing, and on-demand mobility services further fuels market penetration.
- Market Share and Growth Potential: North America commands a significant market share in key segments like Automotive Telematics and Advanced Transportation Management Systems (ATMS). The region's commitment to innovation and infrastructure upgrades suggests continued strong growth potential.
Dominant Segment: Traffic Management
Within the application segments, Traffic Management emerges as a consistently dominant and foundational area in the Smart Transportation Industry. Its importance stems from the universal challenge of urban congestion and the imperative to optimize the flow of people and goods.
- Key Drivers:
- Urbanization and Congestion: Rapidly growing urban populations worldwide place immense pressure on existing road networks, making efficient traffic management a critical necessity.
- Safety and Security: Advanced traffic management systems contribute significantly to road safety by reducing accidents through intelligent signal control, real-time hazard alerts, and incident detection.
- Environmental Concerns: Optimizing traffic flow directly leads to reduced fuel consumption, lower emissions, and improved air quality, aligning with global sustainability goals.
- Economic Efficiency: Reduced travel times and improved logistics translate into significant economic benefits for businesses and individuals.
- Dominance Factors:
- Early Adoption and Maturity: Traffic management solutions were among the first to benefit from technological advancements in sensors, communication networks, and data analytics, leading to a more mature and widespread deployment.
- Broad Applicability: These systems benefit all modes of transportation – private vehicles, public transit, and freight – making them a universal solution.
- Integration Hub: Traffic management systems act as a central hub for integrating various other smart transportation components, such as ATIS, public transport information, and emergency services.
- Quantifiable Impact: The benefits of improved traffic flow, such as reduced journey times and lower emissions, are highly quantifiable, making it easier to justify investments.
- Market Share and Growth Potential: The Traffic Management segment holds a substantial market share across all major regions. Its growth potential remains exceptionally high due to the ongoing need for optimization in increasingly crowded urban environments and the continuous evolution of technologies like AI-powered adaptive traffic control.
Other notable segments contributing significantly to market growth include Road Safety and Security and Public Transport, both of which are intrinsically linked to the broader goals of smart transportation and are witnessing substantial technological integration and investment. The Automotive Telematics segment is also a key growth engine, driven by the increasing connectivity of vehicles and the demand for in-car services and data.
Smart Transportation Industry Product Landscape
The Smart Transportation Industry is characterized by a diverse and rapidly evolving product landscape, driven by continuous innovation in software, hardware, and integrated solutions. Key product types include Advanced Traveler Information Systems (ATIS), which provide real-time data on traffic conditions, transit schedules, and route planning, enhancing user experience and decision-making. Advanced Transportation Management Systems (ATMS) are crucial for optimizing traffic flow, managing infrastructure, and responding to incidents through sophisticated control centers and sensor networks.
Advanced Public Transportation Systems (APTS) are transforming urban mobility by integrating real-time tracking, smart ticketing, and passenger information platforms. Cooperative Vehicle Systems, including Vehicle-to-Vehicle (V2V) and Vehicle-to-Infrastructure (V2I) communication, are foundational for autonomous driving and enhanced safety. These products are designed for seamless integration, data-driven decision-making, and a focus on improving efficiency, sustainability, and the overall safety of transportation networks.
Key Drivers, Barriers & Challenges in Smart Transportation Industry
The Smart Transportation Industry is propelled by powerful forces, with technological advancements serving as a primary driver. The integration of AI, IoT, 5G, and big data analytics enables real-time monitoring, predictive maintenance, and optimized route planning, leading to increased efficiency and reduced operational costs. Economic factors, such as the growing demand for sustainable and efficient mobility solutions in urban centers and the potential for economic growth through improved logistics, also significantly contribute. Supportive government policies and initiatives, including smart city development plans and investments in digital infrastructure, are crucial catalysts.
However, the industry faces considerable challenges. High implementation costs for advanced technologies and infrastructure upgrades can be a significant barrier, particularly for smaller municipalities or developing regions. Regulatory hurdles and the lack of standardized protocols across different systems and regions can hinder interoperability and widespread adoption. Cybersecurity concerns are paramount, as connected transportation systems are vulnerable to cyber-attacks, posing risks to safety and data privacy. Supply chain disruptions for critical components, such as advanced sensors and processing units, can also impact deployment timelines and costs.
Emerging Opportunities in Smart Transportation Industry
Emerging opportunities in the Smart Transportation Industry are vast and multifaceted, driven by evolving consumer preferences and the continuous advancement of technology. The growing demand for personalized and on-demand mobility solutions presents significant opportunities for integrated mobility platforms and MaaS (Mobility as a Service) offerings. The increasing focus on sustainability is creating a substantial market for electric vehicle (EV) charging infrastructure and smart grid integration for transportation.
Furthermore, the expansion of autonomous driving technology opens new avenues for freight delivery automation and personalized passenger transport. Data monetization, through the ethical and secure collection and analysis of transportation data, offers new revenue streams for stakeholders. The development of smart logistics and supply chain solutions, leveraging IoT and AI, presents opportunities to optimize freight operations, reduce costs, and improve delivery efficiency. Untapped markets in developing economies, eager to leapfrog traditional infrastructure, also represent significant growth potential.
Growth Accelerators in the Smart Transportation Industry Industry
Several key catalysts are accelerating growth in the Smart Transportation Industry. Technological breakthroughs, particularly in AI-powered predictive analytics and edge computing, are enabling more intelligent and responsive transportation systems. The increasing convergence of automotive, technology, and infrastructure sectors is fostering strategic partnerships and collaborations, leading to the development of comprehensive mobility ecosystems.
Market expansion strategies, including government initiatives for smart city development and the creation of dedicated innovation zones, are creating environments conducive to rapid deployment and adoption. The growing global awareness of climate change and the need for sustainable solutions is a powerful accelerator, driving demand for electric vehicles and cleaner transportation alternatives. Furthermore, the continuous refinement of data analytics and cybersecurity measures is building greater trust and confidence in smart transportation technologies, encouraging wider acceptance and investment.
Key Players Shaping the Smart Transportation Industry Market
- Orange SA
- IBM Corporation
- Alstom
- Cisco Systems Inc
- Siemens Corporation
- AVEVA Group PLC
- Huawei Technologies Co Ltd
- Oracle Corporation
- Hitachi Ltd
- Advantech Co Ltd
- SAP SE
Notable Milestones in Smart Transportation Industry Sector
- November 2023 – Hitachi ZeroCarbon Ltd. has partnered with FirstGroup plc to lead the UK's shift to electric buses. The collaboration, which is part of FirstGroup's bus fleet and infrastructure decarbonisation programme, will provide batteries for First Bus's expanding electric bus fleet, helping to make a positive impact on air quality, tackle congestion and improve customer experience.
- August 2023 - NEC India partners with Mowasalat for smart transportation in Qatar, enabling travel solutions for people attending the tournament in Qatar, the implementation of ITMS for Tournament Bus Service (TBS), and helping to enable a best-in-class public transportation experience for millions of Football admirers from all over the world.
In-Depth Smart Transportation Industry Market Outlook
The Smart Transportation Industry market outlook is exceptionally positive, driven by a confluence of transformative trends and strategic investments. Growth accelerators such as the pervasive adoption of AI for predictive traffic management and route optimization, coupled with the widespread deployment of IoT devices for real-time data collection, are creating highly efficient and responsive transportation networks. The ongoing global push towards sustainable mobility, exemplified by the rapid expansion of electric vehicle infrastructure and the integration of renewable energy sources into the transportation ecosystem, is a significant growth engine. Strategic partnerships between technology providers, automotive manufacturers, and government agencies are fostering innovation and accelerating the development and deployment of comprehensive smart mobility solutions. The increasing demand for integrated Mobility as a Service (MaaS) platforms, which offer seamless, end-to-end travel experiences, further solidifies the market's growth trajectory. The future of transportation is undeniably intelligent, connected, and sustainable, presenting substantial opportunities for stakeholders who can adapt to and capitalize on these evolving dynamics.
Smart Transportation Industry Segmentation
-
1. Application
- 1.1. Traffic Management
- 1.2. Road Safety and Security
- 1.3. Parking Management
- 1.4. Public Transport
- 1.5. Automotive Telematics
- 1.6. Freight
- 1.7. Other Applications
-
2. Product Type
- 2.1. Advanced Traveler Information Systems (ATIS)
- 2.2. Advanced Transportation Management Systems (ATMS)
- 2.3. Advanced Transportation Pricing Systems (ATPS)
- 2.4. Advanced Public Transportation Systems (APTS)
- 2.5. Cooperative Vehicle Systems
Smart Transportation Industry Segmentation By Geography
-
1. North America
- 1.1. United States
- 1.2. Canada
-
2. Europe
- 2.1. United Kingdom
- 2.2. Germany
- 2.3. France
-
3. Asia
- 3.1. China
- 3.2. Japan
- 4. Australia and New Zealand
-
5. Latin America
- 5.1. Mexico
- 5.2. Brazil
-
6. Middle East and Africa
- 6.1. United Arab Emirates
- 6.2. South Africa
- 6.3. Saudi Arabia
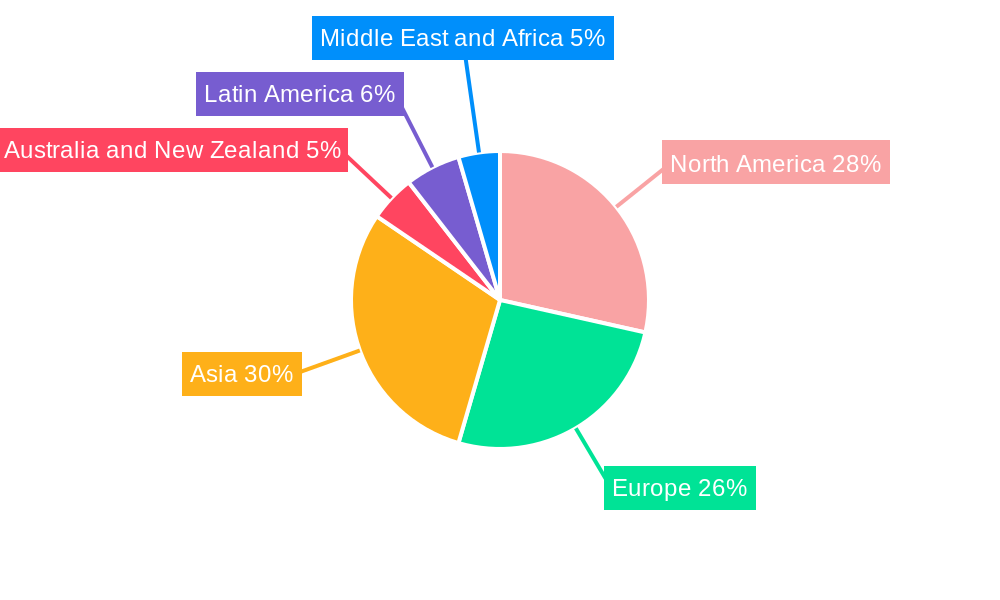
Smart Transportation Industry Regional Market Share
Geographic Coverage of Smart Transportation Industry
Smart Transportation Industry REPORT HIGHLIGHTS
| Aspects | Details |
|---|---|
| Study Period | 2020-2034 |
| Base Year | 2025 |
| Estimated Year | 2026 |
| Forecast Period | 2026-2034 |
| Historical Period | 2020-2025 |
| Growth Rate | CAGR of 6.79% from 2020-2034 |
| Segmentation |
|
Table of Contents
- 1. Introduction
- 1.1. Research Scope
- 1.2. Market Segmentation
- 1.3. Research Objective
- 1.4. Definitions and Assumptions
- 2. Executive Summary
- 2.1. Market Snapshot
- 3. Market Dynamics
- 3.1. Market Drivers
- 3.2. Market Restrains
- 3.3. Market Trends
- 3.4. Market Opportunities
- 4. Market Factor Analysis
- 4.1. Porters Five Forces
- 4.1.1. Bargaining Power of Suppliers
- 4.1.2. Bargaining Power of Buyers
- 4.1.3. Threat of New Entrants
- 4.1.4. Threat of Substitutes
- 4.1.5. Competitive Rivalry
- 4.2. PESTEL analysis
- 4.3. BCG Analysis
- 4.3.1. Stars (High Growth, High Market Share)
- 4.3.2. Cash Cows (Low Growth, High Market Share)
- 4.3.3. Question Mark (High Growth, Low Market Share)
- 4.3.4. Dogs (Low Growth, Low Market Share)
- 4.4. Ansoff Matrix Analysis
- 4.5. Supply Chain Analysis
- 4.6. Regulatory Landscape
- 4.7. Current Market Potential and Opportunity Assessment (TAM–SAM–SOM Framework)
- 4.8. VDR Analyst Note
- 4.1. Porters Five Forces
- 5. Market Analysis, Insights and Forecast 2021-2033
- 5.1. Market Analysis, Insights and Forecast - by Application
- 5.1.1. Traffic Management
- 5.1.2. Road Safety and Security
- 5.1.3. Parking Management
- 5.1.4. Public Transport
- 5.1.5. Automotive Telematics
- 5.1.6. Freight
- 5.1.7. Other Applications
- 5.2. Market Analysis, Insights and Forecast - by Product Type
- 5.2.1. Advanced Traveler Information Systems (ATIS)
- 5.2.2. Advanced Transportation Management Systems (ATMS)
- 5.2.3. Advanced Transportation Pricing Systems (ATPS)
- 5.2.4. Advanced Public Transportation Systems (APTS)
- 5.2.5. Cooperative Vehicle Systems
- 5.3. Market Analysis, Insights and Forecast - by Region
- 5.3.1. North America
- 5.3.2. Europe
- 5.3.3. Asia
- 5.3.4. Australia and New Zealand
- 5.3.5. Latin America
- 5.3.6. Middle East and Africa
- 5.1. Market Analysis, Insights and Forecast - by Application
- 6. Global Smart Transportation Industry Analysis, Insights and Forecast, 2021-2033
- 6.1. Market Analysis, Insights and Forecast - by Application
- 6.1.1. Traffic Management
- 6.1.2. Road Safety and Security
- 6.1.3. Parking Management
- 6.1.4. Public Transport
- 6.1.5. Automotive Telematics
- 6.1.6. Freight
- 6.1.7. Other Applications
- 6.2. Market Analysis, Insights and Forecast - by Product Type
- 6.2.1. Advanced Traveler Information Systems (ATIS)
- 6.2.2. Advanced Transportation Management Systems (ATMS)
- 6.2.3. Advanced Transportation Pricing Systems (ATPS)
- 6.2.4. Advanced Public Transportation Systems (APTS)
- 6.2.5. Cooperative Vehicle Systems
- 6.1. Market Analysis, Insights and Forecast - by Application
- 7. North America Smart Transportation Industry Analysis, Insights and Forecast, 2021-2033
- 7.1. Market Analysis, Insights and Forecast - by Application
- 7.1.1. Traffic Management
- 7.1.2. Road Safety and Security
- 7.1.3. Parking Management
- 7.1.4. Public Transport
- 7.1.5. Automotive Telematics
- 7.1.6. Freight
- 7.1.7. Other Applications
- 7.2. Market Analysis, Insights and Forecast - by Product Type
- 7.2.1. Advanced Traveler Information Systems (ATIS)
- 7.2.2. Advanced Transportation Management Systems (ATMS)
- 7.2.3. Advanced Transportation Pricing Systems (ATPS)
- 7.2.4. Advanced Public Transportation Systems (APTS)
- 7.2.5. Cooperative Vehicle Systems
- 7.1. Market Analysis, Insights and Forecast - by Application
- 8. Europe Smart Transportation Industry Analysis, Insights and Forecast, 2021-2033
- 8.1. Market Analysis, Insights and Forecast - by Application
- 8.1.1. Traffic Management
- 8.1.2. Road Safety and Security
- 8.1.3. Parking Management
- 8.1.4. Public Transport
- 8.1.5. Automotive Telematics
- 8.1.6. Freight
- 8.1.7. Other Applications
- 8.2. Market Analysis, Insights and Forecast - by Product Type
- 8.2.1. Advanced Traveler Information Systems (ATIS)
- 8.2.2. Advanced Transportation Management Systems (ATMS)
- 8.2.3. Advanced Transportation Pricing Systems (ATPS)
- 8.2.4. Advanced Public Transportation Systems (APTS)
- 8.2.5. Cooperative Vehicle Systems
- 8.1. Market Analysis, Insights and Forecast - by Application
- 9. Asia Smart Transportation Industry Analysis, Insights and Forecast, 2021-2033
- 9.1. Market Analysis, Insights and Forecast - by Application
- 9.1.1. Traffic Management
- 9.1.2. Road Safety and Security
- 9.1.3. Parking Management
- 9.1.4. Public Transport
- 9.1.5. Automotive Telematics
- 9.1.6. Freight
- 9.1.7. Other Applications
- 9.2. Market Analysis, Insights and Forecast - by Product Type
- 9.2.1. Advanced Traveler Information Systems (ATIS)
- 9.2.2. Advanced Transportation Management Systems (ATMS)
- 9.2.3. Advanced Transportation Pricing Systems (ATPS)
- 9.2.4. Advanced Public Transportation Systems (APTS)
- 9.2.5. Cooperative Vehicle Systems
- 9.1. Market Analysis, Insights and Forecast - by Application
- 10. Australia and New Zealand Smart Transportation Industry Analysis, Insights and Forecast, 2021-2033
- 10.1. Market Analysis, Insights and Forecast - by Application
- 10.1.1. Traffic Management
- 10.1.2. Road Safety and Security
- 10.1.3. Parking Management
- 10.1.4. Public Transport
- 10.1.5. Automotive Telematics
- 10.1.6. Freight
- 10.1.7. Other Applications
- 10.2. Market Analysis, Insights and Forecast - by Product Type
- 10.2.1. Advanced Traveler Information Systems (ATIS)
- 10.2.2. Advanced Transportation Management Systems (ATMS)
- 10.2.3. Advanced Transportation Pricing Systems (ATPS)
- 10.2.4. Advanced Public Transportation Systems (APTS)
- 10.2.5. Cooperative Vehicle Systems
- 10.1. Market Analysis, Insights and Forecast - by Application
- 11. Latin America Smart Transportation Industry Analysis, Insights and Forecast, 2021-2033
- 11.1. Market Analysis, Insights and Forecast - by Application
- 11.1.1. Traffic Management
- 11.1.2. Road Safety and Security
- 11.1.3. Parking Management
- 11.1.4. Public Transport
- 11.1.5. Automotive Telematics
- 11.1.6. Freight
- 11.1.7. Other Applications
- 11.2. Market Analysis, Insights and Forecast - by Product Type
- 11.2.1. Advanced Traveler Information Systems (ATIS)
- 11.2.2. Advanced Transportation Management Systems (ATMS)
- 11.2.3. Advanced Transportation Pricing Systems (ATPS)
- 11.2.4. Advanced Public Transportation Systems (APTS)
- 11.2.5. Cooperative Vehicle Systems
- 11.1. Market Analysis, Insights and Forecast - by Application
- 12. Middle East and Africa Smart Transportation Industry Analysis, Insights and Forecast, 2021-2033
- 12.1. Market Analysis, Insights and Forecast - by Application
- 12.1.1. Traffic Management
- 12.1.2. Road Safety and Security
- 12.1.3. Parking Management
- 12.1.4. Public Transport
- 12.1.5. Automotive Telematics
- 12.1.6. Freight
- 12.1.7. Other Applications
- 12.2. Market Analysis, Insights and Forecast - by Product Type
- 12.2.1. Advanced Traveler Information Systems (ATIS)
- 12.2.2. Advanced Transportation Management Systems (ATMS)
- 12.2.3. Advanced Transportation Pricing Systems (ATPS)
- 12.2.4. Advanced Public Transportation Systems (APTS)
- 12.2.5. Cooperative Vehicle Systems
- 12.1. Market Analysis, Insights and Forecast - by Application
- 13. Competitive Analysis
- 13.1. Company Profiles
- 13.1.1 Orange SA
- 13.1.1.1. Company Overview
- 13.1.1.2. Products
- 13.1.1.3. Company Financials
- 13.1.1.4. SWOT Analysis
- 13.1.2 IBM Corporation
- 13.1.2.1. Company Overview
- 13.1.2.2. Products
- 13.1.2.3. Company Financials
- 13.1.2.4. SWOT Analysis
- 13.1.3 Alstom
- 13.1.3.1. Company Overview
- 13.1.3.2. Products
- 13.1.3.3. Company Financials
- 13.1.3.4. SWOT Analysis
- 13.1.4 Cisco Systems Inc
- 13.1.4.1. Company Overview
- 13.1.4.2. Products
- 13.1.4.3. Company Financials
- 13.1.4.4. SWOT Analysis
- 13.1.5 Siemens Corporation
- 13.1.5.1. Company Overview
- 13.1.5.2. Products
- 13.1.5.3. Company Financials
- 13.1.5.4. SWOT Analysis
- 13.1.6 AVEVA Group PLC
- 13.1.6.1. Company Overview
- 13.1.6.2. Products
- 13.1.6.3. Company Financials
- 13.1.6.4. SWOT Analysis
- 13.1.7 Huawei Technologies Co Ltd
- 13.1.7.1. Company Overview
- 13.1.7.2. Products
- 13.1.7.3. Company Financials
- 13.1.7.4. SWOT Analysis
- 13.1.8 Oracle Corporation
- 13.1.8.1. Company Overview
- 13.1.8.2. Products
- 13.1.8.3. Company Financials
- 13.1.8.4. SWOT Analysis
- 13.1.9 Hitachi Lt
- 13.1.9.1. Company Overview
- 13.1.9.2. Products
- 13.1.9.3. Company Financials
- 13.1.9.4. SWOT Analysis
- 13.1.10 Advantech Co Ltd
- 13.1.10.1. Company Overview
- 13.1.10.2. Products
- 13.1.10.3. Company Financials
- 13.1.10.4. SWOT Analysis
- 13.1.11 SAP SE
- 13.1.11.1. Company Overview
- 13.1.11.2. Products
- 13.1.11.3. Company Financials
- 13.1.11.4. SWOT Analysis
- 13.1.1 Orange SA
- 13.2. Market Entropy
- 13.2.1 Company's Key Areas Served
- 13.2.2 Recent Developments
- 13.3. Company Market Share Analysis 2025
- 13.3.1 Top 5 Companies Market Share Analysis
- 13.3.2 Top 3 Companies Market Share Analysis
- 13.4. List of Potential Customers
- 14. Research Methodology
List of Figures
- Figure 1: Global Smart Transportation Industry Revenue Breakdown (Million, %) by Region 2025 & 2033
- Figure 2: North America Smart Transportation Industry Revenue (Million), by Application 2025 & 2033
- Figure 3: North America Smart Transportation Industry Revenue Share (%), by Application 2025 & 2033
- Figure 4: North America Smart Transportation Industry Revenue (Million), by Product Type 2025 & 2033
- Figure 5: North America Smart Transportation Industry Revenue Share (%), by Product Type 2025 & 2033
- Figure 6: North America Smart Transportation Industry Revenue (Million), by Country 2025 & 2033
- Figure 7: North America Smart Transportation Industry Revenue Share (%), by Country 2025 & 2033
- Figure 8: Europe Smart Transportation Industry Revenue (Million), by Application 2025 & 2033
- Figure 9: Europe Smart Transportation Industry Revenue Share (%), by Application 2025 & 2033
- Figure 10: Europe Smart Transportation Industry Revenue (Million), by Product Type 2025 & 2033
- Figure 11: Europe Smart Transportation Industry Revenue Share (%), by Product Type 2025 & 2033
- Figure 12: Europe Smart Transportation Industry Revenue (Million), by Country 2025 & 2033
- Figure 13: Europe Smart Transportation Industry Revenue Share (%), by Country 2025 & 2033
- Figure 14: Asia Smart Transportation Industry Revenue (Million), by Application 2025 & 2033
- Figure 15: Asia Smart Transportation Industry Revenue Share (%), by Application 2025 & 2033
- Figure 16: Asia Smart Transportation Industry Revenue (Million), by Product Type 2025 & 2033
- Figure 17: Asia Smart Transportation Industry Revenue Share (%), by Product Type 2025 & 2033
- Figure 18: Asia Smart Transportation Industry Revenue (Million), by Country 2025 & 2033
- Figure 19: Asia Smart Transportation Industry Revenue Share (%), by Country 2025 & 2033
- Figure 20: Australia and New Zealand Smart Transportation Industry Revenue (Million), by Application 2025 & 2033
- Figure 21: Australia and New Zealand Smart Transportation Industry Revenue Share (%), by Application 2025 & 2033
- Figure 22: Australia and New Zealand Smart Transportation Industry Revenue (Million), by Product Type 2025 & 2033
- Figure 23: Australia and New Zealand Smart Transportation Industry Revenue Share (%), by Product Type 2025 & 2033
- Figure 24: Australia and New Zealand Smart Transportation Industry Revenue (Million), by Country 2025 & 2033
- Figure 25: Australia and New Zealand Smart Transportation Industry Revenue Share (%), by Country 2025 & 2033
- Figure 26: Latin America Smart Transportation Industry Revenue (Million), by Application 2025 & 2033
- Figure 27: Latin America Smart Transportation Industry Revenue Share (%), by Application 2025 & 2033
- Figure 28: Latin America Smart Transportation Industry Revenue (Million), by Product Type 2025 & 2033
- Figure 29: Latin America Smart Transportation Industry Revenue Share (%), by Product Type 2025 & 2033
- Figure 30: Latin America Smart Transportation Industry Revenue (Million), by Country 2025 & 2033
- Figure 31: Latin America Smart Transportation Industry Revenue Share (%), by Country 2025 & 2033
- Figure 32: Middle East and Africa Smart Transportation Industry Revenue (Million), by Application 2025 & 2033
- Figure 33: Middle East and Africa Smart Transportation Industry Revenue Share (%), by Application 2025 & 2033
- Figure 34: Middle East and Africa Smart Transportation Industry Revenue (Million), by Product Type 2025 & 2033
- Figure 35: Middle East and Africa Smart Transportation Industry Revenue Share (%), by Product Type 2025 & 2033
- Figure 36: Middle East and Africa Smart Transportation Industry Revenue (Million), by Country 2025 & 2033
- Figure 37: Middle East and Africa Smart Transportation Industry Revenue Share (%), by Country 2025 & 2033
List of Tables
- Table 1: Global Smart Transportation Industry Revenue Million Forecast, by Application 2020 & 2033
- Table 2: Global Smart Transportation Industry Revenue Million Forecast, by Product Type 2020 & 2033
- Table 3: Global Smart Transportation Industry Revenue Million Forecast, by Region 2020 & 2033
- Table 4: Global Smart Transportation Industry Revenue Million Forecast, by Application 2020 & 2033
- Table 5: Global Smart Transportation Industry Revenue Million Forecast, by Product Type 2020 & 2033
- Table 6: Global Smart Transportation Industry Revenue Million Forecast, by Country 2020 & 2033
- Table 7: United States Smart Transportation Industry Revenue (Million) Forecast, by Application 2020 & 2033
- Table 8: Canada Smart Transportation Industry Revenue (Million) Forecast, by Application 2020 & 2033
- Table 9: Global Smart Transportation Industry Revenue Million Forecast, by Application 2020 & 2033
- Table 10: Global Smart Transportation Industry Revenue Million Forecast, by Product Type 2020 & 2033
- Table 11: Global Smart Transportation Industry Revenue Million Forecast, by Country 2020 & 2033
- Table 12: United Kingdom Smart Transportation Industry Revenue (Million) Forecast, by Application 2020 & 2033
- Table 13: Germany Smart Transportation Industry Revenue (Million) Forecast, by Application 2020 & 2033
- Table 14: France Smart Transportation Industry Revenue (Million) Forecast, by Application 2020 & 2033
- Table 15: Global Smart Transportation Industry Revenue Million Forecast, by Application 2020 & 2033
- Table 16: Global Smart Transportation Industry Revenue Million Forecast, by Product Type 2020 & 2033
- Table 17: Global Smart Transportation Industry Revenue Million Forecast, by Country 2020 & 2033
- Table 18: China Smart Transportation Industry Revenue (Million) Forecast, by Application 2020 & 2033
- Table 19: Japan Smart Transportation Industry Revenue (Million) Forecast, by Application 2020 & 2033
- Table 20: Global Smart Transportation Industry Revenue Million Forecast, by Application 2020 & 2033
- Table 21: Global Smart Transportation Industry Revenue Million Forecast, by Product Type 2020 & 2033
- Table 22: Global Smart Transportation Industry Revenue Million Forecast, by Country 2020 & 2033
- Table 23: Global Smart Transportation Industry Revenue Million Forecast, by Application 2020 & 2033
- Table 24: Global Smart Transportation Industry Revenue Million Forecast, by Product Type 2020 & 2033
- Table 25: Global Smart Transportation Industry Revenue Million Forecast, by Country 2020 & 2033
- Table 26: Mexico Smart Transportation Industry Revenue (Million) Forecast, by Application 2020 & 2033
- Table 27: Brazil Smart Transportation Industry Revenue (Million) Forecast, by Application 2020 & 2033
- Table 28: Global Smart Transportation Industry Revenue Million Forecast, by Application 2020 & 2033
- Table 29: Global Smart Transportation Industry Revenue Million Forecast, by Product Type 2020 & 2033
- Table 30: Global Smart Transportation Industry Revenue Million Forecast, by Country 2020 & 2033
- Table 31: United Arab Emirates Smart Transportation Industry Revenue (Million) Forecast, by Application 2020 & 2033
- Table 32: South Africa Smart Transportation Industry Revenue (Million) Forecast, by Application 2020 & 2033
- Table 33: Saudi Arabia Smart Transportation Industry Revenue (Million) Forecast, by Application 2020 & 2033
Frequently Asked Questions
1. What is the projected Compound Annual Growth Rate (CAGR) of the Smart Transportation Industry?
The projected CAGR is approximately 6.79%.
2. Which companies are prominent players in the Smart Transportation Industry?
Key companies in the market include Orange SA, IBM Corporation, Alstom, Cisco Systems Inc, Siemens Corporation, AVEVA Group PLC, Huawei Technologies Co Ltd, Oracle Corporation, Hitachi Lt, Advantech Co Ltd, SAP SE.
3. What are the main segments of the Smart Transportation Industry?
The market segments include Application, Product Type.
4. Can you provide details about the market size?
The market size is estimated to be USD 33.38 Million as of 2022.
5. What are some drivers contributing to market growth?
Rise of Urbanization and Increasing Mega Cities and Increasing Population; Government Initiatives to Enhance the Transportation Infrastructure.
6. What are the notable trends driving market growth?
Rise of Urbanization. and Population would Drive the Market.
7. Are there any restraints impacting market growth?
High Capital Required for Deployment.
8. Can you provide examples of recent developments in the market?
November 2023 – Hitachi ZeroCarbon Ltd. has partnered with FirstGroup plc to lead the UK's shift to electric buses. The collaboration, which is part of FirstGroup's bus fleet and infrastructure decarbonisation programme, will provide batteries for First Bus's expanding electric bus fleet, helping to make a positive impact on air quality, tackle congestion and improve customer experience.
9. What pricing options are available for accessing the report?
Pricing options include single-user, multi-user, and enterprise licenses priced at USD 4750, USD 5250, and USD 8750 respectively.
10. Is the market size provided in terms of value or volume?
The market size is provided in terms of value, measured in Million.
11. Are there any specific market keywords associated with the report?
Yes, the market keyword associated with the report is "Smart Transportation Industry," which aids in identifying and referencing the specific market segment covered.
12. How do I determine which pricing option suits my needs best?
The pricing options vary based on user requirements and access needs. Individual users may opt for single-user licenses, while businesses requiring broader access may choose multi-user or enterprise licenses for cost-effective access to the report.
13. Are there any additional resources or data provided in the Smart Transportation Industry report?
While the report offers comprehensive insights, it's advisable to review the specific contents or supplementary materials provided to ascertain if additional resources or data are available.
14. How can I stay updated on further developments or reports in the Smart Transportation Industry?
To stay informed about further developments, trends, and reports in the Smart Transportation Industry, consider subscribing to industry newsletters, following relevant companies and organizations, or regularly checking reputable industry news sources and publications.
Methodology
Step 1 - Identification of Relevant Samples Size from Population Database


Step 2 - Approaches for Defining Global Market Size (Value, Volume* & Price*)

Note*: In applicable scenarios
Step 3 - Data Sources
Primary Research
- Web Analytics
- Survey Reports
- Research Institute
- Latest Research Reports
- Opinion Leaders
Secondary Research
- Annual Reports
- White Paper
- Latest Press Release
- Industry Association
- Paid Database
- Investor Presentations

Step 4 - Data Triangulation
Involves using different sources of information in order to increase the validity of a study
These sources are likely to be stakeholders in a program - participants, other researchers, program staff, other community members, and so on.
Then we put all data in single framework & apply various statistical tools to find out the dynamic on the market.
During the analysis stage, feedback from the stakeholder groups would be compared to determine areas of agreement as well as areas of divergence