


Key Insights
The global smart speaker market, valued at $14.83 billion in 2025, is projected to experience robust growth, driven by a compound annual growth rate (CAGR) of 10.3% from 2025 to 2033. This expansion is fueled by several key factors. Firstly, the increasing affordability and accessibility of smart speakers are making them a mainstream consumer product. Secondly, the continuous improvement in voice recognition technology and natural language processing (NLP) enhances user experience, leading to increased adoption. Thirdly, the integration of smart speakers into smart homes, providing centralized control of various devices and services, is a significant driver. Finally, the rise of virtual assistants and their expanding capabilities, including smart home management, entertainment, and information retrieval, further boosts market demand. Major players like Amazon, Google, Alibaba, Baidu, Xiaomi, and Apple are actively engaged in innovation and market expansion, contributing to this growth trajectory.
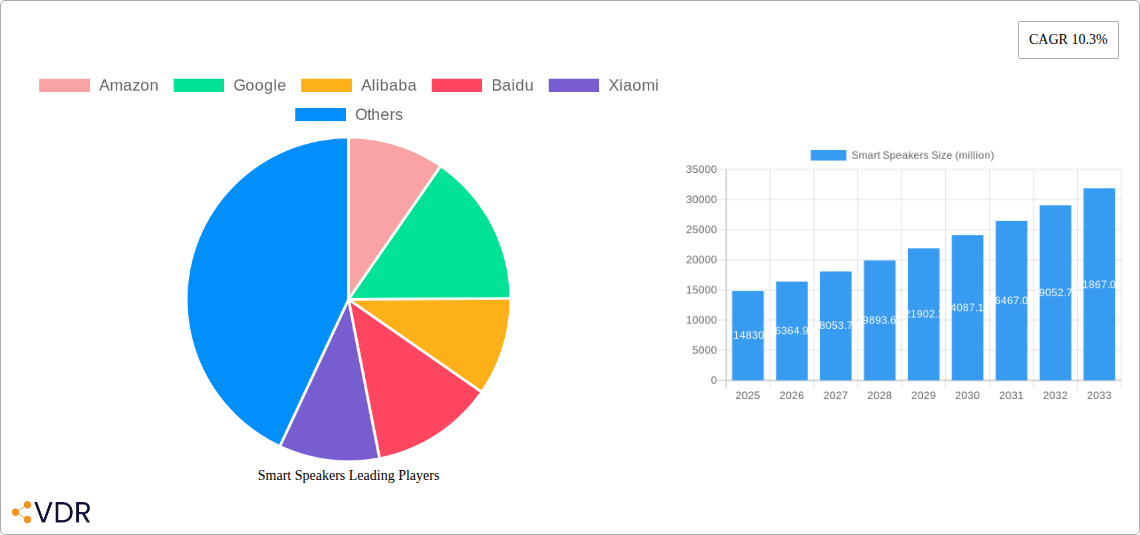
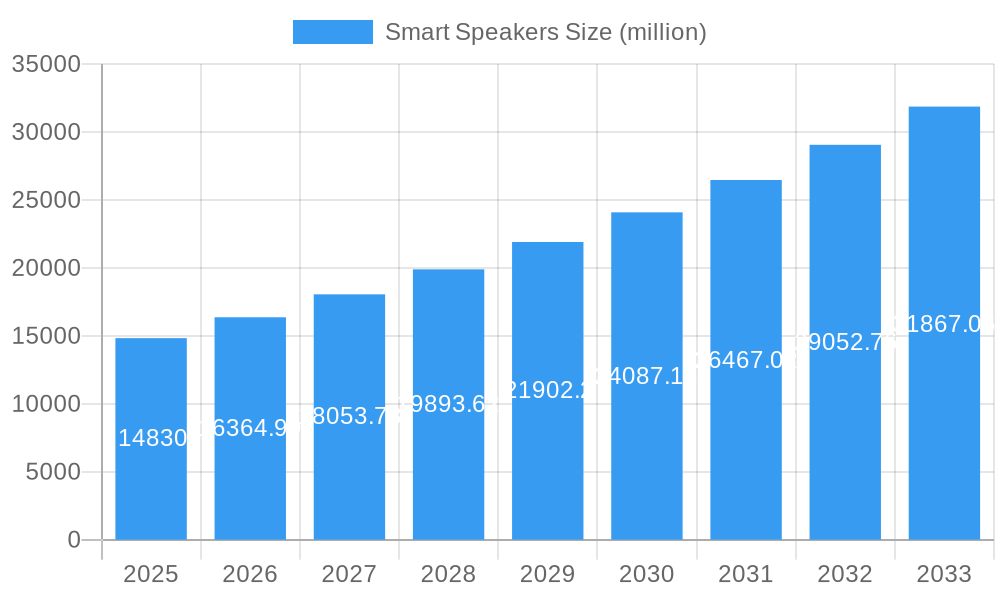
Smart Speakers Market Size (In Billion)

However, the market also faces certain challenges. Privacy concerns surrounding voice data collection and security vulnerabilities are significant restraints. Furthermore, the market's saturation in developed regions like North America and Europe might lead to slower growth in these areas compared to emerging markets in Asia and Latin America. Competition among major players is fierce, leading to pricing pressures. Nevertheless, the ongoing development of more sophisticated features, such as enhanced audio quality, improved integration with other smart devices, and personalized experiences, are expected to mitigate these challenges and sustain market growth in the long term. The increasing adoption of smart speakers in various sectors beyond the consumer market, including healthcare, education, and businesses, presents significant opportunities for future expansion.
Smart Speakers Company Market Share
Smart Speakers Market Report: 2019-2033
This comprehensive report provides an in-depth analysis of the global smart speakers market, encompassing historical data (2019-2024), the base year (2025), and a detailed forecast (2025-2033). We examine market dynamics, growth trends, regional dominance, product landscapes, and key players, offering invaluable insights for industry professionals, investors, and strategic decision-makers. The report leverages extensive primary and secondary research to deliver actionable intelligence across various segments and geographies. This analysis will cover the parent market of consumer electronics and the child market of voice-activated devices.
Smart Speakers Market Dynamics & Structure
The global smart speaker market, valued at xx million units in 2024, is characterized by intense competition and rapid technological advancements. Market concentration is high, with key players like Amazon, Google, Alibaba, Baidu, Xiaomi, and Apple dominating market share. Technological innovation, driven by advancements in voice recognition, AI, and connectivity, is a primary growth driver. Regulatory frameworks concerning data privacy and security are increasingly impacting market dynamics. Competitive substitutes include other smart home devices and traditional audio systems. End-user demographics are expanding, with increasing adoption across age groups and socioeconomic strata. M&A activity has been relatively moderate, focusing primarily on smaller companies specializing in niche technologies.
- Market Concentration: Highly concentrated, with top 6 players holding xx% of market share in 2024.
- Innovation Drivers: AI, Voice Recognition, IoT Integration, improved sound quality.
- Regulatory Frameworks: Data privacy regulations (GDPR, CCPA) impact data collection and usage.
- Competitive Substitutes: Traditional speakers, smart home hubs, smartphones with voice assistants.
- End-User Demographics: Expanding across age groups, income levels, and geographic regions.
- M&A Trends: Moderate activity, focusing on technology acquisitions rather than large-scale mergers. xx M&A deals recorded in 2024.
Smart Speakers Growth Trends & Insights
The global smart speaker market experienced significant growth during the historical period (2019-2024), driven by factors including decreasing prices, improved functionality, and increasing consumer awareness. The market is projected to continue its expansion, with a Compound Annual Growth Rate (CAGR) of xx% from 2025 to 2033, reaching xx million units by 2033. Adoption rates are highest in developed economies, but significant growth potential exists in emerging markets. Technological disruptions, such as advancements in multi-speaker communication and integration with smart home ecosystems, are accelerating market growth. Shifting consumer behavior towards voice-activated interfaces and the increasing demand for personalized experiences further fuel market expansion. Market penetration is expected to increase from xx% in 2025 to xx% in 2033.
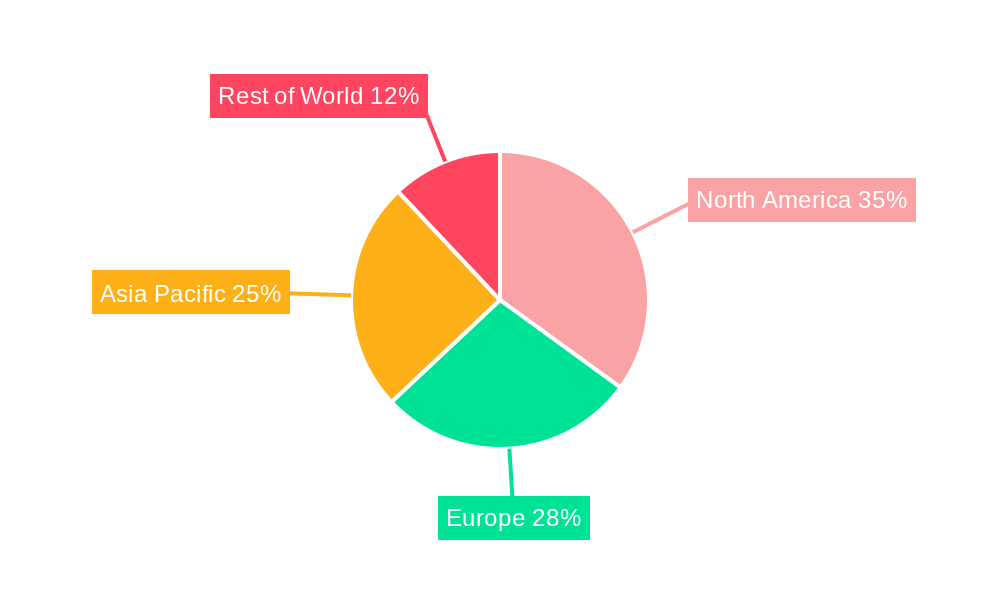
Dominant Regions, Countries, or Segments in Smart Speakers
North America (particularly the US) and Asia-Pacific (especially China) are the dominant regions, accounting for a combined xx% of the global market in 2024. The dominance of these regions is driven by factors such as high consumer spending power, advanced technological infrastructure, and the presence of major smart speaker manufacturers. China's significant growth is attributable to a large and rapidly growing middle class, increasing smartphone penetration, and supportive government policies promoting technological innovation.
- North America: High adoption rates, strong consumer electronics market, presence of major players.
- Asia-Pacific (China): Large consumer base, rapid technological advancements, government support for innovation.
- Europe: Growing market, driven by increasing adoption in Western European countries.
- Rest of the World: Significant growth potential, driven by increasing smartphone penetration and declining prices.
Smart Speakers Product Landscape
Smart speaker product innovation focuses on enhancing sound quality, integrating advanced AI capabilities, improving voice recognition accuracy, and expanding smart home compatibility. Product differentiation strategies include unique design aesthetics, specialized audio features, and integration with other smart home devices. Performance metrics like sound quality, battery life, and voice recognition accuracy are key considerations for consumers. The introduction of multi-room audio capabilities and advanced features like personalized music recommendations and hands-free calling are driving product innovation.
Key Drivers, Barriers & Challenges in Smart Speakers
Key Drivers: Increasing affordability, improved functionality, expanding smart home ecosystems, and growing consumer demand for voice-activated interfaces are propelling market growth. Advancements in AI and voice recognition are significantly enhancing the user experience. Government initiatives promoting digitalization in some regions are also contributing positively.
Key Challenges: Concerns around data privacy and security remain significant obstacles. Supply chain disruptions, particularly related to component shortages, can impact production and availability. Intense competition among established players leads to price wars and limits profit margins.
Emerging Opportunities in Smart Speakers
Untapped markets in developing economies represent substantial growth opportunities. Innovative applications, such as personalized education, healthcare, and entertainment experiences, are emerging. Growing consumer preference for seamless integration with other smart home devices fuels innovation. The integration of smart speakers into automotive systems and other specialized applications is also showing great promise.
Growth Accelerators in the Smart Speakers Industry
Technological breakthroughs in AI, voice recognition, and low-power consumption contribute significantly to long-term growth. Strategic partnerships between manufacturers and content providers expand product offerings. Market expansion strategies focusing on emerging markets and underserved segments, along with successful marketing and branding initiatives, are crucial for sustained growth.
Notable Milestones in Smart Speakers Sector
- 2014: Amazon launches the Amazon Echo, marking the beginning of the smart speaker revolution.
- 2016: Google Home is launched, intensifying competition in the market.
- 2017: Significant growth in smart speaker shipments globally.
- 2018: Increased focus on data privacy and security concerns.
- 2020: The COVID-19 pandemic accelerates the adoption of smart speakers for home entertainment and remote work.
- 2023: Advancements in AI capabilities lead to more personalized and context-aware user experiences.
In-Depth Smart Speakers Market Outlook
The smart speaker market is poised for continued strong growth, driven by technological innovations, expanding applications, and increasing consumer adoption. Strategic partnerships, expansion into new markets, and the development of innovative functionalities will create significant opportunities for market players. The focus on data privacy and security will remain crucial, influencing product development and market regulations. The long-term outlook is positive, with significant potential for market expansion and further technological advancement.
Smart Speakers Segmentation
-
1. Application
- 1.1. Online
- 1.2. Offline
-
2. Types
- 2.1. with Displays
- 2.2. without Displays
Smart Speakers Segmentation By Geography
-
1. North America
- 1.1. United States
- 1.2. Canada
- 1.3. Mexico
-
2. South America
- 2.1. Brazil
- 2.2. Argentina
- 2.3. Rest of South America
-
3. Europe
- 3.1. United Kingdom
- 3.2. Germany
- 3.3. France
- 3.4. Italy
- 3.5. Spain
- 3.6. Russia
- 3.7. Benelux
- 3.8. Nordics
- 3.9. Rest of Europe
-
4. Middle East & Africa
- 4.1. Turkey
- 4.2. Israel
- 4.3. GCC
- 4.4. North Africa
- 4.5. South Africa
- 4.6. Rest of Middle East & Africa
-
5. Asia Pacific
- 5.1. China
- 5.2. India
- 5.3. Japan
- 5.4. South Korea
- 5.5. ASEAN
- 5.6. Oceania
- 5.7. Rest of Asia Pacific
Smart Speakers Regional Market Share
Geographic Coverage of Smart Speakers
Smart Speakers REPORT HIGHLIGHTS
| Aspects | Details |
|---|---|
| Study Period | 2020-2034 |
| Base Year | 2025 |
| Estimated Year | 2026 |
| Forecast Period | 2026-2034 |
| Historical Period | 2020-2025 |
| Growth Rate | CAGR of 9.8% from 2020-2034 |
| Segmentation |
|
Table of Contents
- 1. Introduction
- 1.1. Research Scope
- 1.2. Market Segmentation
- 1.3. Research Methodology
- 1.4. Definitions and Assumptions
- 2. Executive Summary
- 2.1. Introduction
- 3. Market Dynamics
- 3.1. Introduction
- 3.2. Market Drivers
- 3.3. Market Restrains
- 3.4. Market Trends
- 4. Market Factor Analysis
- 4.1. Porters Five Forces
- 4.2. Supply/Value Chain
- 4.3. PESTEL analysis
- 4.4. Market Entropy
- 4.5. Patent/Trademark Analysis
- 5. Global Smart Speakers Analysis, Insights and Forecast, 2020-2032
- 5.1. Market Analysis, Insights and Forecast - by Application
- 5.1.1. Online
- 5.1.2. Offline
- 5.2. Market Analysis, Insights and Forecast - by Types
- 5.2.1. with Displays
- 5.2.2. without Displays
- 5.3. Market Analysis, Insights and Forecast - by Region
- 5.3.1. North America
- 5.3.2. South America
- 5.3.3. Europe
- 5.3.4. Middle East & Africa
- 5.3.5. Asia Pacific
- 5.1. Market Analysis, Insights and Forecast - by Application
- 6. North America Smart Speakers Analysis, Insights and Forecast, 2020-2032
- 6.1. Market Analysis, Insights and Forecast - by Application
- 6.1.1. Online
- 6.1.2. Offline
- 6.2. Market Analysis, Insights and Forecast - by Types
- 6.2.1. with Displays
- 6.2.2. without Displays
- 6.1. Market Analysis, Insights and Forecast - by Application
- 7. South America Smart Speakers Analysis, Insights and Forecast, 2020-2032
- 7.1. Market Analysis, Insights and Forecast - by Application
- 7.1.1. Online
- 7.1.2. Offline
- 7.2. Market Analysis, Insights and Forecast - by Types
- 7.2.1. with Displays
- 7.2.2. without Displays
- 7.1. Market Analysis, Insights and Forecast - by Application
- 8. Europe Smart Speakers Analysis, Insights and Forecast, 2020-2032
- 8.1. Market Analysis, Insights and Forecast - by Application
- 8.1.1. Online
- 8.1.2. Offline
- 8.2. Market Analysis, Insights and Forecast - by Types
- 8.2.1. with Displays
- 8.2.2. without Displays
- 8.1. Market Analysis, Insights and Forecast - by Application
- 9. Middle East & Africa Smart Speakers Analysis, Insights and Forecast, 2020-2032
- 9.1. Market Analysis, Insights and Forecast - by Application
- 9.1.1. Online
- 9.1.2. Offline
- 9.2. Market Analysis, Insights and Forecast - by Types
- 9.2.1. with Displays
- 9.2.2. without Displays
- 9.1. Market Analysis, Insights and Forecast - by Application
- 10. Asia Pacific Smart Speakers Analysis, Insights and Forecast, 2020-2032
- 10.1. Market Analysis, Insights and Forecast - by Application
- 10.1.1. Online
- 10.1.2. Offline
- 10.2. Market Analysis, Insights and Forecast - by Types
- 10.2.1. with Displays
- 10.2.2. without Displays
- 10.1. Market Analysis, Insights and Forecast - by Application
- 11. Competitive Analysis
- 11.1. Global Market Share Analysis 2025
- 11.2. Company Profiles
- 11.2.1 Amazon
- 11.2.1.1. Overview
- 11.2.1.2. Products
- 11.2.1.3. SWOT Analysis
- 11.2.1.4. Recent Developments
- 11.2.1.5. Financials (Based on Availability)
- 11.2.2 Google
- 11.2.2.1. Overview
- 11.2.2.2. Products
- 11.2.2.3. SWOT Analysis
- 11.2.2.4. Recent Developments
- 11.2.2.5. Financials (Based on Availability)
- 11.2.3 Alibaba
- 11.2.3.1. Overview
- 11.2.3.2. Products
- 11.2.3.3. SWOT Analysis
- 11.2.3.4. Recent Developments
- 11.2.3.5. Financials (Based on Availability)
- 11.2.4 Baidu
- 11.2.4.1. Overview
- 11.2.4.2. Products
- 11.2.4.3. SWOT Analysis
- 11.2.4.4. Recent Developments
- 11.2.4.5. Financials (Based on Availability)
- 11.2.5 Xiaomi
- 11.2.5.1. Overview
- 11.2.5.2. Products
- 11.2.5.3. SWOT Analysis
- 11.2.5.4. Recent Developments
- 11.2.5.5. Financials (Based on Availability)
- 11.2.6 Apple
- 11.2.6.1. Overview
- 11.2.6.2. Products
- 11.2.6.3. SWOT Analysis
- 11.2.6.4. Recent Developments
- 11.2.6.5. Financials (Based on Availability)
- 11.2.1 Amazon
List of Figures
- Figure 1: Global Smart Speakers Revenue Breakdown (undefined, %) by Region 2025 & 2033
- Figure 2: North America Smart Speakers Revenue (undefined), by Application 2025 & 2033
- Figure 3: North America Smart Speakers Revenue Share (%), by Application 2025 & 2033
- Figure 4: North America Smart Speakers Revenue (undefined), by Types 2025 & 2033
- Figure 5: North America Smart Speakers Revenue Share (%), by Types 2025 & 2033
- Figure 6: North America Smart Speakers Revenue (undefined), by Country 2025 & 2033
- Figure 7: North America Smart Speakers Revenue Share (%), by Country 2025 & 2033
- Figure 8: South America Smart Speakers Revenue (undefined), by Application 2025 & 2033
- Figure 9: South America Smart Speakers Revenue Share (%), by Application 2025 & 2033
- Figure 10: South America Smart Speakers Revenue (undefined), by Types 2025 & 2033
- Figure 11: South America Smart Speakers Revenue Share (%), by Types 2025 & 2033
- Figure 12: South America Smart Speakers Revenue (undefined), by Country 2025 & 2033
- Figure 13: South America Smart Speakers Revenue Share (%), by Country 2025 & 2033
- Figure 14: Europe Smart Speakers Revenue (undefined), by Application 2025 & 2033
- Figure 15: Europe Smart Speakers Revenue Share (%), by Application 2025 & 2033
- Figure 16: Europe Smart Speakers Revenue (undefined), by Types 2025 & 2033
- Figure 17: Europe Smart Speakers Revenue Share (%), by Types 2025 & 2033
- Figure 18: Europe Smart Speakers Revenue (undefined), by Country 2025 & 2033
- Figure 19: Europe Smart Speakers Revenue Share (%), by Country 2025 & 2033
- Figure 20: Middle East & Africa Smart Speakers Revenue (undefined), by Application 2025 & 2033
- Figure 21: Middle East & Africa Smart Speakers Revenue Share (%), by Application 2025 & 2033
- Figure 22: Middle East & Africa Smart Speakers Revenue (undefined), by Types 2025 & 2033
- Figure 23: Middle East & Africa Smart Speakers Revenue Share (%), by Types 2025 & 2033
- Figure 24: Middle East & Africa Smart Speakers Revenue (undefined), by Country 2025 & 2033
- Figure 25: Middle East & Africa Smart Speakers Revenue Share (%), by Country 2025 & 2033
- Figure 26: Asia Pacific Smart Speakers Revenue (undefined), by Application 2025 & 2033
- Figure 27: Asia Pacific Smart Speakers Revenue Share (%), by Application 2025 & 2033
- Figure 28: Asia Pacific Smart Speakers Revenue (undefined), by Types 2025 & 2033
- Figure 29: Asia Pacific Smart Speakers Revenue Share (%), by Types 2025 & 2033
- Figure 30: Asia Pacific Smart Speakers Revenue (undefined), by Country 2025 & 2033
- Figure 31: Asia Pacific Smart Speakers Revenue Share (%), by Country 2025 & 2033
List of Tables
- Table 1: Global Smart Speakers Revenue undefined Forecast, by Application 2020 & 2033
- Table 2: Global Smart Speakers Revenue undefined Forecast, by Types 2020 & 2033
- Table 3: Global Smart Speakers Revenue undefined Forecast, by Region 2020 & 2033
- Table 4: Global Smart Speakers Revenue undefined Forecast, by Application 2020 & 2033
- Table 5: Global Smart Speakers Revenue undefined Forecast, by Types 2020 & 2033
- Table 6: Global Smart Speakers Revenue undefined Forecast, by Country 2020 & 2033
- Table 7: United States Smart Speakers Revenue (undefined) Forecast, by Application 2020 & 2033
- Table 8: Canada Smart Speakers Revenue (undefined) Forecast, by Application 2020 & 2033
- Table 9: Mexico Smart Speakers Revenue (undefined) Forecast, by Application 2020 & 2033
- Table 10: Global Smart Speakers Revenue undefined Forecast, by Application 2020 & 2033
- Table 11: Global Smart Speakers Revenue undefined Forecast, by Types 2020 & 2033
- Table 12: Global Smart Speakers Revenue undefined Forecast, by Country 2020 & 2033
- Table 13: Brazil Smart Speakers Revenue (undefined) Forecast, by Application 2020 & 2033
- Table 14: Argentina Smart Speakers Revenue (undefined) Forecast, by Application 2020 & 2033
- Table 15: Rest of South America Smart Speakers Revenue (undefined) Forecast, by Application 2020 & 2033
- Table 16: Global Smart Speakers Revenue undefined Forecast, by Application 2020 & 2033
- Table 17: Global Smart Speakers Revenue undefined Forecast, by Types 2020 & 2033
- Table 18: Global Smart Speakers Revenue undefined Forecast, by Country 2020 & 2033
- Table 19: United Kingdom Smart Speakers Revenue (undefined) Forecast, by Application 2020 & 2033
- Table 20: Germany Smart Speakers Revenue (undefined) Forecast, by Application 2020 & 2033
- Table 21: France Smart Speakers Revenue (undefined) Forecast, by Application 2020 & 2033
- Table 22: Italy Smart Speakers Revenue (undefined) Forecast, by Application 2020 & 2033
- Table 23: Spain Smart Speakers Revenue (undefined) Forecast, by Application 2020 & 2033
- Table 24: Russia Smart Speakers Revenue (undefined) Forecast, by Application 2020 & 2033
- Table 25: Benelux Smart Speakers Revenue (undefined) Forecast, by Application 2020 & 2033
- Table 26: Nordics Smart Speakers Revenue (undefined) Forecast, by Application 2020 & 2033
- Table 27: Rest of Europe Smart Speakers Revenue (undefined) Forecast, by Application 2020 & 2033
- Table 28: Global Smart Speakers Revenue undefined Forecast, by Application 2020 & 2033
- Table 29: Global Smart Speakers Revenue undefined Forecast, by Types 2020 & 2033
- Table 30: Global Smart Speakers Revenue undefined Forecast, by Country 2020 & 2033
- Table 31: Turkey Smart Speakers Revenue (undefined) Forecast, by Application 2020 & 2033
- Table 32: Israel Smart Speakers Revenue (undefined) Forecast, by Application 2020 & 2033
- Table 33: GCC Smart Speakers Revenue (undefined) Forecast, by Application 2020 & 2033
- Table 34: North Africa Smart Speakers Revenue (undefined) Forecast, by Application 2020 & 2033
- Table 35: South Africa Smart Speakers Revenue (undefined) Forecast, by Application 2020 & 2033
- Table 36: Rest of Middle East & Africa Smart Speakers Revenue (undefined) Forecast, by Application 2020 & 2033
- Table 37: Global Smart Speakers Revenue undefined Forecast, by Application 2020 & 2033
- Table 38: Global Smart Speakers Revenue undefined Forecast, by Types 2020 & 2033
- Table 39: Global Smart Speakers Revenue undefined Forecast, by Country 2020 & 2033
- Table 40: China Smart Speakers Revenue (undefined) Forecast, by Application 2020 & 2033
- Table 41: India Smart Speakers Revenue (undefined) Forecast, by Application 2020 & 2033
- Table 42: Japan Smart Speakers Revenue (undefined) Forecast, by Application 2020 & 2033
- Table 43: South Korea Smart Speakers Revenue (undefined) Forecast, by Application 2020 & 2033
- Table 44: ASEAN Smart Speakers Revenue (undefined) Forecast, by Application 2020 & 2033
- Table 45: Oceania Smart Speakers Revenue (undefined) Forecast, by Application 2020 & 2033
- Table 46: Rest of Asia Pacific Smart Speakers Revenue (undefined) Forecast, by Application 2020 & 2033
Frequently Asked Questions
1. What is the projected Compound Annual Growth Rate (CAGR) of the Smart Speakers?
The projected CAGR is approximately 9.8%.
2. Which companies are prominent players in the Smart Speakers?
Key companies in the market include Amazon, Google, Alibaba, Baidu, Xiaomi, Apple.
3. What are the main segments of the Smart Speakers?
The market segments include Application, Types.
4. Can you provide details about the market size?
The market size is estimated to be USD XXX N/A as of 2022.
5. What are some drivers contributing to market growth?
N/A
6. What are the notable trends driving market growth?
N/A
7. Are there any restraints impacting market growth?
N/A
8. Can you provide examples of recent developments in the market?
N/A
9. What pricing options are available for accessing the report?
Pricing options include single-user, multi-user, and enterprise licenses priced at USD 2900.00, USD 4350.00, and USD 5800.00 respectively.
10. Is the market size provided in terms of value or volume?
The market size is provided in terms of value, measured in N/A.
11. Are there any specific market keywords associated with the report?
Yes, the market keyword associated with the report is "Smart Speakers," which aids in identifying and referencing the specific market segment covered.
12. How do I determine which pricing option suits my needs best?
The pricing options vary based on user requirements and access needs. Individual users may opt for single-user licenses, while businesses requiring broader access may choose multi-user or enterprise licenses for cost-effective access to the report.
13. Are there any additional resources or data provided in the Smart Speakers report?
While the report offers comprehensive insights, it's advisable to review the specific contents or supplementary materials provided to ascertain if additional resources or data are available.
14. How can I stay updated on further developments or reports in the Smart Speakers?
To stay informed about further developments, trends, and reports in the Smart Speakers, consider subscribing to industry newsletters, following relevant companies and organizations, or regularly checking reputable industry news sources and publications.
Methodology
Step 1 - Identification of Relevant Samples Size from Population Database


Step 2 - Approaches for Defining Global Market Size (Value, Volume* & Price*)

Note*: In applicable scenarios
Step 3 - Data Sources
Primary Research
- Web Analytics
- Survey Reports
- Research Institute
- Latest Research Reports
- Opinion Leaders
Secondary Research
- Annual Reports
- White Paper
- Latest Press Release
- Industry Association
- Paid Database
- Investor Presentations

Step 4 - Data Triangulation
Involves using different sources of information in order to increase the validity of a study
These sources are likely to be stakeholders in a program - participants, other researchers, program staff, other community members, and so on.
Then we put all data in single framework & apply various statistical tools to find out the dynamic on the market.
During the analysis stage, feedback from the stakeholder groups would be compared to determine areas of agreement as well as areas of divergence