

Key Insights
The global Smart Skin Analyzer market is poised for robust expansion, projected to reach a substantial $1.45 billion by 2025, fueled by a compelling Compound Annual Growth Rate (CAGR) of 13.5%. This dynamic growth is largely attributed to the escalating consumer demand for personalized skincare solutions and the increasing integration of advanced diagnostic tools within the beauty and healthcare sectors. The rising prevalence of skin conditions globally, coupled with growing awareness about early detection and preventative care, further propels the adoption of smart skin analyzers. Technological advancements, including the development of AI-powered analysis, high-resolution imaging, and portable devices, are democratizing access to sophisticated skin diagnostics, making them more accessible for both professional use and at-home applications. The market's expansion is also supported by increasing investments in research and development by key industry players, aiming to enhance the accuracy and user-friendliness of these devices.
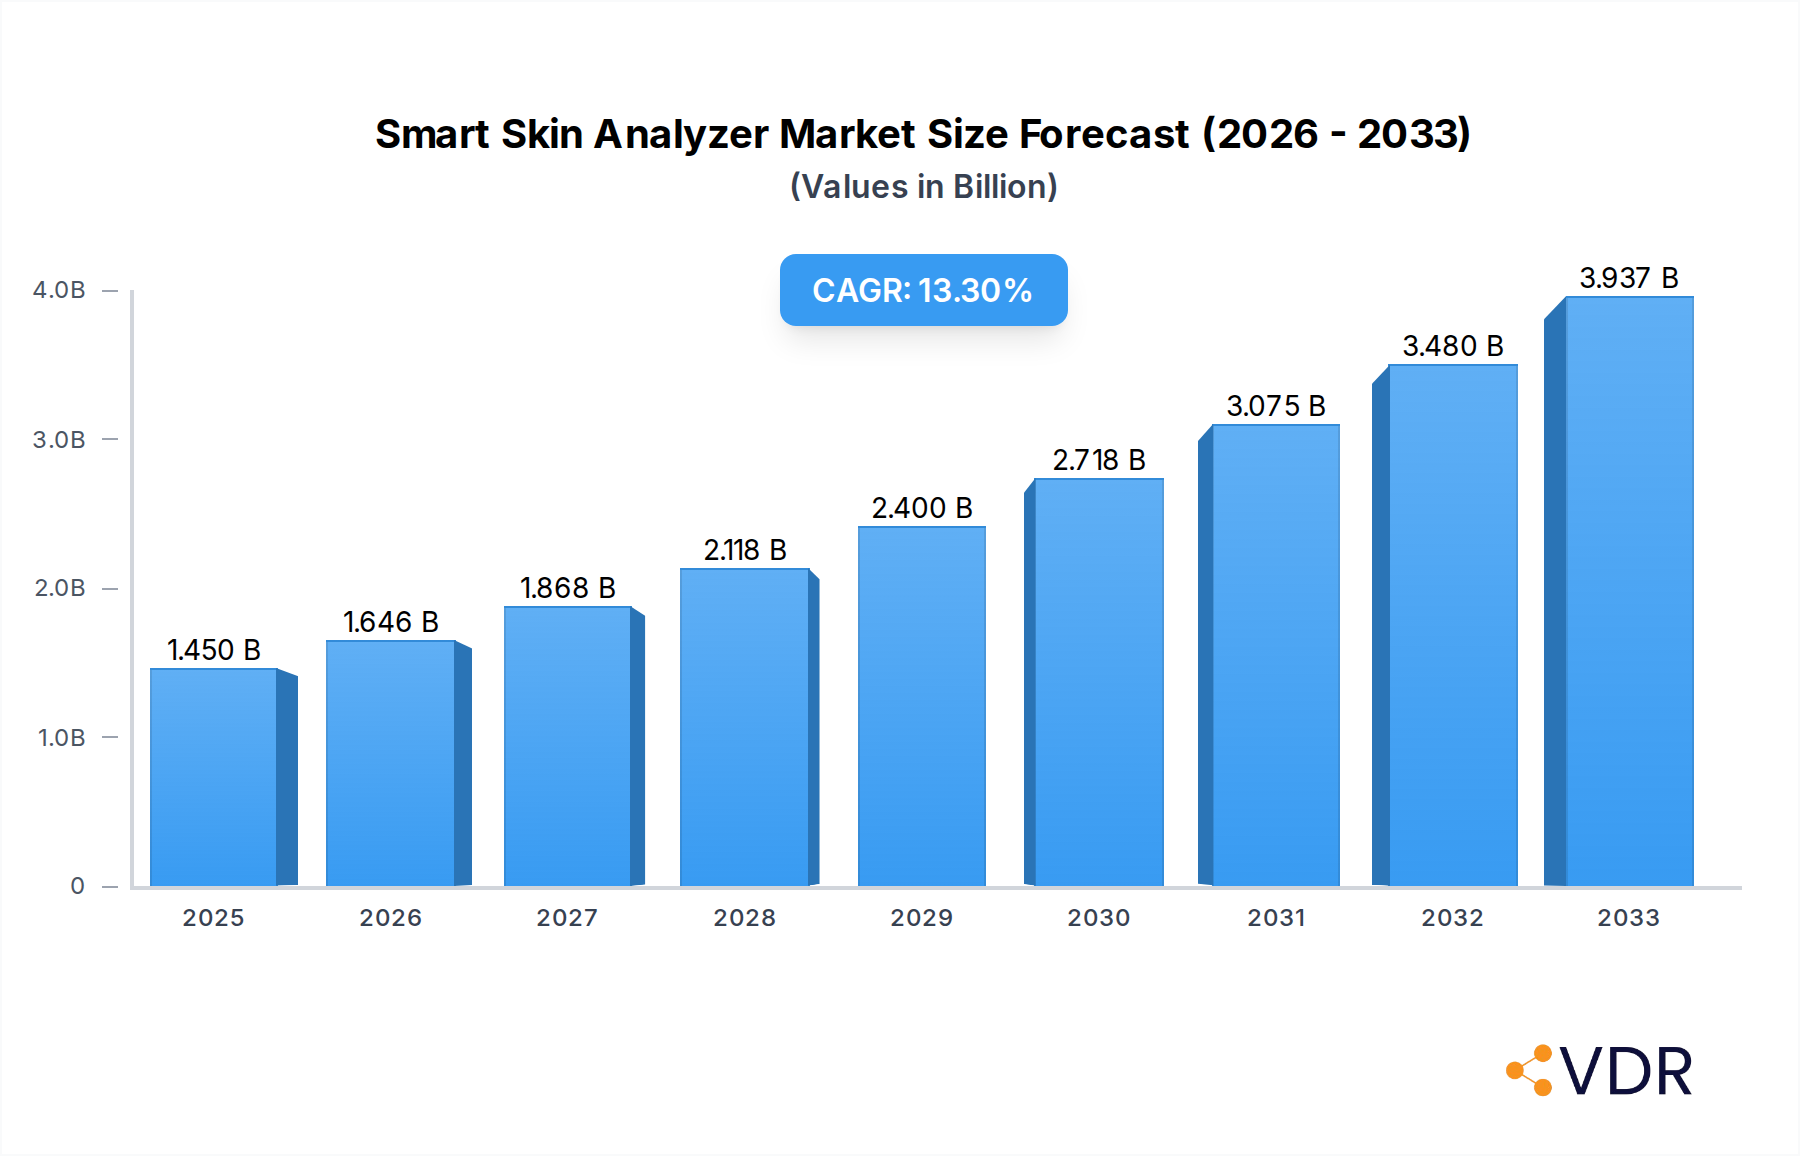
Smart Skin Analyzer Market Size (In Billion)
The market's growth trajectory is further shaped by emerging trends such as the increasing demand for remote skin consultations and the integration of smart skin analyzers with e-commerce platforms, enabling virtual skin assessments and tailored product recommendations. While the market enjoys significant growth drivers, certain restraints, such as the initial high cost of sophisticated devices and the need for specialized training for optimal utilization, may pose moderate challenges. However, the expanding applications across clinics, hospitals, and beauty salons, alongside the increasing preference for portable devices, indicate a diversified and resilient market outlook. The competitive landscape features a mix of established players and emerging innovators, all vying to capture market share through product differentiation, strategic partnerships, and a focus on delivering data-driven, personalized skincare experiences.

Smart Skin Analyzer Company Market Share
Smart Skin Analyzer Market Dynamics & Structure
The global smart skin analyzer market is characterized by a moderately concentrated landscape, with leading players like Canfield Scientific, Cortex, and Courage+Khazaka Electronic holding significant market share. Technological innovation serves as a primary driver, fueled by advancements in AI-powered diagnostics, advanced imaging sensors, and data analytics. Regulatory frameworks, particularly those concerning medical device certifications and data privacy, play a crucial role in shaping market entry and product development. Competitive product substitutes, such as traditional dermatological examination tools and less advanced imaging devices, exist but are increasingly being outpaced by the precision and analytical capabilities of smart skin analyzers. End-user demographics are expanding beyond clinical settings to include a growing segment of beauty salons and direct-to-consumer applications, driven by an increasing consumer awareness of skin health and personalized beauty solutions. Mergers and acquisitions (M&A) activity is moderately prevalent, with larger companies acquiring innovative startups to bolster their product portfolios and market reach.
- Market Concentration: Moderately concentrated, with key players dominating innovation and sales.
- Technological Innovation Drivers: AI, advanced imaging, data analytics, cloud integration.
- Regulatory Frameworks: FDA, CE Mark, GDPR influencing product design and data handling.
- Competitive Substitutes: Traditional dermoscopes, basic camera-based analysis tools.
- End-User Demographics: Dermatologists, estheticians, spa owners, and increasingly, consumers.
- M&A Trends: Strategic acquisitions by established players to gain technological edge and market share.
Smart Skin Analyzer Growth Trends & Insights
The smart skin analyzer market is poised for robust expansion, driven by a confluence of technological advancements, increasing consumer demand for personalized skincare, and growing applications across various sectors. The market size is projected to witness significant growth from approximately $1.2 billion in 2024 to an estimated $3.5 billion by 2033, exhibiting a Compound Annual Growth Rate (CAGR) of 11.5% during the forecast period. This substantial growth is underpinned by evolving consumer behavior, where individuals are becoming more proactive about skin health and seeking data-driven insights for tailored treatment plans. The adoption rates of smart skin analyzers are steadily increasing in clinics and hospitals due to their ability to enhance diagnostic accuracy, improve treatment efficacy, and streamline patient consultations. Furthermore, the burgeoning beauty and wellness industry is a significant contributor, with beauty salons integrating these devices to offer advanced skin analysis services, thereby differentiating themselves and attracting a discerning clientele.
Technological disruptions are at the forefront of this market's evolution. The integration of Artificial Intelligence (AI) and Machine Learning (ML) algorithms is enabling smart skin analyzers to provide more sophisticated analyses, detecting subtle skin imperfections, predicting future skin conditions, and recommending personalized product regimens. The development of portable and user-friendly devices is further democratizing access, allowing for wider adoption beyond specialized medical facilities. Consumer awareness regarding the benefits of early detection and personalized care for conditions like acne, aging, and hyperpigmentation is a key demand driver. The shift towards preventative healthcare and the increasing interest in anti-aging solutions are creating a fertile ground for smart skin analyzers. Moreover, the growing accessibility of these devices, coupled with the increasing availability of data insights, empowers both professionals and consumers to make more informed decisions about skin health. The study period from 2019 to 2033, with a base year of 2025, encompasses a critical phase of innovation and market penetration. The historical period (2019-2024) laid the groundwork for current growth, with estimated year 2025 marking a significant inflection point. The forecast period (2025-2033) is expected to witness sustained high growth, driven by continuous technological advancements and expanding market applications.
Dominant Regions, Countries, or Segments in Smart Skin Analyzer
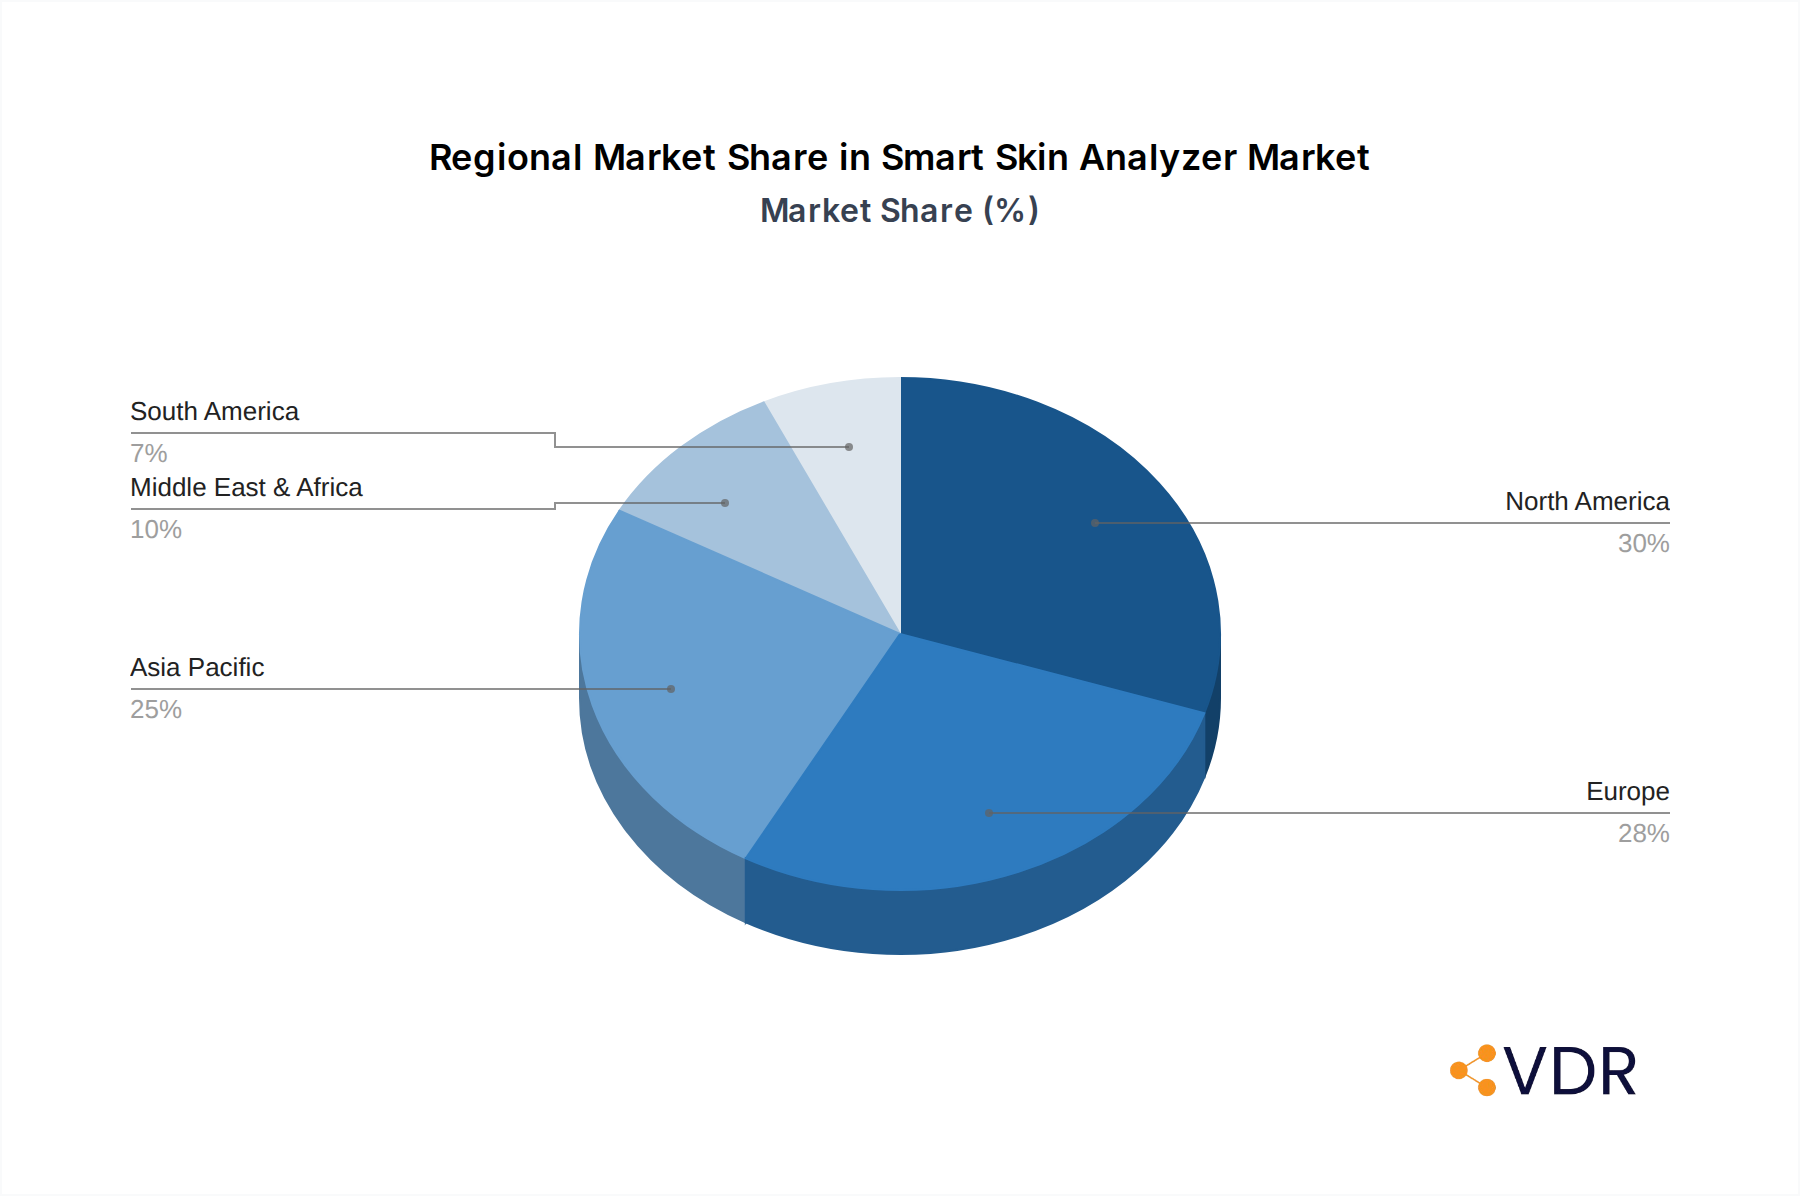
North America currently stands as the dominant region in the global smart skin analyzer market, driven by a sophisticated healthcare infrastructure, high consumer spending on beauty and wellness, and a strong emphasis on technological adoption. The United States is a key contributor, boasting a large number of dermatology clinics, hospitals, and a well-established network of beauty salons that are early adopters of advanced skincare technologies. The presence of major market players and a conducive regulatory environment further bolsters its leadership. The market share for North America is estimated to be around 35% in 2025, with a projected growth rate consistent with the global CAGR.
Within the Application segment, Clinics represent the largest and most influential market. Dermatologists and aesthetic practitioners in clinics leverage smart skin analyzers for precise diagnosis, treatment planning, and monitoring patient progress. The ability of these devices to provide objective data, quantify skin parameters, and track changes over time makes them indispensable tools for clinical practice. The clinic segment is estimated to account for approximately 40% of the total market revenue in 2025. Hospitals are also significant users, integrating these devices into their dermatology departments for enhanced diagnostic capabilities and patient care.
Considering the Types segment, Portable smart skin analyzers are experiencing rapid growth and are projected to capture a substantial market share, estimated to reach around 60% by 2033. Their portability offers unparalleled flexibility, allowing professionals to conduct analyses in various settings, including remote consultations, home visits, and during events. This convenience, coupled with decreasing form factors and increasing accuracy, is driving their widespread adoption in beauty salons and even among consumers, further expanding the market reach. Stationary devices, while still crucial for specialized settings like research labs and large hospitals, are seeing a slower growth trajectory compared to their portable counterparts.
Key drivers for North America's dominance include significant investments in R&D for AI-powered dermatological tools, favorable reimbursement policies for advanced diagnostic procedures, and a highly informed consumer base demanding personalized skincare solutions. Government initiatives promoting digital health and preventative care also contribute to market expansion. The established network of distributors and resellers ensures efficient market penetration and accessibility of these advanced devices across the region.
Smart Skin Analyzer Product Landscape
The smart skin analyzer product landscape is characterized by continuous innovation, focusing on enhanced accuracy, user-friendliness, and integrated analytical capabilities. Devices now incorporate advanced imaging technologies such as high-resolution cameras, multi-spectral imaging, and even 3D scanning to capture detailed skin topography and subsurface conditions. AI-powered algorithms are increasingly being embedded to automatically detect and classify common skin concerns like wrinkles, pigmentation, pores, and acne with remarkable precision. Unique selling propositions include real-time feedback, personalized treatment recommendations, and digital tracking of skin health progression over time. Technological advancements are also leading to smaller, more portable form factors, making these analyzers accessible for a wider range of applications beyond traditional clinical settings.
Key Drivers, Barriers & Challenges in Smart Skin Analyzer
Key Drivers:
- Increasing Consumer Awareness: Growing public understanding of skin health and the benefits of personalized skincare solutions.
- Technological Advancements: Rapid development in AI, imaging technology, and data analytics enhancing diagnostic precision and capabilities.
- Demand for Personalized Skincare: Consumers seeking tailored treatments and product recommendations based on objective skin analysis.
- Rising Incidence of Skin Conditions: An increasing global prevalence of dermatological issues like acne, aging, and hyperpigmentation.
- Expansion of Beauty and Wellness Industry: Growing adoption by beauty salons and spas to offer premium, data-driven services.
Barriers & Challenges:
- High Initial Cost: The significant investment required for advanced smart skin analyzers can be a barrier for smaller businesses and individual practitioners.
- Regulatory Hurdles: Obtaining necessary certifications and approvals for medical devices can be a complex and time-consuming process.
- Data Privacy and Security Concerns: Handling sensitive patient skin data requires robust security measures and compliance with privacy regulations.
- Need for Skilled Professionals: Effective utilization of smart skin analyzers requires trained personnel capable of interpreting the complex data generated.
- Market Saturation in Specific Niches: Certain segments, particularly in advanced aesthetics, may experience increasing competition.
Emerging Opportunities in Smart Skin Analyzer
Emerging opportunities lie in the expansion of direct-to-consumer (DTC) smart skin analyzer devices, empowering individuals with personalized insights for at-home skincare routines. The integration of smart skin analysis with teledermatology platforms presents a significant opportunity to enhance remote patient monitoring and consultations, extending healthcare access. Furthermore, the application of these analyzers in specialized fields like clinical trials for new dermatological treatments and the development of AI-driven predictive models for long-term skin health are promising avenues. Untapped markets in developing economies, where awareness of advanced skincare is growing, also offer substantial potential for market penetration with more affordable and user-friendly solutions.
Growth Accelerators in the Smart Skin Analyzer Industry
Technological breakthroughs in miniaturized sensor technology and the increasing sophistication of AI algorithms are significant growth accelerators. Strategic partnerships between smart skin analyzer manufacturers and skincare brands are fostering co-developed solutions that integrate device analytics with product recommendations, creating a comprehensive ecosystem. Market expansion strategies, including the development of cloud-based platforms for data management and remote analysis, are further fueling growth by enhancing accessibility and collaboration. The increasing investment in digital health initiatives by governments and private entities also provides a conducive environment for the widespread adoption of smart skin analyzers.
Key Players Shaping the Smart Skin Analyzer Market
- Callegari
- DJM Medical Instrument
- SkinLabs
- Cortex
- Michelson
- Canfield Scientific
- Courage Khazaka Electronic
- DermoScan
- Magnosco
- Bomtech Electronics
- CHOWIS Co.,Ltd.
- Coskin
- Dermalifeusa
- DermaQuip
- Gadelius
- Nera Solutions
- Opatra
- Zemits
Notable Milestones in Smart Skin Analyzer Sector
- 2019: Launch of advanced AI-powered diagnostic algorithms by several leading companies, enhancing predictive capabilities.
- 2020: Increased adoption of portable smart skin analyzers in beauty salons driven by consumer demand for personalized consultations.
- 2021: Significant advancements in multi-spectral imaging technology, allowing for deeper skin layer analysis.
- 2022: Emergence of cloud-based data management platforms, facilitating remote collaboration and data sharing among professionals.
- 2023: Growing integration of smart skin analyzers with teledermatology services to expand remote patient care.
- 2024: Introduction of more affordable and user-friendly smart skin analyzer models targeting the direct-to-consumer market.
In-Depth Smart Skin Analyzer Market Outlook
The future outlook for the smart skin analyzer market is exceptionally promising, driven by sustained innovation and expanding applications. Growth accelerators such as the continued evolution of AI for hyper-personalized diagnostics and the integration with augmented reality (AR) for visualizing treatment outcomes will be pivotal. Strategic partnerships between device manufacturers, cosmetic brands, and healthcare providers will further solidify the market's ecosystem. The increasing focus on preventative healthcare and the growing demand for scientifically-backed skincare solutions will ensure robust market penetration across clinics, hospitals, and the rapidly growing beauty salon segment. Untapped regions and the potential for home-use smart skin analysis devices present significant avenues for future expansion, indicating a dynamic and expanding market landscape.
Smart Skin Analyzer Segmentation
-
1. Application
- 1.1. Clinic
- 1.2. Hospital
- 1.3. Beauty Salon
- 1.4. Others
-
2. Types
- 2.1. Portable
- 2.2. Stationary
Smart Skin Analyzer Segmentation By Geography
-
1. North America
- 1.1. United States
- 1.2. Canada
- 1.3. Mexico
-
2. South America
- 2.1. Brazil
- 2.2. Argentina
- 2.3. Rest of South America
-
3. Europe
- 3.1. United Kingdom
- 3.2. Germany
- 3.3. France
- 3.4. Italy
- 3.5. Spain
- 3.6. Russia
- 3.7. Benelux
- 3.8. Nordics
- 3.9. Rest of Europe
-
4. Middle East & Africa
- 4.1. Turkey
- 4.2. Israel
- 4.3. GCC
- 4.4. North Africa
- 4.5. South Africa
- 4.6. Rest of Middle East & Africa
-
5. Asia Pacific
- 5.1. China
- 5.2. India
- 5.3. Japan
- 5.4. South Korea
- 5.5. ASEAN
- 5.6. Oceania
- 5.7. Rest of Asia Pacific
Smart Skin Analyzer Regional Market Share
Geographic Coverage of Smart Skin Analyzer
Smart Skin Analyzer REPORT HIGHLIGHTS
| Aspects | Details |
|---|---|
| Study Period | 2020-2034 |
| Base Year | 2025 |
| Estimated Year | 2026 |
| Forecast Period | 2026-2034 |
| Historical Period | 2020-2025 |
| Growth Rate | CAGR of 13.5% from 2020-2034 |
| Segmentation |
|
Table of Contents
- 1. Introduction
- 1.1. Research Scope
- 1.2. Market Segmentation
- 1.3. Research Methodology
- 1.4. Definitions and Assumptions
- 2. Executive Summary
- 2.1. Introduction
- 3. Market Dynamics
- 3.1. Introduction
- 3.2. Market Drivers
- 3.3. Market Restrains
- 3.4. Market Trends
- 4. Market Factor Analysis
- 4.1. Porters Five Forces
- 4.2. Supply/Value Chain
- 4.3. PESTEL analysis
- 4.4. Market Entropy
- 4.5. Patent/Trademark Analysis
- 5. Global Smart Skin Analyzer Analysis, Insights and Forecast, 2020-2032
- 5.1. Market Analysis, Insights and Forecast - by Application
- 5.1.1. Clinic
- 5.1.2. Hospital
- 5.1.3. Beauty Salon
- 5.1.4. Others
- 5.2. Market Analysis, Insights and Forecast - by Types
- 5.2.1. Portable
- 5.2.2. Stationary
- 5.3. Market Analysis, Insights and Forecast - by Region
- 5.3.1. North America
- 5.3.2. South America
- 5.3.3. Europe
- 5.3.4. Middle East & Africa
- 5.3.5. Asia Pacific
- 5.1. Market Analysis, Insights and Forecast - by Application
- 6. North America Smart Skin Analyzer Analysis, Insights and Forecast, 2020-2032
- 6.1. Market Analysis, Insights and Forecast - by Application
- 6.1.1. Clinic
- 6.1.2. Hospital
- 6.1.3. Beauty Salon
- 6.1.4. Others
- 6.2. Market Analysis, Insights and Forecast - by Types
- 6.2.1. Portable
- 6.2.2. Stationary
- 6.1. Market Analysis, Insights and Forecast - by Application
- 7. South America Smart Skin Analyzer Analysis, Insights and Forecast, 2020-2032
- 7.1. Market Analysis, Insights and Forecast - by Application
- 7.1.1. Clinic
- 7.1.2. Hospital
- 7.1.3. Beauty Salon
- 7.1.4. Others
- 7.2. Market Analysis, Insights and Forecast - by Types
- 7.2.1. Portable
- 7.2.2. Stationary
- 7.1. Market Analysis, Insights and Forecast - by Application
- 8. Europe Smart Skin Analyzer Analysis, Insights and Forecast, 2020-2032
- 8.1. Market Analysis, Insights and Forecast - by Application
- 8.1.1. Clinic
- 8.1.2. Hospital
- 8.1.3. Beauty Salon
- 8.1.4. Others
- 8.2. Market Analysis, Insights and Forecast - by Types
- 8.2.1. Portable
- 8.2.2. Stationary
- 8.1. Market Analysis, Insights and Forecast - by Application
- 9. Middle East & Africa Smart Skin Analyzer Analysis, Insights and Forecast, 2020-2032
- 9.1. Market Analysis, Insights and Forecast - by Application
- 9.1.1. Clinic
- 9.1.2. Hospital
- 9.1.3. Beauty Salon
- 9.1.4. Others
- 9.2. Market Analysis, Insights and Forecast - by Types
- 9.2.1. Portable
- 9.2.2. Stationary
- 9.1. Market Analysis, Insights and Forecast - by Application
- 10. Asia Pacific Smart Skin Analyzer Analysis, Insights and Forecast, 2020-2032
- 10.1. Market Analysis, Insights and Forecast - by Application
- 10.1.1. Clinic
- 10.1.2. Hospital
- 10.1.3. Beauty Salon
- 10.1.4. Others
- 10.2. Market Analysis, Insights and Forecast - by Types
- 10.2.1. Portable
- 10.2.2. Stationary
- 10.1. Market Analysis, Insights and Forecast - by Application
- 11. Competitive Analysis
- 11.1. Global Market Share Analysis 2025
- 11.2. Company Profiles
- 11.2.1 Callegari
- 11.2.1.1. Overview
- 11.2.1.2. Products
- 11.2.1.3. SWOT Analysis
- 11.2.1.4. Recent Developments
- 11.2.1.5. Financials (Based on Availability)
- 11.2.2 DJM Medical Instrument
- 11.2.2.1. Overview
- 11.2.2.2. Products
- 11.2.2.3. SWOT Analysis
- 11.2.2.4. Recent Developments
- 11.2.2.5. Financials (Based on Availability)
- 11.2.3 SkinLabs
- 11.2.3.1. Overview
- 11.2.3.2. Products
- 11.2.3.3. SWOT Analysis
- 11.2.3.4. Recent Developments
- 11.2.3.5. Financials (Based on Availability)
- 11.2.4 Cortex
- 11.2.4.1. Overview
- 11.2.4.2. Products
- 11.2.4.3. SWOT Analysis
- 11.2.4.4. Recent Developments
- 11.2.4.5. Financials (Based on Availability)
- 11.2.5 Michelson
- 11.2.5.1. Overview
- 11.2.5.2. Products
- 11.2.5.3. SWOT Analysis
- 11.2.5.4. Recent Developments
- 11.2.5.5. Financials (Based on Availability)
- 11.2.6 Canfield Scientific
- 11.2.6.1. Overview
- 11.2.6.2. Products
- 11.2.6.3. SWOT Analysis
- 11.2.6.4. Recent Developments
- 11.2.6.5. Financials (Based on Availability)
- 11.2.7 Courage Khazaka Electronic
- 11.2.7.1. Overview
- 11.2.7.2. Products
- 11.2.7.3. SWOT Analysis
- 11.2.7.4. Recent Developments
- 11.2.7.5. Financials (Based on Availability)
- 11.2.8 DermoScan
- 11.2.8.1. Overview
- 11.2.8.2. Products
- 11.2.8.3. SWOT Analysis
- 11.2.8.4. Recent Developments
- 11.2.8.5. Financials (Based on Availability)
- 11.2.9 Magnosco
- 11.2.9.1. Overview
- 11.2.9.2. Products
- 11.2.9.3. SWOT Analysis
- 11.2.9.4. Recent Developments
- 11.2.9.5. Financials (Based on Availability)
- 11.2.10 Bomtech Electronics
- 11.2.10.1. Overview
- 11.2.10.2. Products
- 11.2.10.3. SWOT Analysis
- 11.2.10.4. Recent Developments
- 11.2.10.5. Financials (Based on Availability)
- 11.2.11 CHOWIS Co.,Ltd.
- 11.2.11.1. Overview
- 11.2.11.2. Products
- 11.2.11.3. SWOT Analysis
- 11.2.11.4. Recent Developments
- 11.2.11.5. Financials (Based on Availability)
- 11.2.12 Coskin
- 11.2.12.1. Overview
- 11.2.12.2. Products
- 11.2.12.3. SWOT Analysis
- 11.2.12.4. Recent Developments
- 11.2.12.5. Financials (Based on Availability)
- 11.2.13 Dermalifeusa
- 11.2.13.1. Overview
- 11.2.13.2. Products
- 11.2.13.3. SWOT Analysis
- 11.2.13.4. Recent Developments
- 11.2.13.5. Financials (Based on Availability)
- 11.2.14 DermaQuip
- 11.2.14.1. Overview
- 11.2.14.2. Products
- 11.2.14.3. SWOT Analysis
- 11.2.14.4. Recent Developments
- 11.2.14.5. Financials (Based on Availability)
- 11.2.15 Gadelius
- 11.2.15.1. Overview
- 11.2.15.2. Products
- 11.2.15.3. SWOT Analysis
- 11.2.15.4. Recent Developments
- 11.2.15.5. Financials (Based on Availability)
- 11.2.16 Nera Solutions
- 11.2.16.1. Overview
- 11.2.16.2. Products
- 11.2.16.3. SWOT Analysis
- 11.2.16.4. Recent Developments
- 11.2.16.5. Financials (Based on Availability)
- 11.2.17 Opatra
- 11.2.17.1. Overview
- 11.2.17.2. Products
- 11.2.17.3. SWOT Analysis
- 11.2.17.4. Recent Developments
- 11.2.17.5. Financials (Based on Availability)
- 11.2.18 Zemits
- 11.2.18.1. Overview
- 11.2.18.2. Products
- 11.2.18.3. SWOT Analysis
- 11.2.18.4. Recent Developments
- 11.2.18.5. Financials (Based on Availability)
- 11.2.1 Callegari
List of Figures
- Figure 1: Global Smart Skin Analyzer Revenue Breakdown (billion, %) by Region 2025 & 2033
- Figure 2: Global Smart Skin Analyzer Volume Breakdown (K, %) by Region 2025 & 2033
- Figure 3: North America Smart Skin Analyzer Revenue (billion), by Application 2025 & 2033
- Figure 4: North America Smart Skin Analyzer Volume (K), by Application 2025 & 2033
- Figure 5: North America Smart Skin Analyzer Revenue Share (%), by Application 2025 & 2033
- Figure 6: North America Smart Skin Analyzer Volume Share (%), by Application 2025 & 2033
- Figure 7: North America Smart Skin Analyzer Revenue (billion), by Types 2025 & 2033
- Figure 8: North America Smart Skin Analyzer Volume (K), by Types 2025 & 2033
- Figure 9: North America Smart Skin Analyzer Revenue Share (%), by Types 2025 & 2033
- Figure 10: North America Smart Skin Analyzer Volume Share (%), by Types 2025 & 2033
- Figure 11: North America Smart Skin Analyzer Revenue (billion), by Country 2025 & 2033
- Figure 12: North America Smart Skin Analyzer Volume (K), by Country 2025 & 2033
- Figure 13: North America Smart Skin Analyzer Revenue Share (%), by Country 2025 & 2033
- Figure 14: North America Smart Skin Analyzer Volume Share (%), by Country 2025 & 2033
- Figure 15: South America Smart Skin Analyzer Revenue (billion), by Application 2025 & 2033
- Figure 16: South America Smart Skin Analyzer Volume (K), by Application 2025 & 2033
- Figure 17: South America Smart Skin Analyzer Revenue Share (%), by Application 2025 & 2033
- Figure 18: South America Smart Skin Analyzer Volume Share (%), by Application 2025 & 2033
- Figure 19: South America Smart Skin Analyzer Revenue (billion), by Types 2025 & 2033
- Figure 20: South America Smart Skin Analyzer Volume (K), by Types 2025 & 2033
- Figure 21: South America Smart Skin Analyzer Revenue Share (%), by Types 2025 & 2033
- Figure 22: South America Smart Skin Analyzer Volume Share (%), by Types 2025 & 2033
- Figure 23: South America Smart Skin Analyzer Revenue (billion), by Country 2025 & 2033
- Figure 24: South America Smart Skin Analyzer Volume (K), by Country 2025 & 2033
- Figure 25: South America Smart Skin Analyzer Revenue Share (%), by Country 2025 & 2033
- Figure 26: South America Smart Skin Analyzer Volume Share (%), by Country 2025 & 2033
- Figure 27: Europe Smart Skin Analyzer Revenue (billion), by Application 2025 & 2033
- Figure 28: Europe Smart Skin Analyzer Volume (K), by Application 2025 & 2033
- Figure 29: Europe Smart Skin Analyzer Revenue Share (%), by Application 2025 & 2033
- Figure 30: Europe Smart Skin Analyzer Volume Share (%), by Application 2025 & 2033
- Figure 31: Europe Smart Skin Analyzer Revenue (billion), by Types 2025 & 2033
- Figure 32: Europe Smart Skin Analyzer Volume (K), by Types 2025 & 2033
- Figure 33: Europe Smart Skin Analyzer Revenue Share (%), by Types 2025 & 2033
- Figure 34: Europe Smart Skin Analyzer Volume Share (%), by Types 2025 & 2033
- Figure 35: Europe Smart Skin Analyzer Revenue (billion), by Country 2025 & 2033
- Figure 36: Europe Smart Skin Analyzer Volume (K), by Country 2025 & 2033
- Figure 37: Europe Smart Skin Analyzer Revenue Share (%), by Country 2025 & 2033
- Figure 38: Europe Smart Skin Analyzer Volume Share (%), by Country 2025 & 2033
- Figure 39: Middle East & Africa Smart Skin Analyzer Revenue (billion), by Application 2025 & 2033
- Figure 40: Middle East & Africa Smart Skin Analyzer Volume (K), by Application 2025 & 2033
- Figure 41: Middle East & Africa Smart Skin Analyzer Revenue Share (%), by Application 2025 & 2033
- Figure 42: Middle East & Africa Smart Skin Analyzer Volume Share (%), by Application 2025 & 2033
- Figure 43: Middle East & Africa Smart Skin Analyzer Revenue (billion), by Types 2025 & 2033
- Figure 44: Middle East & Africa Smart Skin Analyzer Volume (K), by Types 2025 & 2033
- Figure 45: Middle East & Africa Smart Skin Analyzer Revenue Share (%), by Types 2025 & 2033
- Figure 46: Middle East & Africa Smart Skin Analyzer Volume Share (%), by Types 2025 & 2033
- Figure 47: Middle East & Africa Smart Skin Analyzer Revenue (billion), by Country 2025 & 2033
- Figure 48: Middle East & Africa Smart Skin Analyzer Volume (K), by Country 2025 & 2033
- Figure 49: Middle East & Africa Smart Skin Analyzer Revenue Share (%), by Country 2025 & 2033
- Figure 50: Middle East & Africa Smart Skin Analyzer Volume Share (%), by Country 2025 & 2033
- Figure 51: Asia Pacific Smart Skin Analyzer Revenue (billion), by Application 2025 & 2033
- Figure 52: Asia Pacific Smart Skin Analyzer Volume (K), by Application 2025 & 2033
- Figure 53: Asia Pacific Smart Skin Analyzer Revenue Share (%), by Application 2025 & 2033
- Figure 54: Asia Pacific Smart Skin Analyzer Volume Share (%), by Application 2025 & 2033
- Figure 55: Asia Pacific Smart Skin Analyzer Revenue (billion), by Types 2025 & 2033
- Figure 56: Asia Pacific Smart Skin Analyzer Volume (K), by Types 2025 & 2033
- Figure 57: Asia Pacific Smart Skin Analyzer Revenue Share (%), by Types 2025 & 2033
- Figure 58: Asia Pacific Smart Skin Analyzer Volume Share (%), by Types 2025 & 2033
- Figure 59: Asia Pacific Smart Skin Analyzer Revenue (billion), by Country 2025 & 2033
- Figure 60: Asia Pacific Smart Skin Analyzer Volume (K), by Country 2025 & 2033
- Figure 61: Asia Pacific Smart Skin Analyzer Revenue Share (%), by Country 2025 & 2033
- Figure 62: Asia Pacific Smart Skin Analyzer Volume Share (%), by Country 2025 & 2033
List of Tables
- Table 1: Global Smart Skin Analyzer Revenue billion Forecast, by Application 2020 & 2033
- Table 2: Global Smart Skin Analyzer Volume K Forecast, by Application 2020 & 2033
- Table 3: Global Smart Skin Analyzer Revenue billion Forecast, by Types 2020 & 2033
- Table 4: Global Smart Skin Analyzer Volume K Forecast, by Types 2020 & 2033
- Table 5: Global Smart Skin Analyzer Revenue billion Forecast, by Region 2020 & 2033
- Table 6: Global Smart Skin Analyzer Volume K Forecast, by Region 2020 & 2033
- Table 7: Global Smart Skin Analyzer Revenue billion Forecast, by Application 2020 & 2033
- Table 8: Global Smart Skin Analyzer Volume K Forecast, by Application 2020 & 2033
- Table 9: Global Smart Skin Analyzer Revenue billion Forecast, by Types 2020 & 2033
- Table 10: Global Smart Skin Analyzer Volume K Forecast, by Types 2020 & 2033
- Table 11: Global Smart Skin Analyzer Revenue billion Forecast, by Country 2020 & 2033
- Table 12: Global Smart Skin Analyzer Volume K Forecast, by Country 2020 & 2033
- Table 13: United States Smart Skin Analyzer Revenue (billion) Forecast, by Application 2020 & 2033
- Table 14: United States Smart Skin Analyzer Volume (K) Forecast, by Application 2020 & 2033
- Table 15: Canada Smart Skin Analyzer Revenue (billion) Forecast, by Application 2020 & 2033
- Table 16: Canada Smart Skin Analyzer Volume (K) Forecast, by Application 2020 & 2033
- Table 17: Mexico Smart Skin Analyzer Revenue (billion) Forecast, by Application 2020 & 2033
- Table 18: Mexico Smart Skin Analyzer Volume (K) Forecast, by Application 2020 & 2033
- Table 19: Global Smart Skin Analyzer Revenue billion Forecast, by Application 2020 & 2033
- Table 20: Global Smart Skin Analyzer Volume K Forecast, by Application 2020 & 2033
- Table 21: Global Smart Skin Analyzer Revenue billion Forecast, by Types 2020 & 2033
- Table 22: Global Smart Skin Analyzer Volume K Forecast, by Types 2020 & 2033
- Table 23: Global Smart Skin Analyzer Revenue billion Forecast, by Country 2020 & 2033
- Table 24: Global Smart Skin Analyzer Volume K Forecast, by Country 2020 & 2033
- Table 25: Brazil Smart Skin Analyzer Revenue (billion) Forecast, by Application 2020 & 2033
- Table 26: Brazil Smart Skin Analyzer Volume (K) Forecast, by Application 2020 & 2033
- Table 27: Argentina Smart Skin Analyzer Revenue (billion) Forecast, by Application 2020 & 2033
- Table 28: Argentina Smart Skin Analyzer Volume (K) Forecast, by Application 2020 & 2033
- Table 29: Rest of South America Smart Skin Analyzer Revenue (billion) Forecast, by Application 2020 & 2033
- Table 30: Rest of South America Smart Skin Analyzer Volume (K) Forecast, by Application 2020 & 2033
- Table 31: Global Smart Skin Analyzer Revenue billion Forecast, by Application 2020 & 2033
- Table 32: Global Smart Skin Analyzer Volume K Forecast, by Application 2020 & 2033
- Table 33: Global Smart Skin Analyzer Revenue billion Forecast, by Types 2020 & 2033
- Table 34: Global Smart Skin Analyzer Volume K Forecast, by Types 2020 & 2033
- Table 35: Global Smart Skin Analyzer Revenue billion Forecast, by Country 2020 & 2033
- Table 36: Global Smart Skin Analyzer Volume K Forecast, by Country 2020 & 2033
- Table 37: United Kingdom Smart Skin Analyzer Revenue (billion) Forecast, by Application 2020 & 2033
- Table 38: United Kingdom Smart Skin Analyzer Volume (K) Forecast, by Application 2020 & 2033
- Table 39: Germany Smart Skin Analyzer Revenue (billion) Forecast, by Application 2020 & 2033
- Table 40: Germany Smart Skin Analyzer Volume (K) Forecast, by Application 2020 & 2033
- Table 41: France Smart Skin Analyzer Revenue (billion) Forecast, by Application 2020 & 2033
- Table 42: France Smart Skin Analyzer Volume (K) Forecast, by Application 2020 & 2033
- Table 43: Italy Smart Skin Analyzer Revenue (billion) Forecast, by Application 2020 & 2033
- Table 44: Italy Smart Skin Analyzer Volume (K) Forecast, by Application 2020 & 2033
- Table 45: Spain Smart Skin Analyzer Revenue (billion) Forecast, by Application 2020 & 2033
- Table 46: Spain Smart Skin Analyzer Volume (K) Forecast, by Application 2020 & 2033
- Table 47: Russia Smart Skin Analyzer Revenue (billion) Forecast, by Application 2020 & 2033
- Table 48: Russia Smart Skin Analyzer Volume (K) Forecast, by Application 2020 & 2033
- Table 49: Benelux Smart Skin Analyzer Revenue (billion) Forecast, by Application 2020 & 2033
- Table 50: Benelux Smart Skin Analyzer Volume (K) Forecast, by Application 2020 & 2033
- Table 51: Nordics Smart Skin Analyzer Revenue (billion) Forecast, by Application 2020 & 2033
- Table 52: Nordics Smart Skin Analyzer Volume (K) Forecast, by Application 2020 & 2033
- Table 53: Rest of Europe Smart Skin Analyzer Revenue (billion) Forecast, by Application 2020 & 2033
- Table 54: Rest of Europe Smart Skin Analyzer Volume (K) Forecast, by Application 2020 & 2033
- Table 55: Global Smart Skin Analyzer Revenue billion Forecast, by Application 2020 & 2033
- Table 56: Global Smart Skin Analyzer Volume K Forecast, by Application 2020 & 2033
- Table 57: Global Smart Skin Analyzer Revenue billion Forecast, by Types 2020 & 2033
- Table 58: Global Smart Skin Analyzer Volume K Forecast, by Types 2020 & 2033
- Table 59: Global Smart Skin Analyzer Revenue billion Forecast, by Country 2020 & 2033
- Table 60: Global Smart Skin Analyzer Volume K Forecast, by Country 2020 & 2033
- Table 61: Turkey Smart Skin Analyzer Revenue (billion) Forecast, by Application 2020 & 2033
- Table 62: Turkey Smart Skin Analyzer Volume (K) Forecast, by Application 2020 & 2033
- Table 63: Israel Smart Skin Analyzer Revenue (billion) Forecast, by Application 2020 & 2033
- Table 64: Israel Smart Skin Analyzer Volume (K) Forecast, by Application 2020 & 2033
- Table 65: GCC Smart Skin Analyzer Revenue (billion) Forecast, by Application 2020 & 2033
- Table 66: GCC Smart Skin Analyzer Volume (K) Forecast, by Application 2020 & 2033
- Table 67: North Africa Smart Skin Analyzer Revenue (billion) Forecast, by Application 2020 & 2033
- Table 68: North Africa Smart Skin Analyzer Volume (K) Forecast, by Application 2020 & 2033
- Table 69: South Africa Smart Skin Analyzer Revenue (billion) Forecast, by Application 2020 & 2033
- Table 70: South Africa Smart Skin Analyzer Volume (K) Forecast, by Application 2020 & 2033
- Table 71: Rest of Middle East & Africa Smart Skin Analyzer Revenue (billion) Forecast, by Application 2020 & 2033
- Table 72: Rest of Middle East & Africa Smart Skin Analyzer Volume (K) Forecast, by Application 2020 & 2033
- Table 73: Global Smart Skin Analyzer Revenue billion Forecast, by Application 2020 & 2033
- Table 74: Global Smart Skin Analyzer Volume K Forecast, by Application 2020 & 2033
- Table 75: Global Smart Skin Analyzer Revenue billion Forecast, by Types 2020 & 2033
- Table 76: Global Smart Skin Analyzer Volume K Forecast, by Types 2020 & 2033
- Table 77: Global Smart Skin Analyzer Revenue billion Forecast, by Country 2020 & 2033
- Table 78: Global Smart Skin Analyzer Volume K Forecast, by Country 2020 & 2033
- Table 79: China Smart Skin Analyzer Revenue (billion) Forecast, by Application 2020 & 2033
- Table 80: China Smart Skin Analyzer Volume (K) Forecast, by Application 2020 & 2033
- Table 81: India Smart Skin Analyzer Revenue (billion) Forecast, by Application 2020 & 2033
- Table 82: India Smart Skin Analyzer Volume (K) Forecast, by Application 2020 & 2033
- Table 83: Japan Smart Skin Analyzer Revenue (billion) Forecast, by Application 2020 & 2033
- Table 84: Japan Smart Skin Analyzer Volume (K) Forecast, by Application 2020 & 2033
- Table 85: South Korea Smart Skin Analyzer Revenue (billion) Forecast, by Application 2020 & 2033
- Table 86: South Korea Smart Skin Analyzer Volume (K) Forecast, by Application 2020 & 2033
- Table 87: ASEAN Smart Skin Analyzer Revenue (billion) Forecast, by Application 2020 & 2033
- Table 88: ASEAN Smart Skin Analyzer Volume (K) Forecast, by Application 2020 & 2033
- Table 89: Oceania Smart Skin Analyzer Revenue (billion) Forecast, by Application 2020 & 2033
- Table 90: Oceania Smart Skin Analyzer Volume (K) Forecast, by Application 2020 & 2033
- Table 91: Rest of Asia Pacific Smart Skin Analyzer Revenue (billion) Forecast, by Application 2020 & 2033
- Table 92: Rest of Asia Pacific Smart Skin Analyzer Volume (K) Forecast, by Application 2020 & 2033
Frequently Asked Questions
1. What is the projected Compound Annual Growth Rate (CAGR) of the Smart Skin Analyzer?
The projected CAGR is approximately 13.5%.
2. Which companies are prominent players in the Smart Skin Analyzer?
Key companies in the market include Callegari, DJM Medical Instrument, SkinLabs, Cortex, Michelson, Canfield Scientific, Courage Khazaka Electronic, DermoScan, Magnosco, Bomtech Electronics, CHOWIS Co.,Ltd., Coskin, Dermalifeusa, DermaQuip, Gadelius, Nera Solutions, Opatra, Zemits.
3. What are the main segments of the Smart Skin Analyzer?
The market segments include Application, Types.
4. Can you provide details about the market size?
The market size is estimated to be USD 1.45 billion as of 2022.
5. What are some drivers contributing to market growth?
N/A
6. What are the notable trends driving market growth?
N/A
7. Are there any restraints impacting market growth?
N/A
8. Can you provide examples of recent developments in the market?
N/A
9. What pricing options are available for accessing the report?
Pricing options include single-user, multi-user, and enterprise licenses priced at USD 3350.00, USD 5025.00, and USD 6700.00 respectively.
10. Is the market size provided in terms of value or volume?
The market size is provided in terms of value, measured in billion and volume, measured in K.
11. Are there any specific market keywords associated with the report?
Yes, the market keyword associated with the report is "Smart Skin Analyzer," which aids in identifying and referencing the specific market segment covered.
12. How do I determine which pricing option suits my needs best?
The pricing options vary based on user requirements and access needs. Individual users may opt for single-user licenses, while businesses requiring broader access may choose multi-user or enterprise licenses for cost-effective access to the report.
13. Are there any additional resources or data provided in the Smart Skin Analyzer report?
While the report offers comprehensive insights, it's advisable to review the specific contents or supplementary materials provided to ascertain if additional resources or data are available.
14. How can I stay updated on further developments or reports in the Smart Skin Analyzer?
To stay informed about further developments, trends, and reports in the Smart Skin Analyzer, consider subscribing to industry newsletters, following relevant companies and organizations, or regularly checking reputable industry news sources and publications.
Methodology
Step 1 - Identification of Relevant Samples Size from Population Database


Step 2 - Approaches for Defining Global Market Size (Value, Volume* & Price*)

Note*: In applicable scenarios
Step 3 - Data Sources
Primary Research
- Web Analytics
- Survey Reports
- Research Institute
- Latest Research Reports
- Opinion Leaders
Secondary Research
- Annual Reports
- White Paper
- Latest Press Release
- Industry Association
- Paid Database
- Investor Presentations

Step 4 - Data Triangulation
Involves using different sources of information in order to increase the validity of a study
These sources are likely to be stakeholders in a program - participants, other researchers, program staff, other community members, and so on.
Then we put all data in single framework & apply various statistical tools to find out the dynamic on the market.
During the analysis stage, feedback from the stakeholder groups would be compared to determine areas of agreement as well as areas of divergence