

Key Insights
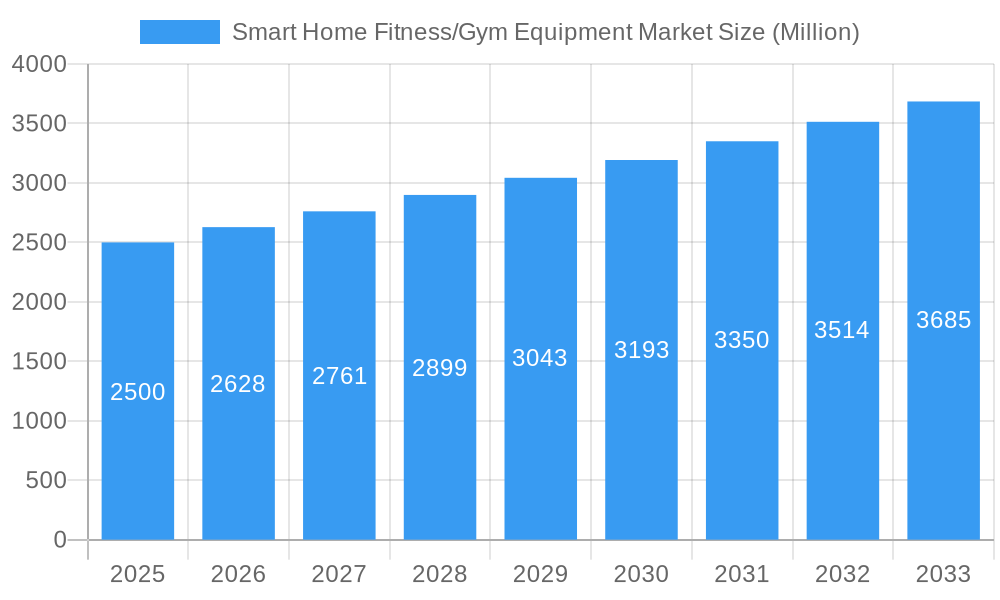
The global smart home fitness/gym equipment market, valued at $2.5 billion in 2025, is projected to experience robust growth, driven by several key factors. The increasing prevalence of sedentary lifestyles, coupled with a rising awareness of health and wellness, fuels consumer demand for convenient and engaging home workout solutions. Technological advancements, such as interactive fitness apps, AI-powered personal training, and gamified workout experiences, are significantly enhancing the user experience and driving market expansion. The convenience of working out at home, eliminating travel time and gym membership fees, also contributes to the market's appeal. Furthermore, the market is segmented by product type (cardiovascular and strength training equipment) and distribution channel (supermarkets/hypermarkets, specialized stores, and online platforms), with online sales expected to see particularly strong growth due to increased e-commerce penetration and targeted digital marketing campaigns. The competitive landscape includes established players like Peloton and Life Fitness, along with innovative startups focusing on technological integration. Geographic growth will be diverse, with North America and Europe maintaining strong market shares, but the Asia-Pacific region showing significant potential due to rising disposable incomes and increased health consciousness in developing economies. While supply chain disruptions and the potential for technological obsolescence present challenges, the overall outlook for the smart home fitness market remains exceptionally positive.
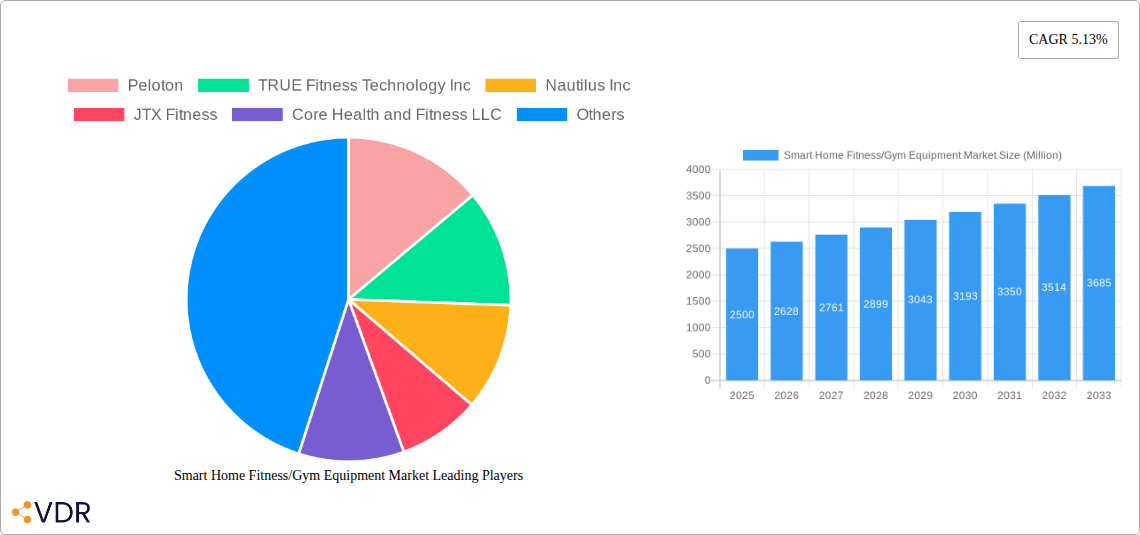
Smart Home Fitness/Gym Equipment Market Market Size (In Billion)
The market's 5.13% CAGR suggests a steady and sustained growth trajectory over the forecast period (2025-2033). This growth is expected to be fuelled by continuous innovation in fitness technology, personalized workout experiences, and integration with popular health and wellness apps. While the initial investment in smart home equipment can be higher compared to traditional gym memberships, the long-term cost-effectiveness and convenience are expected to drive adoption. Furthermore, the increasing accessibility of financing options and subscription models is expected to make smart home fitness equipment more affordable and accessible to a wider consumer base. The market's segmentation allows for targeted product development and marketing strategies, catering to diverse consumer preferences and fitness goals. However, successful market penetration will require manufacturers to address consumer concerns regarding data privacy and equipment durability to maintain trust and build lasting brand loyalty.
Smart Home Fitness/Gym Equipment Market Company Market Share
Smart Home Fitness/Gym Equipment Market Report: 2019-2033
This comprehensive report provides an in-depth analysis of the Smart Home Fitness/Gym Equipment market, encompassing market dynamics, growth trends, regional analysis, product landscape, and key players. The study period covers 2019-2033, with a base year of 2025 and a forecast period of 2025-2033. The historical period analyzed is 2019-2024. This report is crucial for industry professionals, investors, and strategists seeking a clear understanding of this rapidly evolving market segment, a parent market within the broader fitness equipment industry and a child market within the smart home technology sector. Market values are presented in million units.
Smart Home Fitness/Gym Equipment Market Dynamics & Structure
The smart home fitness equipment market is characterized by a moderately concentrated landscape, with key players like Peloton, ICON Health & Fitness, and Technogym holding significant market share. Technological innovation, particularly in areas like AI-powered coaching, virtual reality integration, and connected fitness platforms, is a major driver of growth. Regulatory frameworks concerning data privacy and product safety play a crucial role. Competitive substitutes include traditional gym memberships and outdoor fitness activities. End-user demographics are shifting towards a more health-conscious and tech-savvy population, further fueling market expansion. The market has witnessed several significant M&A activities in recent years, reflecting the industry’s consolidation trend.
- Market Concentration: Top 5 players hold approximately xx% market share in 2025.
- Technological Innovation: Focus on AI-powered personalized workouts, VR integration, and gamification.
- Regulatory Landscape: Growing focus on data privacy regulations and product safety standards.
- Competitive Substitutes: Traditional gyms, outdoor activities, and other home fitness solutions.
- End-User Demographics: Increasing adoption among millennials and Gen Z, driven by health consciousness and convenience.
- M&A Trends: xx major M&A deals were recorded between 2019 and 2024, with an average deal value of xx million units.
Smart Home Fitness/Gym Equipment Market Growth Trends & Insights
The global smart home fitness/gym equipment market is experiencing robust growth, driven by increasing health awareness, the convenience of home workouts, and technological advancements. The market size is projected to reach xx million units by 2033, exhibiting a CAGR of xx% during the forecast period. Adoption rates are increasing significantly, particularly in developed regions, and technological disruptions, such as the introduction of interactive fitness mirrors and AI-powered training programs, are accelerating market expansion. Consumer behavior shifts towards personalized fitness experiences and the integration of fitness into daily routines are also contributing to the market’s growth. Market penetration is expected to reach xx% by 2033. The shift towards hybrid models that combine in-home workouts with community aspects is another observed trend, evident in partnerships such as Peloton and Lululemon's collaboration.
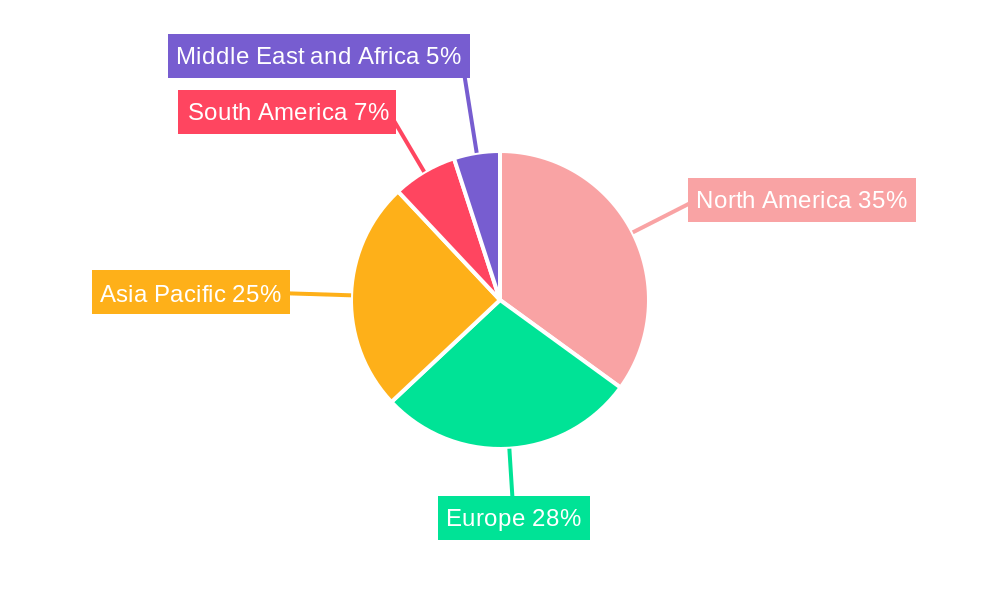
Dominant Regions, Countries, or Segments in Smart Home Fitness/Gym Equipment Market
The smart home fitness and gym equipment market is experiencing significant growth and regional variations. Currently, North America leads the global market, fueled by a strong economy, high disposable incomes, and a well-established adoption rate of smart home technologies. Following closely is Europe, which benefits from increasing health consciousness and a growing interest in connected fitness solutions. The Asia-Pacific region presents a substantial growth opportunity, driven by rising middle-class populations, increasing urbanization, and a greater awareness of health and wellness trends.
In terms of product segments, strength training equipment is outpacing cardiovascular training equipment in terms of growth. This surge is attributed to the rising popularity of functional fitness, the desire for comprehensive home gym setups, and the development of innovative smart strength solutions that offer personalized resistance and guided workouts. Conversely, while cardiovascular equipment like treadmills and bikes remain popular, the innovation pace and adoption of their smart counterparts are more mature.
The landscape of distribution channels is being revolutionized by the exponential growth of online sales. The convenience of e-commerce, coupled with the ability for consumers to research, compare, and purchase equipment from the comfort of their homes, has propelled online channels to the forefront. Direct-to-consumer (DTC) models are also gaining traction, allowing brands to foster stronger customer relationships and offer integrated experiences.
- Leading Region: North America continues to command the largest market share, underpinned by its robust economic conditions, early and widespread adoption of smart home devices, and a population that prioritizes health and fitness.
- Key Country: The United States remains the dominant force within the North American market, setting trends and driving innovation in the smart home fitness sector.
- Fastest-Growing Segment (Product Type): Strength training equipment is experiencing the most rapid expansion. This is driven by advancements in smart resistance technology, the growing appeal of functional training, and the increasing demand for adaptable home gym solutions.
- Fastest-Growing Segment (Distribution Channel): Online sales channels are witnessing unparalleled growth. Factors contributing to this include the widespread adoption of e-commerce platforms, enhanced logistics for home delivery of larger items, and a growing consumer preference for digital purchasing convenience.
- Key Drivers: The market is propelled by several interconnected factors: high disposable incomes in developed economies, a pervasive increase in health and wellness awareness, the sustained popularity of home-based workouts, and continuous technological advancements that enhance the user experience.
Smart Home Fitness/Gym Equipment Market Product Landscape
The smart home fitness and gym equipment market boasts an impressive and ever-expanding array of products designed to bring professional-grade workouts into the home. This category encompasses sophisticated connected treadmills with interactive displays and virtual running environments, smart stationary bikes offering live and on-demand cycling classes, innovative strength training machines that utilize digital resistance and AI-powered form correction, and highly engaging interactive fitness mirrors that transform any space into a virtual studio. These products are defined by their advanced functionalities, including hyper-personalized workout programs tailored to individual fitness levels and goals, precise real-time performance tracking of key metrics, and seamless integration with dedicated mobile applications for progress monitoring and community engagement.
The unique selling propositions (USPs) that resonate with consumers are numerous and compelling. Foremost among these is the unparalleled convenience of home workouts, allowing users to exercise on their own schedule without the need for travel or gym memberships. This is complemented by highly personalized fitness plans that adapt to user progress and preferences, ensuring optimal results and sustained motivation. Furthermore, the integration of gamified fitness experiences, leaderboards, and social challenges transforms workouts from a chore into an engaging and enjoyable activity.
Technological advancements in this sector are relentlessly focused on enhancing the holistic user experience. Key areas of innovation include boosting user engagement through immersive content and interactive features, improving the accuracy and reliability of data collected during workouts, and developing more sophisticated AI algorithms for personalized coaching and injury prevention. The overarching goal is to provide a more comprehensive, motivating, and effective fitness journey that rivals or even surpasses traditional gym experiences.
Key Drivers, Barriers & Challenges in Smart Home Fitness/Gym Equipment Market
Key Drivers:
- Increasing health consciousness and demand for convenient fitness options.
- Technological advancements, such as AI-powered training and VR integration.
- Growing adoption of smart home technology and connected devices.
Challenges:
- High initial investment costs for consumers.
- Potential for technical issues and connectivity problems.
- Competition from traditional gyms and other fitness solutions. The market share of traditional gyms decreased by approximately xx% between 2019 and 2024 due to increased adoption of smart home fitness equipment.
Emerging Opportunities in Smart Home Fitness/Gym Equipment Market
- Market Expansion: Significant opportunities lie in penetrating and developing nascent markets within emerging economies. This involves tailoring product offerings and pricing strategies to suit local economic conditions and cultural preferences.
- Product Innovation: There is a continuous demand for the development of novel products that address specific fitness needs, niche training methodologies, and diverse user preferences. This includes specialized equipment for rehabilitation, senior fitness, and various sports-specific training.
- Technological Integration: The integration of cutting-edge technologies such as Artificial Intelligence (AI) for adaptive coaching and predictive analytics, and Virtual Reality (VR) for immersive training environments, presents a substantial opportunity to redefine user engagement and workout efficacy.
- Subscription and Service Models: Expanding and optimizing subscription-based content and premium service offerings, including personalized coaching, nutritional guidance, and community features, can create recurring revenue streams and foster long-term customer loyalty.
- Strategic Partnerships: Collaborations with fitness influencers, health and wellness platforms, and even insurance providers can broaden market reach, enhance brand credibility, and develop integrated health solutions.
- Sustainability and Eco-Friendly Design: With growing consumer awareness, there is an emerging opportunity to develop smart fitness equipment with a focus on sustainable materials, energy efficiency, and a reduced environmental footprint.
Growth Accelerators in the Smart Home Fitness/Gym Equipment Market Industry
Strategic partnerships between fitness equipment manufacturers and technology companies are accelerating market growth. Technological advancements, such as the integration of AI and virtual reality, are also driving growth. The expansion into new markets and the development of innovative products further contribute to the market's expansion.
Key Players Shaping the Smart Home Fitness/Gym Equipment Market Market
- Peloton
- TRUE Fitness Technology Inc
- Nautilus Inc
- JTX Fitness
- Core Health and Fitness LLC
- Precor Inc
- Tonal System Inc
- Technogym
- ICON Health & Fitness Inc
- Life Fitness Inc
Notable Milestones in Smart Home Fitness/Gym Equipment Market Sector
- February 2023: iFIT (formerly ICON Health & Fitness) significantly expanded its digital fitness ecosystem and customer base by acquiring Sweat, a leading women's health and fitness platform, for USD 300 million. This strategic move allows iFIT to cater to a broader demographic and enhance its content offerings.
- October 2023: Lululemon, a prominent athletic apparel company, forged a significant five-year partnership with Peloton. This collaboration focuses on co-creating content, apparel, and community initiatives, signaling a growing trend of convergence between the fitness apparel and connected fitness technology sectors. In conjunction with this partnership, Lululemon announced the discontinuation of its own mirror-connected fitness service, further solidifying Peloton's position and highlighting the dynamic nature of market alliances.
In-Depth Smart Home Fitness/Gym Equipment Market Market Outlook
The smart home fitness/gym equipment market is poised for significant growth in the coming years. Technological advancements, strategic partnerships, and expanding consumer demand will continue to drive market expansion. Companies that focus on innovation, personalized fitness solutions, and seamless user experiences are best positioned to capitalize on future market opportunities. The integration of AI, VR, and other emerging technologies will likely shape the future of this dynamic market.
Smart Home Fitness/Gym Equipment Market Segmentation
-
1. Product Type
- 1.1. Cardiovascular Training Equipment
- 1.2. Strength Training Equipment
-
2. Distribution Channel
- 2.1. Supermarkets/Hypermarkets
- 2.2. Specialized Stores
- 2.3. Online
- 2.4. Other Distribution Channels
Smart Home Fitness/Gym Equipment Market Segmentation By Geography
-
1. Asia Pacific
- 1.1. India
- 1.2. China
- 1.3. Japan
- 1.4. Australia
- 1.5. Rest of Asia Pacific
-
2. North America
- 2.1. United States
- 2.2. Mexico
- 2.3. Rest of North America
-
3. Europe
- 3.1. Germany
- 3.2. United Kingdom
- 3.3. France
- 3.4. Russia
- 3.5. Rest of Europe
-
4. South America
- 4.1. Brazil
- 4.2. Argentina
- 4.3. Rest of South America
-
5. Middle East and Africa
- 5.1. United Arab Emirates
- 5.2. South Africa
- 5.3. Rest of Middle East and Africa
Smart Home Fitness/Gym Equipment Market Regional Market Share
Geographic Coverage of Smart Home Fitness/Gym Equipment Market
Smart Home Fitness/Gym Equipment Market REPORT HIGHLIGHTS
| Aspects | Details |
|---|---|
| Study Period | 2020-2034 |
| Base Year | 2025 |
| Estimated Year | 2026 |
| Forecast Period | 2026-2034 |
| Historical Period | 2020-2025 |
| Growth Rate | CAGR of 5.13% from 2020-2034 |
| Segmentation |
|
Table of Contents
- 1. Introduction
- 1.1. Research Scope
- 1.2. Market Segmentation
- 1.3. Research Objective
- 1.4. Definitions and Assumptions
- 2. Executive Summary
- 2.1. Market Snapshot
- 3. Market Dynamics
- 3.1. Market Drivers
- 3.2. Market Restrains
- 3.3. Market Trends
- 3.4. Market Opportunities
- 4. Market Factor Analysis
- 4.1. Porters Five Forces
- 4.1.1. Bargaining Power of Suppliers
- 4.1.2. Bargaining Power of Buyers
- 4.1.3. Threat of New Entrants
- 4.1.4. Threat of Substitutes
- 4.1.5. Competitive Rivalry
- 4.2. PESTEL analysis
- 4.3. BCG Analysis
- 4.3.1. Stars (High Growth, High Market Share)
- 4.3.2. Cash Cows (Low Growth, High Market Share)
- 4.3.3. Question Mark (High Growth, Low Market Share)
- 4.3.4. Dogs (Low Growth, Low Market Share)
- 4.4. Ansoff Matrix Analysis
- 4.5. Supply Chain Analysis
- 4.6. Regulatory Landscape
- 4.7. Current Market Potential and Opportunity Assessment (TAM–SAM–SOM Framework)
- 4.8. VDR Analyst Note
- 4.1. Porters Five Forces
- 5. Market Analysis, Insights and Forecast 2021-2033
- 5.1. Market Analysis, Insights and Forecast - by Product Type
- 5.1.1. Cardiovascular Training Equipment
- 5.1.2. Strength Training Equipment
- 5.2. Market Analysis, Insights and Forecast - by Distribution Channel
- 5.2.1. Supermarkets/Hypermarkets
- 5.2.2. Specialized Stores
- 5.2.3. Online
- 5.2.4. Other Distribution Channels
- 5.3. Market Analysis, Insights and Forecast - by Region
- 5.3.1. Asia Pacific
- 5.3.2. North America
- 5.3.3. Europe
- 5.3.4. South America
- 5.3.5. Middle East and Africa
- 5.1. Market Analysis, Insights and Forecast - by Product Type
- 6. Global Smart Home Fitness/Gym Equipment Market Analysis, Insights and Forecast, 2021-2033
- 6.1. Market Analysis, Insights and Forecast - by Product Type
- 6.1.1. Cardiovascular Training Equipment
- 6.1.2. Strength Training Equipment
- 6.2. Market Analysis, Insights and Forecast - by Distribution Channel
- 6.2.1. Supermarkets/Hypermarkets
- 6.2.2. Specialized Stores
- 6.2.3. Online
- 6.2.4. Other Distribution Channels
- 6.1. Market Analysis, Insights and Forecast - by Product Type
- 7. Asia Pacific Smart Home Fitness/Gym Equipment Market Analysis, Insights and Forecast, 2021-2033
- 7.1. Market Analysis, Insights and Forecast - by Product Type
- 7.1.1. Cardiovascular Training Equipment
- 7.1.2. Strength Training Equipment
- 7.2. Market Analysis, Insights and Forecast - by Distribution Channel
- 7.2.1. Supermarkets/Hypermarkets
- 7.2.2. Specialized Stores
- 7.2.3. Online
- 7.2.4. Other Distribution Channels
- 7.1. Market Analysis, Insights and Forecast - by Product Type
- 8. North America Smart Home Fitness/Gym Equipment Market Analysis, Insights and Forecast, 2021-2033
- 8.1. Market Analysis, Insights and Forecast - by Product Type
- 8.1.1. Cardiovascular Training Equipment
- 8.1.2. Strength Training Equipment
- 8.2. Market Analysis, Insights and Forecast - by Distribution Channel
- 8.2.1. Supermarkets/Hypermarkets
- 8.2.2. Specialized Stores
- 8.2.3. Online
- 8.2.4. Other Distribution Channels
- 8.1. Market Analysis, Insights and Forecast - by Product Type
- 9. Europe Smart Home Fitness/Gym Equipment Market Analysis, Insights and Forecast, 2021-2033
- 9.1. Market Analysis, Insights and Forecast - by Product Type
- 9.1.1. Cardiovascular Training Equipment
- 9.1.2. Strength Training Equipment
- 9.2. Market Analysis, Insights and Forecast - by Distribution Channel
- 9.2.1. Supermarkets/Hypermarkets
- 9.2.2. Specialized Stores
- 9.2.3. Online
- 9.2.4. Other Distribution Channels
- 9.1. Market Analysis, Insights and Forecast - by Product Type
- 10. South America Smart Home Fitness/Gym Equipment Market Analysis, Insights and Forecast, 2021-2033
- 10.1. Market Analysis, Insights and Forecast - by Product Type
- 10.1.1. Cardiovascular Training Equipment
- 10.1.2. Strength Training Equipment
- 10.2. Market Analysis, Insights and Forecast - by Distribution Channel
- 10.2.1. Supermarkets/Hypermarkets
- 10.2.2. Specialized Stores
- 10.2.3. Online
- 10.2.4. Other Distribution Channels
- 10.1. Market Analysis, Insights and Forecast - by Product Type
- 11. Middle East and Africa Smart Home Fitness/Gym Equipment Market Analysis, Insights and Forecast, 2021-2033
- 11.1. Market Analysis, Insights and Forecast - by Product Type
- 11.1.1. Cardiovascular Training Equipment
- 11.1.2. Strength Training Equipment
- 11.2. Market Analysis, Insights and Forecast - by Distribution Channel
- 11.2.1. Supermarkets/Hypermarkets
- 11.2.2. Specialized Stores
- 11.2.3. Online
- 11.2.4. Other Distribution Channels
- 11.1. Market Analysis, Insights and Forecast - by Product Type
- 12. Competitive Analysis
- 12.1. Company Profiles
- 12.1.1 Peloton
- 12.1.1.1. Company Overview
- 12.1.1.2. Products
- 12.1.1.3. Company Financials
- 12.1.1.4. SWOT Analysis
- 12.1.2 TRUE Fitness Technology Inc
- 12.1.2.1. Company Overview
- 12.1.2.2. Products
- 12.1.2.3. Company Financials
- 12.1.2.4. SWOT Analysis
- 12.1.3 Nautilus Inc
- 12.1.3.1. Company Overview
- 12.1.3.2. Products
- 12.1.3.3. Company Financials
- 12.1.3.4. SWOT Analysis
- 12.1.4 JTX Fitness
- 12.1.4.1. Company Overview
- 12.1.4.2. Products
- 12.1.4.3. Company Financials
- 12.1.4.4. SWOT Analysis
- 12.1.5 Core Health and Fitness LLC
- 12.1.5.1. Company Overview
- 12.1.5.2. Products
- 12.1.5.3. Company Financials
- 12.1.5.4. SWOT Analysis
- 12.1.6 Precor Inc
- 12.1.6.1. Company Overview
- 12.1.6.2. Products
- 12.1.6.3. Company Financials
- 12.1.6.4. SWOT Analysis
- 12.1.7 Tonal System Inc
- 12.1.7.1. Company Overview
- 12.1.7.2. Products
- 12.1.7.3. Company Financials
- 12.1.7.4. SWOT Analysis
- 12.1.8 Technogym
- 12.1.8.1. Company Overview
- 12.1.8.2. Products
- 12.1.8.3. Company Financials
- 12.1.8.4. SWOT Analysis
- 12.1.9 ICON Health & Fitness Inc
- 12.1.9.1. Company Overview
- 12.1.9.2. Products
- 12.1.9.3. Company Financials
- 12.1.9.4. SWOT Analysis
- 12.1.10 Life Fitness Inc
- 12.1.10.1. Company Overview
- 12.1.10.2. Products
- 12.1.10.3. Company Financials
- 12.1.10.4. SWOT Analysis
- 12.1.1 Peloton
- 12.2. Market Entropy
- 12.2.1 Company's Key Areas Served
- 12.2.2 Recent Developments
- 12.3. Company Market Share Analysis 2025
- 12.3.1 Top 5 Companies Market Share Analysis
- 12.3.2 Top 3 Companies Market Share Analysis
- 12.4. List of Potential Customers
- 13. Research Methodology
List of Figures
- Figure 1: Global Smart Home Fitness/Gym Equipment Market Revenue Breakdown (Million, %) by Region 2025 & 2033
- Figure 2: Global Smart Home Fitness/Gym Equipment Market Volume Breakdown (K Units, %) by Region 2025 & 2033
- Figure 3: Asia Pacific Smart Home Fitness/Gym Equipment Market Revenue (Million), by Product Type 2025 & 2033
- Figure 4: Asia Pacific Smart Home Fitness/Gym Equipment Market Volume (K Units), by Product Type 2025 & 2033
- Figure 5: Asia Pacific Smart Home Fitness/Gym Equipment Market Revenue Share (%), by Product Type 2025 & 2033
- Figure 6: Asia Pacific Smart Home Fitness/Gym Equipment Market Volume Share (%), by Product Type 2025 & 2033
- Figure 7: Asia Pacific Smart Home Fitness/Gym Equipment Market Revenue (Million), by Distribution Channel 2025 & 2033
- Figure 8: Asia Pacific Smart Home Fitness/Gym Equipment Market Volume (K Units), by Distribution Channel 2025 & 2033
- Figure 9: Asia Pacific Smart Home Fitness/Gym Equipment Market Revenue Share (%), by Distribution Channel 2025 & 2033
- Figure 10: Asia Pacific Smart Home Fitness/Gym Equipment Market Volume Share (%), by Distribution Channel 2025 & 2033
- Figure 11: Asia Pacific Smart Home Fitness/Gym Equipment Market Revenue (Million), by Country 2025 & 2033
- Figure 12: Asia Pacific Smart Home Fitness/Gym Equipment Market Volume (K Units), by Country 2025 & 2033
- Figure 13: Asia Pacific Smart Home Fitness/Gym Equipment Market Revenue Share (%), by Country 2025 & 2033
- Figure 14: Asia Pacific Smart Home Fitness/Gym Equipment Market Volume Share (%), by Country 2025 & 2033
- Figure 15: North America Smart Home Fitness/Gym Equipment Market Revenue (Million), by Product Type 2025 & 2033
- Figure 16: North America Smart Home Fitness/Gym Equipment Market Volume (K Units), by Product Type 2025 & 2033
- Figure 17: North America Smart Home Fitness/Gym Equipment Market Revenue Share (%), by Product Type 2025 & 2033
- Figure 18: North America Smart Home Fitness/Gym Equipment Market Volume Share (%), by Product Type 2025 & 2033
- Figure 19: North America Smart Home Fitness/Gym Equipment Market Revenue (Million), by Distribution Channel 2025 & 2033
- Figure 20: North America Smart Home Fitness/Gym Equipment Market Volume (K Units), by Distribution Channel 2025 & 2033
- Figure 21: North America Smart Home Fitness/Gym Equipment Market Revenue Share (%), by Distribution Channel 2025 & 2033
- Figure 22: North America Smart Home Fitness/Gym Equipment Market Volume Share (%), by Distribution Channel 2025 & 2033
- Figure 23: North America Smart Home Fitness/Gym Equipment Market Revenue (Million), by Country 2025 & 2033
- Figure 24: North America Smart Home Fitness/Gym Equipment Market Volume (K Units), by Country 2025 & 2033
- Figure 25: North America Smart Home Fitness/Gym Equipment Market Revenue Share (%), by Country 2025 & 2033
- Figure 26: North America Smart Home Fitness/Gym Equipment Market Volume Share (%), by Country 2025 & 2033
- Figure 27: Europe Smart Home Fitness/Gym Equipment Market Revenue (Million), by Product Type 2025 & 2033
- Figure 28: Europe Smart Home Fitness/Gym Equipment Market Volume (K Units), by Product Type 2025 & 2033
- Figure 29: Europe Smart Home Fitness/Gym Equipment Market Revenue Share (%), by Product Type 2025 & 2033
- Figure 30: Europe Smart Home Fitness/Gym Equipment Market Volume Share (%), by Product Type 2025 & 2033
- Figure 31: Europe Smart Home Fitness/Gym Equipment Market Revenue (Million), by Distribution Channel 2025 & 2033
- Figure 32: Europe Smart Home Fitness/Gym Equipment Market Volume (K Units), by Distribution Channel 2025 & 2033
- Figure 33: Europe Smart Home Fitness/Gym Equipment Market Revenue Share (%), by Distribution Channel 2025 & 2033
- Figure 34: Europe Smart Home Fitness/Gym Equipment Market Volume Share (%), by Distribution Channel 2025 & 2033
- Figure 35: Europe Smart Home Fitness/Gym Equipment Market Revenue (Million), by Country 2025 & 2033
- Figure 36: Europe Smart Home Fitness/Gym Equipment Market Volume (K Units), by Country 2025 & 2033
- Figure 37: Europe Smart Home Fitness/Gym Equipment Market Revenue Share (%), by Country 2025 & 2033
- Figure 38: Europe Smart Home Fitness/Gym Equipment Market Volume Share (%), by Country 2025 & 2033
- Figure 39: South America Smart Home Fitness/Gym Equipment Market Revenue (Million), by Product Type 2025 & 2033
- Figure 40: South America Smart Home Fitness/Gym Equipment Market Volume (K Units), by Product Type 2025 & 2033
- Figure 41: South America Smart Home Fitness/Gym Equipment Market Revenue Share (%), by Product Type 2025 & 2033
- Figure 42: South America Smart Home Fitness/Gym Equipment Market Volume Share (%), by Product Type 2025 & 2033
- Figure 43: South America Smart Home Fitness/Gym Equipment Market Revenue (Million), by Distribution Channel 2025 & 2033
- Figure 44: South America Smart Home Fitness/Gym Equipment Market Volume (K Units), by Distribution Channel 2025 & 2033
- Figure 45: South America Smart Home Fitness/Gym Equipment Market Revenue Share (%), by Distribution Channel 2025 & 2033
- Figure 46: South America Smart Home Fitness/Gym Equipment Market Volume Share (%), by Distribution Channel 2025 & 2033
- Figure 47: South America Smart Home Fitness/Gym Equipment Market Revenue (Million), by Country 2025 & 2033
- Figure 48: South America Smart Home Fitness/Gym Equipment Market Volume (K Units), by Country 2025 & 2033
- Figure 49: South America Smart Home Fitness/Gym Equipment Market Revenue Share (%), by Country 2025 & 2033
- Figure 50: South America Smart Home Fitness/Gym Equipment Market Volume Share (%), by Country 2025 & 2033
- Figure 51: Middle East and Africa Smart Home Fitness/Gym Equipment Market Revenue (Million), by Product Type 2025 & 2033
- Figure 52: Middle East and Africa Smart Home Fitness/Gym Equipment Market Volume (K Units), by Product Type 2025 & 2033
- Figure 53: Middle East and Africa Smart Home Fitness/Gym Equipment Market Revenue Share (%), by Product Type 2025 & 2033
- Figure 54: Middle East and Africa Smart Home Fitness/Gym Equipment Market Volume Share (%), by Product Type 2025 & 2033
- Figure 55: Middle East and Africa Smart Home Fitness/Gym Equipment Market Revenue (Million), by Distribution Channel 2025 & 2033
- Figure 56: Middle East and Africa Smart Home Fitness/Gym Equipment Market Volume (K Units), by Distribution Channel 2025 & 2033
- Figure 57: Middle East and Africa Smart Home Fitness/Gym Equipment Market Revenue Share (%), by Distribution Channel 2025 & 2033
- Figure 58: Middle East and Africa Smart Home Fitness/Gym Equipment Market Volume Share (%), by Distribution Channel 2025 & 2033
- Figure 59: Middle East and Africa Smart Home Fitness/Gym Equipment Market Revenue (Million), by Country 2025 & 2033
- Figure 60: Middle East and Africa Smart Home Fitness/Gym Equipment Market Volume (K Units), by Country 2025 & 2033
- Figure 61: Middle East and Africa Smart Home Fitness/Gym Equipment Market Revenue Share (%), by Country 2025 & 2033
- Figure 62: Middle East and Africa Smart Home Fitness/Gym Equipment Market Volume Share (%), by Country 2025 & 2033
List of Tables
- Table 1: Global Smart Home Fitness/Gym Equipment Market Revenue Million Forecast, by Product Type 2020 & 2033
- Table 2: Global Smart Home Fitness/Gym Equipment Market Volume K Units Forecast, by Product Type 2020 & 2033
- Table 3: Global Smart Home Fitness/Gym Equipment Market Revenue Million Forecast, by Distribution Channel 2020 & 2033
- Table 4: Global Smart Home Fitness/Gym Equipment Market Volume K Units Forecast, by Distribution Channel 2020 & 2033
- Table 5: Global Smart Home Fitness/Gym Equipment Market Revenue Million Forecast, by Region 2020 & 2033
- Table 6: Global Smart Home Fitness/Gym Equipment Market Volume K Units Forecast, by Region 2020 & 2033
- Table 7: Global Smart Home Fitness/Gym Equipment Market Revenue Million Forecast, by Product Type 2020 & 2033
- Table 8: Global Smart Home Fitness/Gym Equipment Market Volume K Units Forecast, by Product Type 2020 & 2033
- Table 9: Global Smart Home Fitness/Gym Equipment Market Revenue Million Forecast, by Distribution Channel 2020 & 2033
- Table 10: Global Smart Home Fitness/Gym Equipment Market Volume K Units Forecast, by Distribution Channel 2020 & 2033
- Table 11: Global Smart Home Fitness/Gym Equipment Market Revenue Million Forecast, by Country 2020 & 2033
- Table 12: Global Smart Home Fitness/Gym Equipment Market Volume K Units Forecast, by Country 2020 & 2033
- Table 13: India Smart Home Fitness/Gym Equipment Market Revenue (Million) Forecast, by Application 2020 & 2033
- Table 14: India Smart Home Fitness/Gym Equipment Market Volume (K Units) Forecast, by Application 2020 & 2033
- Table 15: China Smart Home Fitness/Gym Equipment Market Revenue (Million) Forecast, by Application 2020 & 2033
- Table 16: China Smart Home Fitness/Gym Equipment Market Volume (K Units) Forecast, by Application 2020 & 2033
- Table 17: Japan Smart Home Fitness/Gym Equipment Market Revenue (Million) Forecast, by Application 2020 & 2033
- Table 18: Japan Smart Home Fitness/Gym Equipment Market Volume (K Units) Forecast, by Application 2020 & 2033
- Table 19: Australia Smart Home Fitness/Gym Equipment Market Revenue (Million) Forecast, by Application 2020 & 2033
- Table 20: Australia Smart Home Fitness/Gym Equipment Market Volume (K Units) Forecast, by Application 2020 & 2033
- Table 21: Rest of Asia Pacific Smart Home Fitness/Gym Equipment Market Revenue (Million) Forecast, by Application 2020 & 2033
- Table 22: Rest of Asia Pacific Smart Home Fitness/Gym Equipment Market Volume (K Units) Forecast, by Application 2020 & 2033
- Table 23: Global Smart Home Fitness/Gym Equipment Market Revenue Million Forecast, by Product Type 2020 & 2033
- Table 24: Global Smart Home Fitness/Gym Equipment Market Volume K Units Forecast, by Product Type 2020 & 2033
- Table 25: Global Smart Home Fitness/Gym Equipment Market Revenue Million Forecast, by Distribution Channel 2020 & 2033
- Table 26: Global Smart Home Fitness/Gym Equipment Market Volume K Units Forecast, by Distribution Channel 2020 & 2033
- Table 27: Global Smart Home Fitness/Gym Equipment Market Revenue Million Forecast, by Country 2020 & 2033
- Table 28: Global Smart Home Fitness/Gym Equipment Market Volume K Units Forecast, by Country 2020 & 2033
- Table 29: United States Smart Home Fitness/Gym Equipment Market Revenue (Million) Forecast, by Application 2020 & 2033
- Table 30: United States Smart Home Fitness/Gym Equipment Market Volume (K Units) Forecast, by Application 2020 & 2033
- Table 31: Mexico Smart Home Fitness/Gym Equipment Market Revenue (Million) Forecast, by Application 2020 & 2033
- Table 32: Mexico Smart Home Fitness/Gym Equipment Market Volume (K Units) Forecast, by Application 2020 & 2033
- Table 33: Rest of North America Smart Home Fitness/Gym Equipment Market Revenue (Million) Forecast, by Application 2020 & 2033
- Table 34: Rest of North America Smart Home Fitness/Gym Equipment Market Volume (K Units) Forecast, by Application 2020 & 2033
- Table 35: Global Smart Home Fitness/Gym Equipment Market Revenue Million Forecast, by Product Type 2020 & 2033
- Table 36: Global Smart Home Fitness/Gym Equipment Market Volume K Units Forecast, by Product Type 2020 & 2033
- Table 37: Global Smart Home Fitness/Gym Equipment Market Revenue Million Forecast, by Distribution Channel 2020 & 2033
- Table 38: Global Smart Home Fitness/Gym Equipment Market Volume K Units Forecast, by Distribution Channel 2020 & 2033
- Table 39: Global Smart Home Fitness/Gym Equipment Market Revenue Million Forecast, by Country 2020 & 2033
- Table 40: Global Smart Home Fitness/Gym Equipment Market Volume K Units Forecast, by Country 2020 & 2033
- Table 41: Germany Smart Home Fitness/Gym Equipment Market Revenue (Million) Forecast, by Application 2020 & 2033
- Table 42: Germany Smart Home Fitness/Gym Equipment Market Volume (K Units) Forecast, by Application 2020 & 2033
- Table 43: United Kingdom Smart Home Fitness/Gym Equipment Market Revenue (Million) Forecast, by Application 2020 & 2033
- Table 44: United Kingdom Smart Home Fitness/Gym Equipment Market Volume (K Units) Forecast, by Application 2020 & 2033
- Table 45: France Smart Home Fitness/Gym Equipment Market Revenue (Million) Forecast, by Application 2020 & 2033
- Table 46: France Smart Home Fitness/Gym Equipment Market Volume (K Units) Forecast, by Application 2020 & 2033
- Table 47: Russia Smart Home Fitness/Gym Equipment Market Revenue (Million) Forecast, by Application 2020 & 2033
- Table 48: Russia Smart Home Fitness/Gym Equipment Market Volume (K Units) Forecast, by Application 2020 & 2033
- Table 49: Rest of Europe Smart Home Fitness/Gym Equipment Market Revenue (Million) Forecast, by Application 2020 & 2033
- Table 50: Rest of Europe Smart Home Fitness/Gym Equipment Market Volume (K Units) Forecast, by Application 2020 & 2033
- Table 51: Global Smart Home Fitness/Gym Equipment Market Revenue Million Forecast, by Product Type 2020 & 2033
- Table 52: Global Smart Home Fitness/Gym Equipment Market Volume K Units Forecast, by Product Type 2020 & 2033
- Table 53: Global Smart Home Fitness/Gym Equipment Market Revenue Million Forecast, by Distribution Channel 2020 & 2033
- Table 54: Global Smart Home Fitness/Gym Equipment Market Volume K Units Forecast, by Distribution Channel 2020 & 2033
- Table 55: Global Smart Home Fitness/Gym Equipment Market Revenue Million Forecast, by Country 2020 & 2033
- Table 56: Global Smart Home Fitness/Gym Equipment Market Volume K Units Forecast, by Country 2020 & 2033
- Table 57: Brazil Smart Home Fitness/Gym Equipment Market Revenue (Million) Forecast, by Application 2020 & 2033
- Table 58: Brazil Smart Home Fitness/Gym Equipment Market Volume (K Units) Forecast, by Application 2020 & 2033
- Table 59: Argentina Smart Home Fitness/Gym Equipment Market Revenue (Million) Forecast, by Application 2020 & 2033
- Table 60: Argentina Smart Home Fitness/Gym Equipment Market Volume (K Units) Forecast, by Application 2020 & 2033
- Table 61: Rest of South America Smart Home Fitness/Gym Equipment Market Revenue (Million) Forecast, by Application 2020 & 2033
- Table 62: Rest of South America Smart Home Fitness/Gym Equipment Market Volume (K Units) Forecast, by Application 2020 & 2033
- Table 63: Global Smart Home Fitness/Gym Equipment Market Revenue Million Forecast, by Product Type 2020 & 2033
- Table 64: Global Smart Home Fitness/Gym Equipment Market Volume K Units Forecast, by Product Type 2020 & 2033
- Table 65: Global Smart Home Fitness/Gym Equipment Market Revenue Million Forecast, by Distribution Channel 2020 & 2033
- Table 66: Global Smart Home Fitness/Gym Equipment Market Volume K Units Forecast, by Distribution Channel 2020 & 2033
- Table 67: Global Smart Home Fitness/Gym Equipment Market Revenue Million Forecast, by Country 2020 & 2033
- Table 68: Global Smart Home Fitness/Gym Equipment Market Volume K Units Forecast, by Country 2020 & 2033
- Table 69: United Arab Emirates Smart Home Fitness/Gym Equipment Market Revenue (Million) Forecast, by Application 2020 & 2033
- Table 70: United Arab Emirates Smart Home Fitness/Gym Equipment Market Volume (K Units) Forecast, by Application 2020 & 2033
- Table 71: South Africa Smart Home Fitness/Gym Equipment Market Revenue (Million) Forecast, by Application 2020 & 2033
- Table 72: South Africa Smart Home Fitness/Gym Equipment Market Volume (K Units) Forecast, by Application 2020 & 2033
- Table 73: Rest of Middle East and Africa Smart Home Fitness/Gym Equipment Market Revenue (Million) Forecast, by Application 2020 & 2033
- Table 74: Rest of Middle East and Africa Smart Home Fitness/Gym Equipment Market Volume (K Units) Forecast, by Application 2020 & 2033
Frequently Asked Questions
1. What is the projected Compound Annual Growth Rate (CAGR) of the Smart Home Fitness/Gym Equipment Market?
The projected CAGR is approximately 5.13%.
2. Which companies are prominent players in the Smart Home Fitness/Gym Equipment Market?
Key companies in the market include Peloton, TRUE Fitness Technology Inc, Nautilus Inc, JTX Fitness, Core Health and Fitness LLC, Precor Inc, Tonal System Inc, Technogym, ICON Health & Fitness Inc, Life Fitness Inc.
3. What are the main segments of the Smart Home Fitness/Gym Equipment Market?
The market segments include Product Type, Distribution Channel.
4. Can you provide details about the market size?
The market size is estimated to be USD 2.5 Million as of 2022.
5. What are some drivers contributing to market growth?
Transforming Workouts with Ultimate Convenience for Busy Lifestyles; Increasing Awareness and Prioritization of Health.
6. What are the notable trends driving market growth?
Cardiovascular Training Equipment is Expected to Grow at a Faster Rate during the Forecast Period.
7. Are there any restraints impacting market growth?
High Product Cost Restrains Market Growth; Limited Space in Homes.
8. Can you provide examples of recent developments in the market?
October 2023: Lululemon entered a five-year partnership with connected fitness specialist Peloton, signing a content, apparel, and community initiative deal. As a result, Lululemon decided to discontinue its mirror-connected fitness service.
9. What pricing options are available for accessing the report?
Pricing options include single-user, multi-user, and enterprise licenses priced at USD 4750, USD 5250, and USD 8750 respectively.
10. Is the market size provided in terms of value or volume?
The market size is provided in terms of value, measured in Million and volume, measured in K Units.
11. Are there any specific market keywords associated with the report?
Yes, the market keyword associated with the report is "Smart Home Fitness/Gym Equipment Market," which aids in identifying and referencing the specific market segment covered.
12. How do I determine which pricing option suits my needs best?
The pricing options vary based on user requirements and access needs. Individual users may opt for single-user licenses, while businesses requiring broader access may choose multi-user or enterprise licenses for cost-effective access to the report.
13. Are there any additional resources or data provided in the Smart Home Fitness/Gym Equipment Market report?
While the report offers comprehensive insights, it's advisable to review the specific contents or supplementary materials provided to ascertain if additional resources or data are available.
14. How can I stay updated on further developments or reports in the Smart Home Fitness/Gym Equipment Market?
To stay informed about further developments, trends, and reports in the Smart Home Fitness/Gym Equipment Market, consider subscribing to industry newsletters, following relevant companies and organizations, or regularly checking reputable industry news sources and publications.
Methodology
Step 1 - Identification of Relevant Samples Size from Population Database


Step 2 - Approaches for Defining Global Market Size (Value, Volume* & Price*)

Note*: In applicable scenarios
Step 3 - Data Sources
Primary Research
- Web Analytics
- Survey Reports
- Research Institute
- Latest Research Reports
- Opinion Leaders
Secondary Research
- Annual Reports
- White Paper
- Latest Press Release
- Industry Association
- Paid Database
- Investor Presentations

Step 4 - Data Triangulation
Involves using different sources of information in order to increase the validity of a study
These sources are likely to be stakeholders in a program - participants, other researchers, program staff, other community members, and so on.
Then we put all data in single framework & apply various statistical tools to find out the dynamic on the market.
During the analysis stage, feedback from the stakeholder groups would be compared to determine areas of agreement as well as areas of divergence