


Key Insights
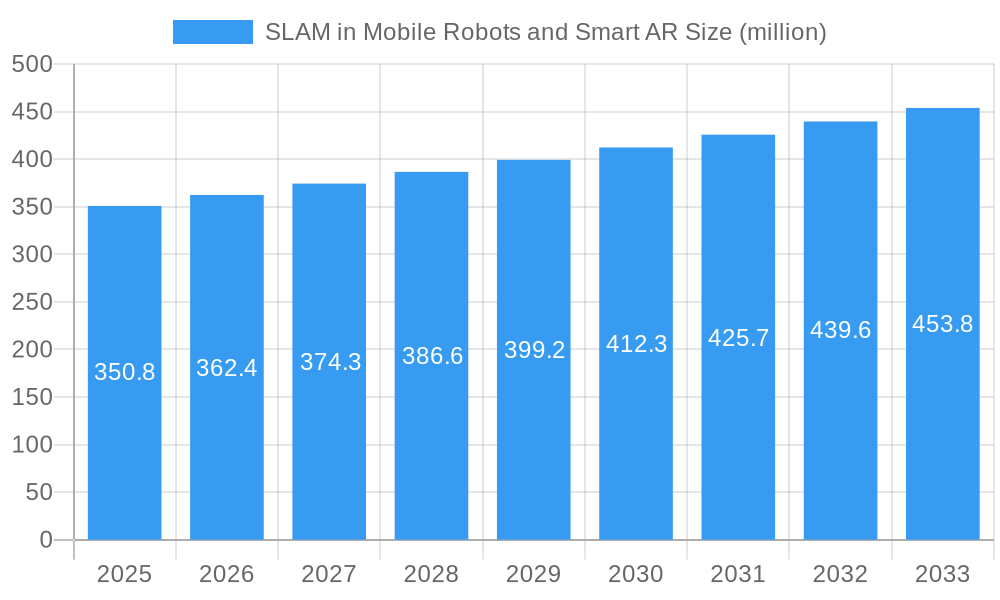
The global market for Simultaneous Localization and Mapping (SLAM) in Mobile Robots and Smart AR is poised for robust expansion, projected to reach an estimated USD 350.8 million by 2025, with a projected Compound Annual Growth Rate (CAGR) of 3.3% throughout the forecast period of 2025-2033. This growth is propelled by the increasing adoption of autonomous navigation in various sectors, particularly within military and commercial applications. Mobile robots are increasingly being integrated into logistics, warehousing, and manufacturing for enhanced automation and efficiency, while Smart Augmented Reality (AR) solutions leverage SLAM for precise environment mapping and immersive user experiences. The convergence of these technologies is creating new opportunities and driving innovation, making SLAM a critical component for the next generation of intelligent systems. The market's upward trajectory is further supported by advancements in sensor technology and computational power, enabling more accurate and real-time SLAM algorithms.
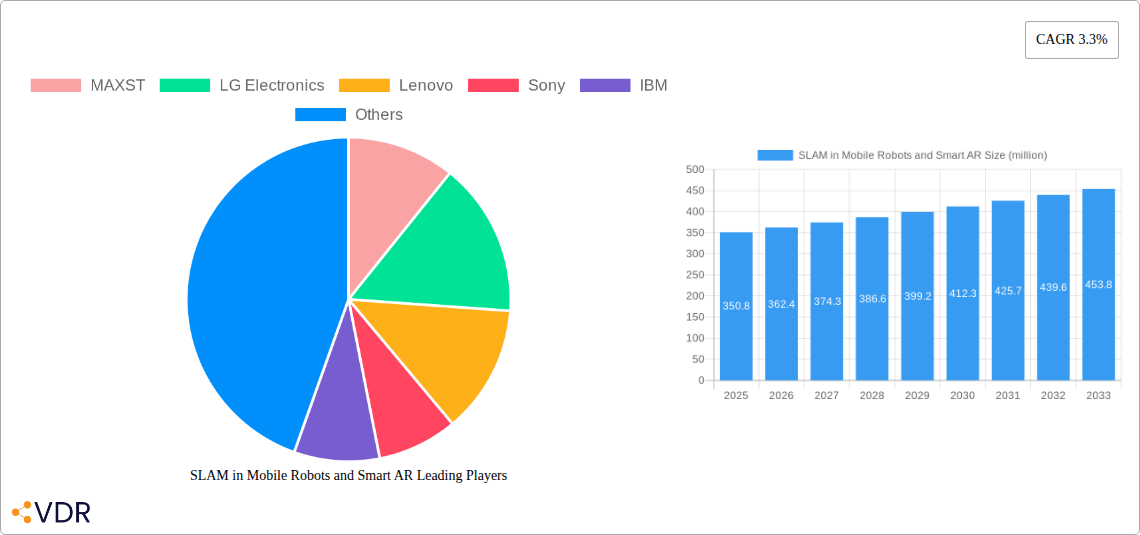
SLAM in Mobile Robots and Smart AR Market Size (In Million)

Key drivers for this market expansion include the escalating demand for advanced robotics in complex environments where GPS is unavailable or unreliable, such as indoor facilities and subterranean operations. The military sector is a significant contributor, utilizing SLAM for autonomous reconnaissance, surveillance, and unmanned ground vehicle navigation. In the commercial sphere, warehouse automation, retail inventory management, and intelligent building navigation are key application areas benefiting from SLAM-powered mobile robots. The burgeoning Smart AR market, encompassing applications from industrial training and remote assistance to gaming and navigation, also relies heavily on SLAM for accurate spatial understanding and object placement. While advancements in AI and machine learning continue to refine SLAM capabilities, challenges such as achieving robust performance in dynamic and unpredictable environments, alongside cost considerations for advanced sensor integration, will shape the market's evolution. Nonetheless, the inherent value proposition of enhanced autonomy and intelligent spatial awareness ensures a positive outlook for SLAM in mobile robots and smart AR.
SLAM in Mobile Robots and Smart AR Company Market Share
Unlocking the Future: SLAM in Mobile Robots and Smart AR Market Report
This comprehensive report delves into the dynamic and rapidly evolving landscape of Simultaneous Localization and Mapping (SLAM) technology as applied to mobile robots and Smart Augmented Reality (AR). We provide in-depth analysis and actionable insights for industry professionals navigating this high-growth sector, offering a definitive roadmap for strategic decision-making. The report spans from 2019 to 2033, with a base and estimated year of 2025, and a robust forecast period of 2025–2033.
SLAM in Mobile Robots and Smart AR Market Dynamics & Structure
The SLAM in Mobile Robots and Smart AR market is characterized by a dynamic interplay of technological innovation and increasing adoption across diverse applications. Market concentration is moderately fragmented, with a few key players like MAXST, LG Electronics, and Lenovo holding significant influence through their proprietary SLAM solutions and integrated hardware. However, the burgeoning presence of startups and specialized technology providers, including Exosite and Hi-Tech Robotic Systemz, fosters a competitive environment. Technological innovation is the primary driver, fueled by advancements in computer vision, sensor fusion, and AI algorithms that enhance the accuracy, robustness, and real-time capabilities of SLAM systems. Regulatory frameworks are still nascent, primarily focusing on safety and data privacy, with the potential to influence deployment strategies. Competitive product substitutes are emerging, particularly in niche AR applications where marker-based tracking offers simpler alternatives, but SLAM's inherent flexibility for unconstrained environments gives it a distinct advantage. End-user demographics are broadening, with increasing demand from both enterprise (commercial and industrial sectors) and professional users in fields like logistics, manufacturing, and defense. Mergers and acquisitions (M&A) are a notable trend, with larger technology conglomerates acquiring promising SLAM startups to integrate their capabilities into broader product ecosystems. For instance, the recent acquisition of Fetch Robotics by Zebra Technologies (not explicitly mentioned in the provided list but a significant industry event) highlights the strategic importance of robotics and SLAM. We anticipate $15.8 billion in M&A deal volumes over the forecast period, driven by the pursuit of intellectual property and market share. Innovation barriers include the computational intensity of SLAM algorithms, the need for precise sensor calibration, and the development of robust solutions for diverse and unpredictable real-world environments.
SLAM in Mobile Robots and Smart AR Growth Trends & Insights
The SLAM in Mobile Robots and Smart AR market is poised for substantial expansion, driven by its pivotal role in enabling autonomous navigation for mobile robots and immersive experiences for Smart AR. The global market size is projected to grow from an estimated $5.5 billion in 2025 to a remarkable $22.1 billion by 2033, exhibiting a Compound Annual Growth Rate (CAGR) of approximately 18.5%. This impressive growth trajectory is underpinned by escalating adoption rates across both the Commercial and Military applications, with the Commercial segment currently holding a dominant share estimated at 72% of the total market value in 2025.
Technological disruptions are continuously reshaping the market. Advancements in sensor technology, including LiDAR, depth cameras, and IMUs, are leading to more accurate, cost-effective, and power-efficient SLAM solutions. The integration of deep learning and AI is further enhancing SLAM's ability to understand and map complex environments, adapt to dynamic changes, and perform sophisticated object recognition. Consumer behavior shifts are also playing a crucial role, with an increasing demand for more intuitive and interactive experiences in AR, necessitating robust spatial understanding provided by SLAM. In the mobile robotics domain, the quest for greater autonomy in warehouses, factories, and even in consumer-facing applications is directly fueling the demand for advanced SLAM capabilities. The penetration rate of SLAM-enabled mobile robots in logistics alone is expected to reach 35% by 2030, a significant leap from current levels. Similarly, the Smart AR segment, encompassing applications from industrial maintenance to immersive gaming, is witnessing a surge in demand for seamless integration with the physical world, a feat made possible by sophisticated SLAM algorithms. The estimated market penetration for SLAM in Smart AR devices is projected to climb from 12% in 2025 to 40% by 2033, indicating a substantial shift towards AR experiences that are deeply rooted in real-world spatial awareness.
Dominant Regions, Countries, or Segments in SLAM in Mobile Robots and Smart AR
The Commercial segment, particularly within the mobile robots application, is unequivocally the dominant force driving the SLAM in Mobile Robots and Smart AR market. This dominance is fueled by a confluence of factors including escalating demand for automation in logistics, manufacturing, and warehousing, coupled with significant investment in Industry 4.0 initiatives. Within the Commercial segment, the mobile robots application commands an estimated 65% of the total market value in 2025, projected to reach $3.575 billion. The sheer scale of operations in these industries necessitates autonomous navigation for efficient material handling, inventory management, and streamlined production processes.
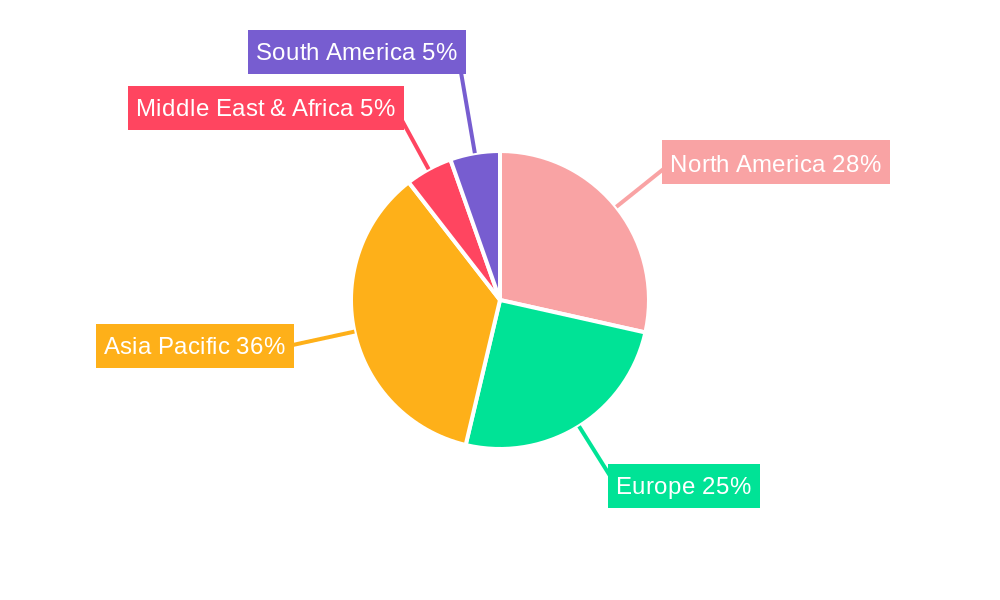
Geographically, North America, led by the United States, currently holds the largest market share, estimated at 38% in 2025, with a market value of $2.09 billion. This leadership is attributed to a robust technological ecosystem, significant R&D investments by companies like IBM and Exosite, early adoption of automation in its vast logistics and manufacturing sectors, and supportive government initiatives for technological advancement. Key drivers in this region include advanced infrastructure, a highly skilled workforce, and substantial venture capital funding available for innovative robotics and AR solutions. The widespread adoption of autonomous mobile robots (AMRs) in warehouses and distribution centers, facilitated by companies like Locus Robotics and Fetch Robotics, is a primary growth engine.
Asia-Pacific is emerging as the fastest-growing region, with a projected CAGR of 22% during the forecast period. China, in particular, is a significant contributor due to its massive manufacturing base and rapid adoption of smart factory technologies. Companies like Aviation Industry Corporation of China are actively investing in advanced robotics and AI, including SLAM, for complex industrial applications. The region's growth is further propelled by increasing government support for technological innovation and a burgeoning demand for AR solutions in consumer electronics and entertainment. The Military application, while smaller in market share currently, is exhibiting robust growth due to increasing defense budgets and the need for autonomous systems in surveillance, reconnaissance, and logistics. Countries like South Korea are making significant strides in developing advanced robotic solutions for both commercial and defense purposes.
SLAM in Mobile Robots and Smart AR Product Landscape
The product landscape for SLAM in Mobile Robots and Smart AR is characterized by continuous innovation aimed at enhancing accuracy, robustness, and real-time performance across diverse environments. Key advancements include the development of feature-rich, light-weight SLAM algorithms that can run on resource-constrained mobile devices, such as those used by companies like MAXST and Sony in their AR SDKs. Furthermore, hybrid SLAM approaches, combining visual-inertial odometry with LiDAR-based mapping, are gaining traction, offering superior performance in challenging conditions with poor lighting or featureless textures. For mobile robots, SLAM solutions from Omron Adept, Swisslog (KUKA), and Mobile Industrial Robots are enabling sophisticated navigation in complex industrial settings, optimizing material flow and reducing operational costs. These systems often integrate multiple sensor modalities to achieve centimeter-level localization accuracy. In Smart AR, products from Lenovo and LG Electronics are leveraging SLAM to create persistent, world-anchored AR experiences, allowing for complex object placement and interaction within real-world spaces. The performance metrics being pushed include loop closure rates, mapping accuracy (often within a few centimeters), and latency, crucial for seamless user experiences and reliable robotic operation.
Key Drivers, Barriers & Challenges in SLAM in Mobile Robots and Smart AR
Key Drivers:
- Increasing demand for automation: The relentless pursuit of operational efficiency and cost reduction across industries like logistics, manufacturing, and retail is a primary driver for autonomous mobile robots equipped with SLAM.
- Advancements in AI and sensor technology: Progress in computer vision, deep learning, and affordable, high-precision sensors (LiDAR, depth cameras) significantly enhances SLAM capabilities.
- Growth of the Augmented Reality market: The desire for more immersive and interactive AR experiences, requiring precise spatial understanding, is a major catalyst for SLAM adoption.
- Defense sector investment: Growing global defense budgets are fueling demand for autonomous systems in surveillance, logistics, and reconnaissance.
Key Barriers & Challenges:
- Computational complexity and power consumption: Sophisticated SLAM algorithms require significant processing power, posing challenges for mobile platforms with limited battery life and computational resources.
- Environmental variability: SLAM performance can degrade in dynamic, unstructured, or rapidly changing environments (e.g., extreme lighting, weather conditions, crowded spaces).
- High initial implementation costs: The cost of advanced sensors, robust SLAM software, and integration with existing infrastructure can be a barrier for smaller enterprises.
- Regulatory and safety concerns: Evolving regulations around autonomous systems and data privacy can create hurdles for widespread deployment, particularly in public spaces or sensitive military applications.
- Data fusion and sensor calibration: Achieving reliable and accurate mapping requires sophisticated sensor fusion techniques and precise calibration, which can be complex and time-consuming. The estimated cost of integration for large-scale industrial deployments can range from $50,000 to $200,000 per robot.
Emerging Opportunities in SLAM in Mobile Robots and Smart AR
Emerging opportunities for SLAM in Mobile Robots and Smart AR lie in the expansion into less conventional environments and the integration with emerging technologies. The development of more robust and adaptable SLAM algorithms capable of operating effectively in outdoor, highly dynamic, and GPS-denied environments presents a significant untapped market for autonomous vehicles, agricultural robots, and advanced construction robotics. Furthermore, the fusion of SLAM with 5G technology promises ultra-low latency and high-bandwidth communication, enabling real-time collaboration between multiple robots and AR devices, and unlocking new possibilities for remote operation and collaborative robotics. The increasing use of SLAM in healthcare for robotic surgery assistance and patient care robots, as well as in smart city infrastructure for mapping and urban planning, represents further avenues for growth. The market for AI-powered, context-aware AR experiences that seamlessly blend digital information with the physical world is also a fertile ground for SLAM innovation.
Growth Accelerators in the SLAM in Mobile Robots and Smart AR Industry
Several key growth accelerators are propelling the SLAM in Mobile Robots and Smart AR industry forward. Firstly, continuous advancements in sensor hardware, leading to smaller, more affordable, and more powerful LiDAR, depth sensors, and cameras, are making SLAM more accessible. Secondly, the deepening integration of Artificial Intelligence and Machine Learning techniques into SLAM algorithms is enhancing their ability to perceive, understand, and adapt to complex environments, leading to more reliable and intelligent autonomous systems. Thirdly, strategic partnerships and collaborations between SLAM technology providers, hardware manufacturers (like Sony and LG Electronics), and application developers are accelerating product development and market penetration. The increasing adoption of open-source SLAM frameworks and platforms is also fostering innovation and reducing development barriers. Finally, the growing investment in robotics and AR/VR by major technology players and venture capitalists is providing the financial impetus for further research, development, and commercialization.
Key Players Shaping the SLAM in Mobile Robots and Smart AR Market
- MAXST
- LG Electronics
- Lenovo
- Sony
- IBM
- Exosite
- Swisslog (KUKA)
- Omron Adept
- Clearpath Robotics
- Vecna
- Mobile Industrial Robots
- SMP Robotics
- Cimcorp Automation
- Aethon
- Locus Robotics
- Fetch Robotics
- Hi-Tech Robotic Systemz
- Aviation Industry Corporation of China
Notable Milestones in SLAM in Mobile Robots and Smart AR Sector
- 2019: Increased adoption of Visual-Inertial SLAM (VI-SLAM) in consumer AR headsets.
- 2020: Introduction of advanced LiDAR-based SLAM solutions for industrial robots by Omron Adept and Swisslog (KUKA).
- 2021: MAXST releases enhanced SLAM SDKs with improved robustness for outdoor environments.
- 2022: LG Electronics integrates sophisticated SLAM into their AR-enabled consumer devices.
- 2023: IBM's AI research contributes to more robust SLAM algorithms for complex urban mapping.
- 2024: Significant advancements in real-time, low-power SLAM for edge devices, impacting Smart AR development.
- 2025 (Estimated): Expected widespread deployment of SLAM-powered autonomous mobile robots in large-scale fulfillment centers.
In-Depth SLAM in Mobile Robots and Smart AR Market Outlook
The outlook for the SLAM in Mobile Robots and Smart AR market is exceptionally strong, fueled by accelerating technological advancements and expanding application horizons. The increasing maturity of SLAM algorithms, coupled with the declining cost of advanced sensors, will democratize access to autonomous navigation and immersive AR experiences. Growth accelerators like AI integration, 5G connectivity, and strategic ecosystem development will further amplify market expansion. The convergence of mobile robotics and Smart AR, enabled by sophisticated SLAM, promises to redefine industries, enhance human-robot collaboration, and create entirely new user experiences. The market is poised to witness significant growth, driven by continued innovation and robust demand across both the Commercial and Military sectors, with mobile robots leading the charge.
SLAM in Mobile Robots and Smart AR Segmentation
-
1. Application
- 1.1. Military
- 1.2. Commercial
-
2. Types
- 2.1. Mobile robots
- 2.2. Smart AR
SLAM in Mobile Robots and Smart AR Segmentation By Geography
-
1. North America
- 1.1. United States
- 1.2. Canada
- 1.3. Mexico
-
2. South America
- 2.1. Brazil
- 2.2. Argentina
- 2.3. Rest of South America
-
3. Europe
- 3.1. United Kingdom
- 3.2. Germany
- 3.3. France
- 3.4. Italy
- 3.5. Spain
- 3.6. Russia
- 3.7. Benelux
- 3.8. Nordics
- 3.9. Rest of Europe
-
4. Middle East & Africa
- 4.1. Turkey
- 4.2. Israel
- 4.3. GCC
- 4.4. North Africa
- 4.5. South Africa
- 4.6. Rest of Middle East & Africa
-
5. Asia Pacific
- 5.1. China
- 5.2. India
- 5.3. Japan
- 5.4. South Korea
- 5.5. ASEAN
- 5.6. Oceania
- 5.7. Rest of Asia Pacific
SLAM in Mobile Robots and Smart AR Regional Market Share
Geographic Coverage of SLAM in Mobile Robots and Smart AR
SLAM in Mobile Robots and Smart AR REPORT HIGHLIGHTS
| Aspects | Details |
|---|---|
| Study Period | 2020-2034 |
| Base Year | 2025 |
| Estimated Year | 2026 |
| Forecast Period | 2026-2034 |
| Historical Period | 2020-2025 |
| Growth Rate | CAGR of 3.3% from 2020-2034 |
| Segmentation |
|
Table of Contents
- 1. Introduction
- 1.1. Research Scope
- 1.2. Market Segmentation
- 1.3. Research Methodology
- 1.4. Definitions and Assumptions
- 2. Executive Summary
- 2.1. Introduction
- 3. Market Dynamics
- 3.1. Introduction
- 3.2. Market Drivers
- 3.3. Market Restrains
- 3.4. Market Trends
- 4. Market Factor Analysis
- 4.1. Porters Five Forces
- 4.2. Supply/Value Chain
- 4.3. PESTEL analysis
- 4.4. Market Entropy
- 4.5. Patent/Trademark Analysis
- 5. Global SLAM in Mobile Robots and Smart AR Analysis, Insights and Forecast, 2020-2032
- 5.1. Market Analysis, Insights and Forecast - by Application
- 5.1.1. Military
- 5.1.2. Commercial
- 5.2. Market Analysis, Insights and Forecast - by Types
- 5.2.1. Mobile robots
- 5.2.2. Smart AR
- 5.3. Market Analysis, Insights and Forecast - by Region
- 5.3.1. North America
- 5.3.2. South America
- 5.3.3. Europe
- 5.3.4. Middle East & Africa
- 5.3.5. Asia Pacific
- 5.1. Market Analysis, Insights and Forecast - by Application
- 6. North America SLAM in Mobile Robots and Smart AR Analysis, Insights and Forecast, 2020-2032
- 6.1. Market Analysis, Insights and Forecast - by Application
- 6.1.1. Military
- 6.1.2. Commercial
- 6.2. Market Analysis, Insights and Forecast - by Types
- 6.2.1. Mobile robots
- 6.2.2. Smart AR
- 6.1. Market Analysis, Insights and Forecast - by Application
- 7. South America SLAM in Mobile Robots and Smart AR Analysis, Insights and Forecast, 2020-2032
- 7.1. Market Analysis, Insights and Forecast - by Application
- 7.1.1. Military
- 7.1.2. Commercial
- 7.2. Market Analysis, Insights and Forecast - by Types
- 7.2.1. Mobile robots
- 7.2.2. Smart AR
- 7.1. Market Analysis, Insights and Forecast - by Application
- 8. Europe SLAM in Mobile Robots and Smart AR Analysis, Insights and Forecast, 2020-2032
- 8.1. Market Analysis, Insights and Forecast - by Application
- 8.1.1. Military
- 8.1.2. Commercial
- 8.2. Market Analysis, Insights and Forecast - by Types
- 8.2.1. Mobile robots
- 8.2.2. Smart AR
- 8.1. Market Analysis, Insights and Forecast - by Application
- 9. Middle East & Africa SLAM in Mobile Robots and Smart AR Analysis, Insights and Forecast, 2020-2032
- 9.1. Market Analysis, Insights and Forecast - by Application
- 9.1.1. Military
- 9.1.2. Commercial
- 9.2. Market Analysis, Insights and Forecast - by Types
- 9.2.1. Mobile robots
- 9.2.2. Smart AR
- 9.1. Market Analysis, Insights and Forecast - by Application
- 10. Asia Pacific SLAM in Mobile Robots and Smart AR Analysis, Insights and Forecast, 2020-2032
- 10.1. Market Analysis, Insights and Forecast - by Application
- 10.1.1. Military
- 10.1.2. Commercial
- 10.2. Market Analysis, Insights and Forecast - by Types
- 10.2.1. Mobile robots
- 10.2.2. Smart AR
- 10.1. Market Analysis, Insights and Forecast - by Application
- 11. Competitive Analysis
- 11.1. Global Market Share Analysis 2025
- 11.2. Company Profiles
- 11.2.1 MAXST
- 11.2.1.1. Overview
- 11.2.1.2. Products
- 11.2.1.3. SWOT Analysis
- 11.2.1.4. Recent Developments
- 11.2.1.5. Financials (Based on Availability)
- 11.2.2 LG Electronics
- 11.2.2.1. Overview
- 11.2.2.2. Products
- 11.2.2.3. SWOT Analysis
- 11.2.2.4. Recent Developments
- 11.2.2.5. Financials (Based on Availability)
- 11.2.3 Lenovo
- 11.2.3.1. Overview
- 11.2.3.2. Products
- 11.2.3.3. SWOT Analysis
- 11.2.3.4. Recent Developments
- 11.2.3.5. Financials (Based on Availability)
- 11.2.4 Sony
- 11.2.4.1. Overview
- 11.2.4.2. Products
- 11.2.4.3. SWOT Analysis
- 11.2.4.4. Recent Developments
- 11.2.4.5. Financials (Based on Availability)
- 11.2.5 IBM
- 11.2.5.1. Overview
- 11.2.5.2. Products
- 11.2.5.3. SWOT Analysis
- 11.2.5.4. Recent Developments
- 11.2.5.5. Financials (Based on Availability)
- 11.2.6 Exosite
- 11.2.6.1. Overview
- 11.2.6.2. Products
- 11.2.6.3. SWOT Analysis
- 11.2.6.4. Recent Developments
- 11.2.6.5. Financials (Based on Availability)
- 11.2.7 Swisslog (KUKA)
- 11.2.7.1. Overview
- 11.2.7.2. Products
- 11.2.7.3. SWOT Analysis
- 11.2.7.4. Recent Developments
- 11.2.7.5. Financials (Based on Availability)
- 11.2.8 Omron Adept
- 11.2.8.1. Overview
- 11.2.8.2. Products
- 11.2.8.3. SWOT Analysis
- 11.2.8.4. Recent Developments
- 11.2.8.5. Financials (Based on Availability)
- 11.2.9 Clearpath Robotics
- 11.2.9.1. Overview
- 11.2.9.2. Products
- 11.2.9.3. SWOT Analysis
- 11.2.9.4. Recent Developments
- 11.2.9.5. Financials (Based on Availability)
- 11.2.10 Vecna
- 11.2.10.1. Overview
- 11.2.10.2. Products
- 11.2.10.3. SWOT Analysis
- 11.2.10.4. Recent Developments
- 11.2.10.5. Financials (Based on Availability)
- 11.2.11 Mobile Industrial Robots
- 11.2.11.1. Overview
- 11.2.11.2. Products
- 11.2.11.3. SWOT Analysis
- 11.2.11.4. Recent Developments
- 11.2.11.5. Financials (Based on Availability)
- 11.2.12 SMP Robotics
- 11.2.12.1. Overview
- 11.2.12.2. Products
- 11.2.12.3. SWOT Analysis
- 11.2.12.4. Recent Developments
- 11.2.12.5. Financials (Based on Availability)
- 11.2.13 Cimcorp Automation
- 11.2.13.1. Overview
- 11.2.13.2. Products
- 11.2.13.3. SWOT Analysis
- 11.2.13.4. Recent Developments
- 11.2.13.5. Financials (Based on Availability)
- 11.2.14 Aethon
- 11.2.14.1. Overview
- 11.2.14.2. Products
- 11.2.14.3. SWOT Analysis
- 11.2.14.4. Recent Developments
- 11.2.14.5. Financials (Based on Availability)
- 11.2.15 Locus Robotics
- 11.2.15.1. Overview
- 11.2.15.2. Products
- 11.2.15.3. SWOT Analysis
- 11.2.15.4. Recent Developments
- 11.2.15.5. Financials (Based on Availability)
- 11.2.16 Fetch Robotics
- 11.2.16.1. Overview
- 11.2.16.2. Products
- 11.2.16.3. SWOT Analysis
- 11.2.16.4. Recent Developments
- 11.2.16.5. Financials (Based on Availability)
- 11.2.17 Hi-Tech Robotic Systemz
- 11.2.17.1. Overview
- 11.2.17.2. Products
- 11.2.17.3. SWOT Analysis
- 11.2.17.4. Recent Developments
- 11.2.17.5. Financials (Based on Availability)
- 11.2.18 Aviation Industry Corporation of China
- 11.2.18.1. Overview
- 11.2.18.2. Products
- 11.2.18.3. SWOT Analysis
- 11.2.18.4. Recent Developments
- 11.2.18.5. Financials (Based on Availability)
- 11.2.1 MAXST
List of Figures
- Figure 1: Global SLAM in Mobile Robots and Smart AR Revenue Breakdown (million, %) by Region 2025 & 2033
- Figure 2: North America SLAM in Mobile Robots and Smart AR Revenue (million), by Application 2025 & 2033
- Figure 3: North America SLAM in Mobile Robots and Smart AR Revenue Share (%), by Application 2025 & 2033
- Figure 4: North America SLAM in Mobile Robots and Smart AR Revenue (million), by Types 2025 & 2033
- Figure 5: North America SLAM in Mobile Robots and Smart AR Revenue Share (%), by Types 2025 & 2033
- Figure 6: North America SLAM in Mobile Robots and Smart AR Revenue (million), by Country 2025 & 2033
- Figure 7: North America SLAM in Mobile Robots and Smart AR Revenue Share (%), by Country 2025 & 2033
- Figure 8: South America SLAM in Mobile Robots and Smart AR Revenue (million), by Application 2025 & 2033
- Figure 9: South America SLAM in Mobile Robots and Smart AR Revenue Share (%), by Application 2025 & 2033
- Figure 10: South America SLAM in Mobile Robots and Smart AR Revenue (million), by Types 2025 & 2033
- Figure 11: South America SLAM in Mobile Robots and Smart AR Revenue Share (%), by Types 2025 & 2033
- Figure 12: South America SLAM in Mobile Robots and Smart AR Revenue (million), by Country 2025 & 2033
- Figure 13: South America SLAM in Mobile Robots and Smart AR Revenue Share (%), by Country 2025 & 2033
- Figure 14: Europe SLAM in Mobile Robots and Smart AR Revenue (million), by Application 2025 & 2033
- Figure 15: Europe SLAM in Mobile Robots and Smart AR Revenue Share (%), by Application 2025 & 2033
- Figure 16: Europe SLAM in Mobile Robots and Smart AR Revenue (million), by Types 2025 & 2033
- Figure 17: Europe SLAM in Mobile Robots and Smart AR Revenue Share (%), by Types 2025 & 2033
- Figure 18: Europe SLAM in Mobile Robots and Smart AR Revenue (million), by Country 2025 & 2033
- Figure 19: Europe SLAM in Mobile Robots and Smart AR Revenue Share (%), by Country 2025 & 2033
- Figure 20: Middle East & Africa SLAM in Mobile Robots and Smart AR Revenue (million), by Application 2025 & 2033
- Figure 21: Middle East & Africa SLAM in Mobile Robots and Smart AR Revenue Share (%), by Application 2025 & 2033
- Figure 22: Middle East & Africa SLAM in Mobile Robots and Smart AR Revenue (million), by Types 2025 & 2033
- Figure 23: Middle East & Africa SLAM in Mobile Robots and Smart AR Revenue Share (%), by Types 2025 & 2033
- Figure 24: Middle East & Africa SLAM in Mobile Robots and Smart AR Revenue (million), by Country 2025 & 2033
- Figure 25: Middle East & Africa SLAM in Mobile Robots and Smart AR Revenue Share (%), by Country 2025 & 2033
- Figure 26: Asia Pacific SLAM in Mobile Robots and Smart AR Revenue (million), by Application 2025 & 2033
- Figure 27: Asia Pacific SLAM in Mobile Robots and Smart AR Revenue Share (%), by Application 2025 & 2033
- Figure 28: Asia Pacific SLAM in Mobile Robots and Smart AR Revenue (million), by Types 2025 & 2033
- Figure 29: Asia Pacific SLAM in Mobile Robots and Smart AR Revenue Share (%), by Types 2025 & 2033
- Figure 30: Asia Pacific SLAM in Mobile Robots and Smart AR Revenue (million), by Country 2025 & 2033
- Figure 31: Asia Pacific SLAM in Mobile Robots and Smart AR Revenue Share (%), by Country 2025 & 2033
List of Tables
- Table 1: Global SLAM in Mobile Robots and Smart AR Revenue million Forecast, by Application 2020 & 2033
- Table 2: Global SLAM in Mobile Robots and Smart AR Revenue million Forecast, by Types 2020 & 2033
- Table 3: Global SLAM in Mobile Robots and Smart AR Revenue million Forecast, by Region 2020 & 2033
- Table 4: Global SLAM in Mobile Robots and Smart AR Revenue million Forecast, by Application 2020 & 2033
- Table 5: Global SLAM in Mobile Robots and Smart AR Revenue million Forecast, by Types 2020 & 2033
- Table 6: Global SLAM in Mobile Robots and Smart AR Revenue million Forecast, by Country 2020 & 2033
- Table 7: United States SLAM in Mobile Robots and Smart AR Revenue (million) Forecast, by Application 2020 & 2033
- Table 8: Canada SLAM in Mobile Robots and Smart AR Revenue (million) Forecast, by Application 2020 & 2033
- Table 9: Mexico SLAM in Mobile Robots and Smart AR Revenue (million) Forecast, by Application 2020 & 2033
- Table 10: Global SLAM in Mobile Robots and Smart AR Revenue million Forecast, by Application 2020 & 2033
- Table 11: Global SLAM in Mobile Robots and Smart AR Revenue million Forecast, by Types 2020 & 2033
- Table 12: Global SLAM in Mobile Robots and Smart AR Revenue million Forecast, by Country 2020 & 2033
- Table 13: Brazil SLAM in Mobile Robots and Smart AR Revenue (million) Forecast, by Application 2020 & 2033
- Table 14: Argentina SLAM in Mobile Robots and Smart AR Revenue (million) Forecast, by Application 2020 & 2033
- Table 15: Rest of South America SLAM in Mobile Robots and Smart AR Revenue (million) Forecast, by Application 2020 & 2033
- Table 16: Global SLAM in Mobile Robots and Smart AR Revenue million Forecast, by Application 2020 & 2033
- Table 17: Global SLAM in Mobile Robots and Smart AR Revenue million Forecast, by Types 2020 & 2033
- Table 18: Global SLAM in Mobile Robots and Smart AR Revenue million Forecast, by Country 2020 & 2033
- Table 19: United Kingdom SLAM in Mobile Robots and Smart AR Revenue (million) Forecast, by Application 2020 & 2033
- Table 20: Germany SLAM in Mobile Robots and Smart AR Revenue (million) Forecast, by Application 2020 & 2033
- Table 21: France SLAM in Mobile Robots and Smart AR Revenue (million) Forecast, by Application 2020 & 2033
- Table 22: Italy SLAM in Mobile Robots and Smart AR Revenue (million) Forecast, by Application 2020 & 2033
- Table 23: Spain SLAM in Mobile Robots and Smart AR Revenue (million) Forecast, by Application 2020 & 2033
- Table 24: Russia SLAM in Mobile Robots and Smart AR Revenue (million) Forecast, by Application 2020 & 2033
- Table 25: Benelux SLAM in Mobile Robots and Smart AR Revenue (million) Forecast, by Application 2020 & 2033
- Table 26: Nordics SLAM in Mobile Robots and Smart AR Revenue (million) Forecast, by Application 2020 & 2033
- Table 27: Rest of Europe SLAM in Mobile Robots and Smart AR Revenue (million) Forecast, by Application 2020 & 2033
- Table 28: Global SLAM in Mobile Robots and Smart AR Revenue million Forecast, by Application 2020 & 2033
- Table 29: Global SLAM in Mobile Robots and Smart AR Revenue million Forecast, by Types 2020 & 2033
- Table 30: Global SLAM in Mobile Robots and Smart AR Revenue million Forecast, by Country 2020 & 2033
- Table 31: Turkey SLAM in Mobile Robots and Smart AR Revenue (million) Forecast, by Application 2020 & 2033
- Table 32: Israel SLAM in Mobile Robots and Smart AR Revenue (million) Forecast, by Application 2020 & 2033
- Table 33: GCC SLAM in Mobile Robots and Smart AR Revenue (million) Forecast, by Application 2020 & 2033
- Table 34: North Africa SLAM in Mobile Robots and Smart AR Revenue (million) Forecast, by Application 2020 & 2033
- Table 35: South Africa SLAM in Mobile Robots and Smart AR Revenue (million) Forecast, by Application 2020 & 2033
- Table 36: Rest of Middle East & Africa SLAM in Mobile Robots and Smart AR Revenue (million) Forecast, by Application 2020 & 2033
- Table 37: Global SLAM in Mobile Robots and Smart AR Revenue million Forecast, by Application 2020 & 2033
- Table 38: Global SLAM in Mobile Robots and Smart AR Revenue million Forecast, by Types 2020 & 2033
- Table 39: Global SLAM in Mobile Robots and Smart AR Revenue million Forecast, by Country 2020 & 2033
- Table 40: China SLAM in Mobile Robots and Smart AR Revenue (million) Forecast, by Application 2020 & 2033
- Table 41: India SLAM in Mobile Robots and Smart AR Revenue (million) Forecast, by Application 2020 & 2033
- Table 42: Japan SLAM in Mobile Robots and Smart AR Revenue (million) Forecast, by Application 2020 & 2033
- Table 43: South Korea SLAM in Mobile Robots and Smart AR Revenue (million) Forecast, by Application 2020 & 2033
- Table 44: ASEAN SLAM in Mobile Robots and Smart AR Revenue (million) Forecast, by Application 2020 & 2033
- Table 45: Oceania SLAM in Mobile Robots and Smart AR Revenue (million) Forecast, by Application 2020 & 2033
- Table 46: Rest of Asia Pacific SLAM in Mobile Robots and Smart AR Revenue (million) Forecast, by Application 2020 & 2033
Frequently Asked Questions
1. What is the projected Compound Annual Growth Rate (CAGR) of the SLAM in Mobile Robots and Smart AR?
The projected CAGR is approximately 3.3%.
2. Which companies are prominent players in the SLAM in Mobile Robots and Smart AR?
Key companies in the market include MAXST, LG Electronics, Lenovo, Sony, IBM, Exosite, Swisslog (KUKA), Omron Adept, Clearpath Robotics, Vecna, Mobile Industrial Robots, SMP Robotics, Cimcorp Automation, Aethon, Locus Robotics, Fetch Robotics, Hi-Tech Robotic Systemz, Aviation Industry Corporation of China.
3. What are the main segments of the SLAM in Mobile Robots and Smart AR?
The market segments include Application, Types.
4. Can you provide details about the market size?
The market size is estimated to be USD 350.8 million as of 2022.
5. What are some drivers contributing to market growth?
N/A
6. What are the notable trends driving market growth?
N/A
7. Are there any restraints impacting market growth?
N/A
8. Can you provide examples of recent developments in the market?
N/A
9. What pricing options are available for accessing the report?
Pricing options include single-user, multi-user, and enterprise licenses priced at USD 3950.00, USD 5925.00, and USD 7900.00 respectively.
10. Is the market size provided in terms of value or volume?
The market size is provided in terms of value, measured in million.
11. Are there any specific market keywords associated with the report?
Yes, the market keyword associated with the report is "SLAM in Mobile Robots and Smart AR," which aids in identifying and referencing the specific market segment covered.
12. How do I determine which pricing option suits my needs best?
The pricing options vary based on user requirements and access needs. Individual users may opt for single-user licenses, while businesses requiring broader access may choose multi-user or enterprise licenses for cost-effective access to the report.
13. Are there any additional resources or data provided in the SLAM in Mobile Robots and Smart AR report?
While the report offers comprehensive insights, it's advisable to review the specific contents or supplementary materials provided to ascertain if additional resources or data are available.
14. How can I stay updated on further developments or reports in the SLAM in Mobile Robots and Smart AR?
To stay informed about further developments, trends, and reports in the SLAM in Mobile Robots and Smart AR, consider subscribing to industry newsletters, following relevant companies and organizations, or regularly checking reputable industry news sources and publications.
Methodology
Step 1 - Identification of Relevant Samples Size from Population Database


Step 2 - Approaches for Defining Global Market Size (Value, Volume* & Price*)

Note*: In applicable scenarios
Step 3 - Data Sources
Primary Research
- Web Analytics
- Survey Reports
- Research Institute
- Latest Research Reports
- Opinion Leaders
Secondary Research
- Annual Reports
- White Paper
- Latest Press Release
- Industry Association
- Paid Database
- Investor Presentations

Step 4 - Data Triangulation
Involves using different sources of information in order to increase the validity of a study
These sources are likely to be stakeholders in a program - participants, other researchers, program staff, other community members, and so on.
Then we put all data in single framework & apply various statistical tools to find out the dynamic on the market.
During the analysis stage, feedback from the stakeholder groups would be compared to determine areas of agreement as well as areas of divergence