

Key Insights
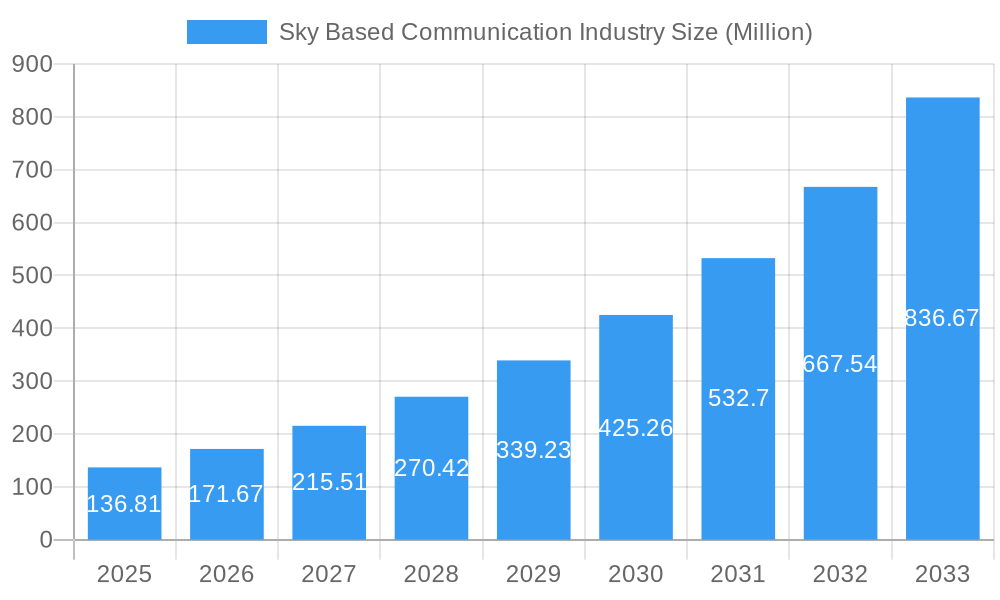
The sky-based communication industry, valued at $136.81 million in 2025, is experiencing robust growth, projected to expand at a Compound Annual Growth Rate (CAGR) of 25.53% from 2025 to 2033. This surge is driven primarily by the increasing demand for high-speed, reliable connectivity in remote areas and the growing adoption of satellite-based internet services for both consumers and businesses. Technological advancements, including the development of low-earth orbit (LEO) satellite constellations and improved satellite technology, further fuel this expansion. The industry benefits from the increasing need for reliable communication in aviation, maritime, and military operations, where terrestrial networks often lack coverage. However, challenges remain, including the high initial investment costs associated with satellite infrastructure and the regulatory complexities surrounding spectrum allocation and international collaborations. Competition among established players and new entrants is intense, requiring companies to continuously innovate and optimize their services to maintain a competitive edge.
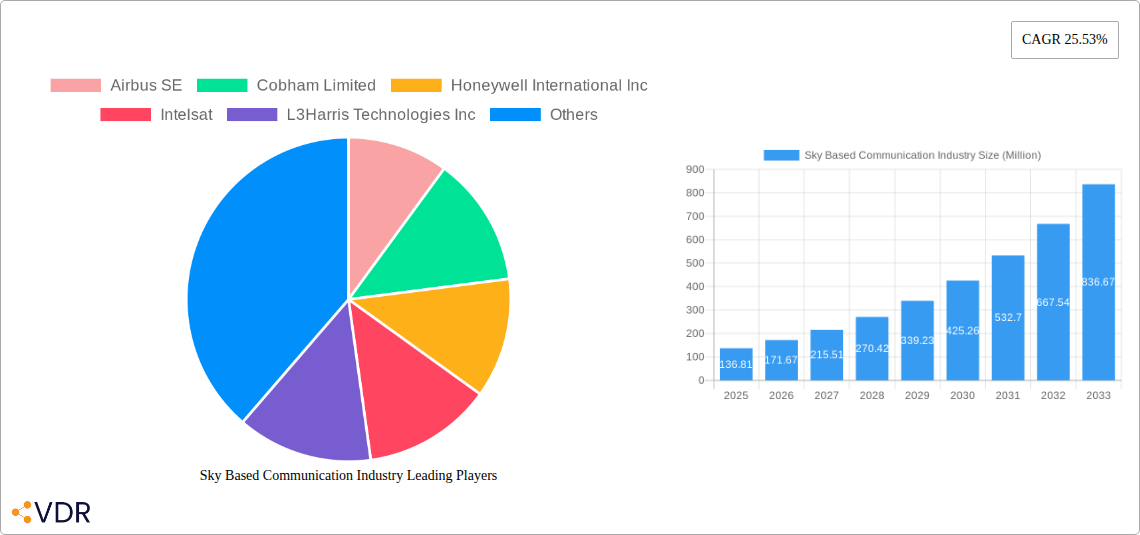
Sky Based Communication Industry Market Size (In Million)
The market segmentation (while not explicitly provided) is likely diverse, encompassing different types of satellite communication technologies (GEO, MEO, LEO), service offerings (broadband, voice, data), and user segments (consumer, enterprise, government). The key players – Airbus SE, Cobham Limited, Honeywell International Inc, Intelsat, L3Harris Technologies Inc, Maxar Technologies Inc, Thales, Viasat Inc, Inmarsat Global Limited, and Iridium Communications Inc – are actively engaged in developing and deploying advanced technologies to capture market share. Regional variations in market penetration are expected, with developed regions like North America and Europe showing strong adoption rates, while emerging markets in Asia-Pacific and Latin America present significant growth opportunities. The forecast period (2025-2033) indicates continued expansion, predicated on ongoing technological progress and increasing global connectivity demands.
Sky Based Communication Industry Company Market Share
Sky Based Communication Industry Market Report: 2019-2033
This comprehensive report provides a detailed analysis of the sky-based communication industry, encompassing market dynamics, growth trends, regional performance, product landscape, key players, and future outlook. The study period covers 2019-2033, with 2025 as the base and estimated year. This report is crucial for industry professionals, investors, and strategic decision-makers seeking to understand and capitalize on the opportunities within this rapidly evolving sector. The report analyzes the parent market of Satellite Communication and the child market of Aerospace and Defense Communication.
Expected Market Size (Million USD): Historical Period (2019-2024): xx, Base Year (2025): 1200, Estimated Year (2025): 1200, Forecast Period (2025-2033): xx.
Sky Based Communication Industry Market Dynamics & Structure
The sky-based communication market is characterized by moderate concentration, with a few major players holding significant market share. Technological innovation, driven by advancements in satellite technology, bandwidth capabilities, and network optimization, is a primary growth driver. Stringent regulatory frameworks governing spectrum allocation and satellite deployment influence market dynamics. Competitive pressures stem from both established players and emerging entrants offering alternative communication solutions. The end-user base encompasses government agencies (military and civilian), commercial airlines, maritime businesses, and increasingly, the burgeoning consumer market for global broadband access. Mergers and acquisitions (M&A) activity has been notable, with larger companies consolidating their market positions through strategic acquisitions of smaller, specialized firms.
- Market Concentration: Moderately concentrated, with top 5 players holding approximately 60% market share (2025 estimate).
- Technological Innovation: Key drivers include LEO satellite constellations, improved antenna technology, and advanced data encryption.
- Regulatory Framework: Strict licensing and spectrum allocation policies impact market entry and expansion.
- Competitive Substitutes: Terrestrial communication networks and fiber optics pose some competitive pressure.
- End-User Demographics: Government, commercial aviation, maritime, and consumer markets are key end-users.
- M&A Trends: Significant M&A activity observed in the past 5 years, with an average of 15 deals annually (2019-2024).
Sky Based Communication Industry Growth Trends & Insights
The sky-based communication market is experiencing robust growth, driven by increasing demand for high-bandwidth connectivity across diverse sectors. Adoption rates are accelerating, particularly in regions with limited terrestrial infrastructure. Technological disruptions, such as the proliferation of Low Earth Orbit (LEO) satellite constellations, are transforming market dynamics. Consumer behavior is shifting towards greater reliance on seamless global connectivity, fueling demand for enhanced services. The market is expected to exhibit a Compound Annual Growth Rate (CAGR) of approximately 10% during the forecast period (2025-2033), with market penetration steadily increasing across various end-user segments.
Dominant Regions, Countries, or Segments in Sky Based Communication Industry
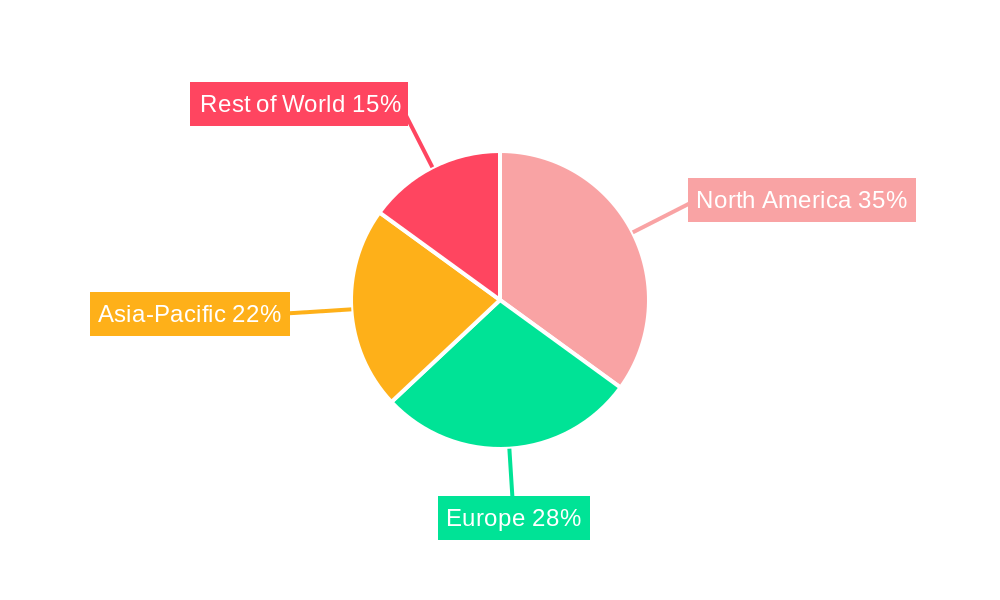
North America currently dominates the sky-based communication market, driven by strong government spending on defense and aerospace technologies, as well as a highly developed commercial aviation sector. Europe holds a significant market share, owing to its advanced technological capabilities and strong regulatory frameworks. The Asia-Pacific region is demonstrating rapid growth, fueled by increasing investments in infrastructure and the expansion of high-bandwidth services.
- Key Drivers in North America: High government spending, robust aerospace industry, and advanced technological capabilities.
- Key Drivers in Europe: Strong regulatory frameworks, advanced technological infrastructure, and a large commercial aviation sector.
- Key Drivers in Asia-Pacific: Increasing infrastructure investments, expanding telecommunications networks, and rising consumer demand.
- Market Share (2025 Estimate): North America (45%), Europe (30%), Asia-Pacific (15%), Rest of World (10%).
Sky Based Communication Industry Product Landscape
The sky-based communication market offers a range of products, including satellite terminals, modems, antennas, and ground control systems. Technological advancements focus on enhancing bandwidth, latency, and data security. Unique selling propositions often involve superior coverage, improved reliability, and integrated solutions. Recent innovations include advanced encryption methods, miniaturized terminals, and higher-throughput satellite constellations.
Key Drivers, Barriers & Challenges in Sky Based Communication Industry
Key Drivers: Increasing demand for high-bandwidth connectivity, technological advancements, government initiatives, and growing adoption of IoT devices.
Key Challenges: High initial investment costs, regulatory hurdles related to spectrum allocation, competition from terrestrial networks, and supply chain vulnerabilities. Quantifiable impact of supply chain disruptions estimated to reduce market growth by 2% annually (2025-2028).
Emerging Opportunities in Sky Based Communication Industry
Emerging opportunities include expanding connectivity in underserved regions, development of new applications for IoT devices, and the integration of sky-based communications with other technologies. The growing demand for reliable high-speed internet access in remote locations and the increasing adoption of autonomous vehicles and drones present significant growth potential.
Growth Accelerators in the Sky Based Communication Industry
Long-term growth will be driven by technological advancements, strategic partnerships between satellite operators and technology providers, and expansion into new markets. Investments in next-generation satellite constellations and improved ground infrastructure will be crucial.
Key Players Shaping the Sky Based Communication Industry Market
Notable Milestones in Sky Based Communication Industry Sector
- February 2024: Northrop Grumman awarded Viasat Inc. a contract to integrate Viasat-3 into US Air Force operations.
- October 2023: Honeywell secured a USD 900 million contract from the US Space Force for its Proliferated Low Earth Orbit program.
In-Depth Sky Based Communication Industry Market Outlook
The sky-based communication market is poised for continued strong growth, driven by technological innovation and increasing demand for global connectivity. Strategic partnerships and investments in next-generation satellite constellations will be key to unlocking further market potential. The market is expected to witness significant expansion in emerging economies, driven by rising disposable incomes and increased infrastructure development.
Sky Based Communication Industry Segmentation
-
1. Application
- 1.1. Telecommunication
- 1.2. Broadband
- 1.3. Navigation
- 1.4. Remote Sensing
- 1.5. Broadcasting
- 1.6. Other Applications
-
2. Type
- 2.1. Low Earth Orbit (LEO)
- 2.2. Medium Earth Orbit (MEO)
-
3. End User
- 3.1. Military and Government
- 3.2. Commercial
Sky Based Communication Industry Segmentation By Geography
-
1. North America
- 1.1. United States
- 1.2. Canada
-
2. Europe
- 2.1. United Kingdom
- 2.2. France
- 2.3. Germany
- 2.4. Russia
- 2.5. Rest of Europe
-
3. Asia Pacific
- 3.1. India
- 3.2. China
- 3.3. Japan
- 3.4. South Korea
- 3.5. Rest of Asia Pacific
-
4. Latin America
- 4.1. Brazil
- 4.2. Rest of Latin America
-
5. Middle East and Africa
- 5.1. United Arab Emirates
- 5.2. Saudi Arabia
- 5.3. Israel
- 5.4. Rest of Middle East and Africa
Sky Based Communication Industry Regional Market Share
Geographic Coverage of Sky Based Communication Industry
Sky Based Communication Industry REPORT HIGHLIGHTS
| Aspects | Details |
|---|---|
| Study Period | 2020-2034 |
| Base Year | 2025 |
| Estimated Year | 2026 |
| Forecast Period | 2026-2034 |
| Historical Period | 2020-2025 |
| Growth Rate | CAGR of 25.53% from 2020-2034 |
| Segmentation |
|
Table of Contents
- 1. Introduction
- 1.1. Research Scope
- 1.2. Market Segmentation
- 1.3. Research Objective
- 1.4. Definitions and Assumptions
- 2. Executive Summary
- 2.1. Market Snapshot
- 3. Market Dynamics
- 3.1. Market Drivers
- 3.2. Market Restrains
- 3.3. Market Trends
- 3.4. Market Opportunities
- 4. Market Factor Analysis
- 4.1. Porters Five Forces
- 4.1.1. Bargaining Power of Suppliers
- 4.1.2. Bargaining Power of Buyers
- 4.1.3. Threat of New Entrants
- 4.1.4. Threat of Substitutes
- 4.1.5. Competitive Rivalry
- 4.2. PESTEL analysis
- 4.3. BCG Analysis
- 4.3.1. Stars (High Growth, High Market Share)
- 4.3.2. Cash Cows (Low Growth, High Market Share)
- 4.3.3. Question Mark (High Growth, Low Market Share)
- 4.3.4. Dogs (Low Growth, Low Market Share)
- 4.4. Ansoff Matrix Analysis
- 4.5. Supply Chain Analysis
- 4.6. Regulatory Landscape
- 4.7. Current Market Potential and Opportunity Assessment (TAM–SAM–SOM Framework)
- 4.8. VDR Analyst Note
- 4.1. Porters Five Forces
- 5. Market Analysis, Insights and Forecast 2021-2033
- 5.1. Market Analysis, Insights and Forecast - by Application
- 5.1.1. Telecommunication
- 5.1.2. Broadband
- 5.1.3. Navigation
- 5.1.4. Remote Sensing
- 5.1.5. Broadcasting
- 5.1.6. Other Applications
- 5.2. Market Analysis, Insights and Forecast - by Type
- 5.2.1. Low Earth Orbit (LEO)
- 5.2.2. Medium Earth Orbit (MEO)
- 5.3. Market Analysis, Insights and Forecast - by End User
- 5.3.1. Military and Government
- 5.3.2. Commercial
- 5.4. Market Analysis, Insights and Forecast - by Region
- 5.4.1. North America
- 5.4.2. Europe
- 5.4.3. Asia Pacific
- 5.4.4. Latin America
- 5.4.5. Middle East and Africa
- 5.1. Market Analysis, Insights and Forecast - by Application
- 6. Global Sky Based Communication Industry Analysis, Insights and Forecast, 2021-2033
- 6.1. Market Analysis, Insights and Forecast - by Application
- 6.1.1. Telecommunication
- 6.1.2. Broadband
- 6.1.3. Navigation
- 6.1.4. Remote Sensing
- 6.1.5. Broadcasting
- 6.1.6. Other Applications
- 6.2. Market Analysis, Insights and Forecast - by Type
- 6.2.1. Low Earth Orbit (LEO)
- 6.2.2. Medium Earth Orbit (MEO)
- 6.3. Market Analysis, Insights and Forecast - by End User
- 6.3.1. Military and Government
- 6.3.2. Commercial
- 6.1. Market Analysis, Insights and Forecast - by Application
- 7. North America Sky Based Communication Industry Analysis, Insights and Forecast, 2021-2033
- 7.1. Market Analysis, Insights and Forecast - by Application
- 7.1.1. Telecommunication
- 7.1.2. Broadband
- 7.1.3. Navigation
- 7.1.4. Remote Sensing
- 7.1.5. Broadcasting
- 7.1.6. Other Applications
- 7.2. Market Analysis, Insights and Forecast - by Type
- 7.2.1. Low Earth Orbit (LEO)
- 7.2.2. Medium Earth Orbit (MEO)
- 7.3. Market Analysis, Insights and Forecast - by End User
- 7.3.1. Military and Government
- 7.3.2. Commercial
- 7.1. Market Analysis, Insights and Forecast - by Application
- 8. Europe Sky Based Communication Industry Analysis, Insights and Forecast, 2021-2033
- 8.1. Market Analysis, Insights and Forecast - by Application
- 8.1.1. Telecommunication
- 8.1.2. Broadband
- 8.1.3. Navigation
- 8.1.4. Remote Sensing
- 8.1.5. Broadcasting
- 8.1.6. Other Applications
- 8.2. Market Analysis, Insights and Forecast - by Type
- 8.2.1. Low Earth Orbit (LEO)
- 8.2.2. Medium Earth Orbit (MEO)
- 8.3. Market Analysis, Insights and Forecast - by End User
- 8.3.1. Military and Government
- 8.3.2. Commercial
- 8.1. Market Analysis, Insights and Forecast - by Application
- 9. Asia Pacific Sky Based Communication Industry Analysis, Insights and Forecast, 2021-2033
- 9.1. Market Analysis, Insights and Forecast - by Application
- 9.1.1. Telecommunication
- 9.1.2. Broadband
- 9.1.3. Navigation
- 9.1.4. Remote Sensing
- 9.1.5. Broadcasting
- 9.1.6. Other Applications
- 9.2. Market Analysis, Insights and Forecast - by Type
- 9.2.1. Low Earth Orbit (LEO)
- 9.2.2. Medium Earth Orbit (MEO)
- 9.3. Market Analysis, Insights and Forecast - by End User
- 9.3.1. Military and Government
- 9.3.2. Commercial
- 9.1. Market Analysis, Insights and Forecast - by Application
- 10. Latin America Sky Based Communication Industry Analysis, Insights and Forecast, 2021-2033
- 10.1. Market Analysis, Insights and Forecast - by Application
- 10.1.1. Telecommunication
- 10.1.2. Broadband
- 10.1.3. Navigation
- 10.1.4. Remote Sensing
- 10.1.5. Broadcasting
- 10.1.6. Other Applications
- 10.2. Market Analysis, Insights and Forecast - by Type
- 10.2.1. Low Earth Orbit (LEO)
- 10.2.2. Medium Earth Orbit (MEO)
- 10.3. Market Analysis, Insights and Forecast - by End User
- 10.3.1. Military and Government
- 10.3.2. Commercial
- 10.1. Market Analysis, Insights and Forecast - by Application
- 11. Middle East and Africa Sky Based Communication Industry Analysis, Insights and Forecast, 2021-2033
- 11.1. Market Analysis, Insights and Forecast - by Application
- 11.1.1. Telecommunication
- 11.1.2. Broadband
- 11.1.3. Navigation
- 11.1.4. Remote Sensing
- 11.1.5. Broadcasting
- 11.1.6. Other Applications
- 11.2. Market Analysis, Insights and Forecast - by Type
- 11.2.1. Low Earth Orbit (LEO)
- 11.2.2. Medium Earth Orbit (MEO)
- 11.3. Market Analysis, Insights and Forecast - by End User
- 11.3.1. Military and Government
- 11.3.2. Commercial
- 11.1. Market Analysis, Insights and Forecast - by Application
- 12. Competitive Analysis
- 12.1. Company Profiles
- 12.1.1 Airbus SE
- 12.1.1.1. Company Overview
- 12.1.1.2. Products
- 12.1.1.3. Company Financials
- 12.1.1.4. SWOT Analysis
- 12.1.2 Cobham Limited
- 12.1.2.1. Company Overview
- 12.1.2.2. Products
- 12.1.2.3. Company Financials
- 12.1.2.4. SWOT Analysis
- 12.1.3 Honeywell International Inc
- 12.1.3.1. Company Overview
- 12.1.3.2. Products
- 12.1.3.3. Company Financials
- 12.1.3.4. SWOT Analysis
- 12.1.4 Intelsat
- 12.1.4.1. Company Overview
- 12.1.4.2. Products
- 12.1.4.3. Company Financials
- 12.1.4.4. SWOT Analysis
- 12.1.5 L3Harris Technologies Inc
- 12.1.5.1. Company Overview
- 12.1.5.2. Products
- 12.1.5.3. Company Financials
- 12.1.5.4. SWOT Analysis
- 12.1.6 Maxar Technologies Inc
- 12.1.6.1. Company Overview
- 12.1.6.2. Products
- 12.1.6.3. Company Financials
- 12.1.6.4. SWOT Analysis
- 12.1.7 THALES
- 12.1.7.1. Company Overview
- 12.1.7.2. Products
- 12.1.7.3. Company Financials
- 12.1.7.4. SWOT Analysis
- 12.1.8 Viasat Inc
- 12.1.8.1. Company Overview
- 12.1.8.2. Products
- 12.1.8.3. Company Financials
- 12.1.8.4. SWOT Analysis
- 12.1.9 Inmarsat Global Limited
- 12.1.9.1. Company Overview
- 12.1.9.2. Products
- 12.1.9.3. Company Financials
- 12.1.9.4. SWOT Analysis
- 12.1.10 Iridium Communications Inc
- 12.1.10.1. Company Overview
- 12.1.10.2. Products
- 12.1.10.3. Company Financials
- 12.1.10.4. SWOT Analysis
- 12.1.1 Airbus SE
- 12.2. Market Entropy
- 12.2.1 Company's Key Areas Served
- 12.2.2 Recent Developments
- 12.3. Company Market Share Analysis 2025
- 12.3.1 Top 5 Companies Market Share Analysis
- 12.3.2 Top 3 Companies Market Share Analysis
- 12.4. List of Potential Customers
- 13. Research Methodology
List of Figures
- Figure 1: Global Sky Based Communication Industry Revenue Breakdown (Million, %) by Region 2025 & 2033
- Figure 2: Global Sky Based Communication Industry Volume Breakdown (Billion, %) by Region 2025 & 2033
- Figure 3: North America Sky Based Communication Industry Revenue (Million), by Application 2025 & 2033
- Figure 4: North America Sky Based Communication Industry Volume (Billion), by Application 2025 & 2033
- Figure 5: North America Sky Based Communication Industry Revenue Share (%), by Application 2025 & 2033
- Figure 6: North America Sky Based Communication Industry Volume Share (%), by Application 2025 & 2033
- Figure 7: North America Sky Based Communication Industry Revenue (Million), by Type 2025 & 2033
- Figure 8: North America Sky Based Communication Industry Volume (Billion), by Type 2025 & 2033
- Figure 9: North America Sky Based Communication Industry Revenue Share (%), by Type 2025 & 2033
- Figure 10: North America Sky Based Communication Industry Volume Share (%), by Type 2025 & 2033
- Figure 11: North America Sky Based Communication Industry Revenue (Million), by End User 2025 & 2033
- Figure 12: North America Sky Based Communication Industry Volume (Billion), by End User 2025 & 2033
- Figure 13: North America Sky Based Communication Industry Revenue Share (%), by End User 2025 & 2033
- Figure 14: North America Sky Based Communication Industry Volume Share (%), by End User 2025 & 2033
- Figure 15: North America Sky Based Communication Industry Revenue (Million), by Country 2025 & 2033
- Figure 16: North America Sky Based Communication Industry Volume (Billion), by Country 2025 & 2033
- Figure 17: North America Sky Based Communication Industry Revenue Share (%), by Country 2025 & 2033
- Figure 18: North America Sky Based Communication Industry Volume Share (%), by Country 2025 & 2033
- Figure 19: Europe Sky Based Communication Industry Revenue (Million), by Application 2025 & 2033
- Figure 20: Europe Sky Based Communication Industry Volume (Billion), by Application 2025 & 2033
- Figure 21: Europe Sky Based Communication Industry Revenue Share (%), by Application 2025 & 2033
- Figure 22: Europe Sky Based Communication Industry Volume Share (%), by Application 2025 & 2033
- Figure 23: Europe Sky Based Communication Industry Revenue (Million), by Type 2025 & 2033
- Figure 24: Europe Sky Based Communication Industry Volume (Billion), by Type 2025 & 2033
- Figure 25: Europe Sky Based Communication Industry Revenue Share (%), by Type 2025 & 2033
- Figure 26: Europe Sky Based Communication Industry Volume Share (%), by Type 2025 & 2033
- Figure 27: Europe Sky Based Communication Industry Revenue (Million), by End User 2025 & 2033
- Figure 28: Europe Sky Based Communication Industry Volume (Billion), by End User 2025 & 2033
- Figure 29: Europe Sky Based Communication Industry Revenue Share (%), by End User 2025 & 2033
- Figure 30: Europe Sky Based Communication Industry Volume Share (%), by End User 2025 & 2033
- Figure 31: Europe Sky Based Communication Industry Revenue (Million), by Country 2025 & 2033
- Figure 32: Europe Sky Based Communication Industry Volume (Billion), by Country 2025 & 2033
- Figure 33: Europe Sky Based Communication Industry Revenue Share (%), by Country 2025 & 2033
- Figure 34: Europe Sky Based Communication Industry Volume Share (%), by Country 2025 & 2033
- Figure 35: Asia Pacific Sky Based Communication Industry Revenue (Million), by Application 2025 & 2033
- Figure 36: Asia Pacific Sky Based Communication Industry Volume (Billion), by Application 2025 & 2033
- Figure 37: Asia Pacific Sky Based Communication Industry Revenue Share (%), by Application 2025 & 2033
- Figure 38: Asia Pacific Sky Based Communication Industry Volume Share (%), by Application 2025 & 2033
- Figure 39: Asia Pacific Sky Based Communication Industry Revenue (Million), by Type 2025 & 2033
- Figure 40: Asia Pacific Sky Based Communication Industry Volume (Billion), by Type 2025 & 2033
- Figure 41: Asia Pacific Sky Based Communication Industry Revenue Share (%), by Type 2025 & 2033
- Figure 42: Asia Pacific Sky Based Communication Industry Volume Share (%), by Type 2025 & 2033
- Figure 43: Asia Pacific Sky Based Communication Industry Revenue (Million), by End User 2025 & 2033
- Figure 44: Asia Pacific Sky Based Communication Industry Volume (Billion), by End User 2025 & 2033
- Figure 45: Asia Pacific Sky Based Communication Industry Revenue Share (%), by End User 2025 & 2033
- Figure 46: Asia Pacific Sky Based Communication Industry Volume Share (%), by End User 2025 & 2033
- Figure 47: Asia Pacific Sky Based Communication Industry Revenue (Million), by Country 2025 & 2033
- Figure 48: Asia Pacific Sky Based Communication Industry Volume (Billion), by Country 2025 & 2033
- Figure 49: Asia Pacific Sky Based Communication Industry Revenue Share (%), by Country 2025 & 2033
- Figure 50: Asia Pacific Sky Based Communication Industry Volume Share (%), by Country 2025 & 2033
- Figure 51: Latin America Sky Based Communication Industry Revenue (Million), by Application 2025 & 2033
- Figure 52: Latin America Sky Based Communication Industry Volume (Billion), by Application 2025 & 2033
- Figure 53: Latin America Sky Based Communication Industry Revenue Share (%), by Application 2025 & 2033
- Figure 54: Latin America Sky Based Communication Industry Volume Share (%), by Application 2025 & 2033
- Figure 55: Latin America Sky Based Communication Industry Revenue (Million), by Type 2025 & 2033
- Figure 56: Latin America Sky Based Communication Industry Volume (Billion), by Type 2025 & 2033
- Figure 57: Latin America Sky Based Communication Industry Revenue Share (%), by Type 2025 & 2033
- Figure 58: Latin America Sky Based Communication Industry Volume Share (%), by Type 2025 & 2033
- Figure 59: Latin America Sky Based Communication Industry Revenue (Million), by End User 2025 & 2033
- Figure 60: Latin America Sky Based Communication Industry Volume (Billion), by End User 2025 & 2033
- Figure 61: Latin America Sky Based Communication Industry Revenue Share (%), by End User 2025 & 2033
- Figure 62: Latin America Sky Based Communication Industry Volume Share (%), by End User 2025 & 2033
- Figure 63: Latin America Sky Based Communication Industry Revenue (Million), by Country 2025 & 2033
- Figure 64: Latin America Sky Based Communication Industry Volume (Billion), by Country 2025 & 2033
- Figure 65: Latin America Sky Based Communication Industry Revenue Share (%), by Country 2025 & 2033
- Figure 66: Latin America Sky Based Communication Industry Volume Share (%), by Country 2025 & 2033
- Figure 67: Middle East and Africa Sky Based Communication Industry Revenue (Million), by Application 2025 & 2033
- Figure 68: Middle East and Africa Sky Based Communication Industry Volume (Billion), by Application 2025 & 2033
- Figure 69: Middle East and Africa Sky Based Communication Industry Revenue Share (%), by Application 2025 & 2033
- Figure 70: Middle East and Africa Sky Based Communication Industry Volume Share (%), by Application 2025 & 2033
- Figure 71: Middle East and Africa Sky Based Communication Industry Revenue (Million), by Type 2025 & 2033
- Figure 72: Middle East and Africa Sky Based Communication Industry Volume (Billion), by Type 2025 & 2033
- Figure 73: Middle East and Africa Sky Based Communication Industry Revenue Share (%), by Type 2025 & 2033
- Figure 74: Middle East and Africa Sky Based Communication Industry Volume Share (%), by Type 2025 & 2033
- Figure 75: Middle East and Africa Sky Based Communication Industry Revenue (Million), by End User 2025 & 2033
- Figure 76: Middle East and Africa Sky Based Communication Industry Volume (Billion), by End User 2025 & 2033
- Figure 77: Middle East and Africa Sky Based Communication Industry Revenue Share (%), by End User 2025 & 2033
- Figure 78: Middle East and Africa Sky Based Communication Industry Volume Share (%), by End User 2025 & 2033
- Figure 79: Middle East and Africa Sky Based Communication Industry Revenue (Million), by Country 2025 & 2033
- Figure 80: Middle East and Africa Sky Based Communication Industry Volume (Billion), by Country 2025 & 2033
- Figure 81: Middle East and Africa Sky Based Communication Industry Revenue Share (%), by Country 2025 & 2033
- Figure 82: Middle East and Africa Sky Based Communication Industry Volume Share (%), by Country 2025 & 2033
List of Tables
- Table 1: Global Sky Based Communication Industry Revenue Million Forecast, by Application 2020 & 2033
- Table 2: Global Sky Based Communication Industry Volume Billion Forecast, by Application 2020 & 2033
- Table 3: Global Sky Based Communication Industry Revenue Million Forecast, by Type 2020 & 2033
- Table 4: Global Sky Based Communication Industry Volume Billion Forecast, by Type 2020 & 2033
- Table 5: Global Sky Based Communication Industry Revenue Million Forecast, by End User 2020 & 2033
- Table 6: Global Sky Based Communication Industry Volume Billion Forecast, by End User 2020 & 2033
- Table 7: Global Sky Based Communication Industry Revenue Million Forecast, by Region 2020 & 2033
- Table 8: Global Sky Based Communication Industry Volume Billion Forecast, by Region 2020 & 2033
- Table 9: Global Sky Based Communication Industry Revenue Million Forecast, by Application 2020 & 2033
- Table 10: Global Sky Based Communication Industry Volume Billion Forecast, by Application 2020 & 2033
- Table 11: Global Sky Based Communication Industry Revenue Million Forecast, by Type 2020 & 2033
- Table 12: Global Sky Based Communication Industry Volume Billion Forecast, by Type 2020 & 2033
- Table 13: Global Sky Based Communication Industry Revenue Million Forecast, by End User 2020 & 2033
- Table 14: Global Sky Based Communication Industry Volume Billion Forecast, by End User 2020 & 2033
- Table 15: Global Sky Based Communication Industry Revenue Million Forecast, by Country 2020 & 2033
- Table 16: Global Sky Based Communication Industry Volume Billion Forecast, by Country 2020 & 2033
- Table 17: United States Sky Based Communication Industry Revenue (Million) Forecast, by Application 2020 & 2033
- Table 18: United States Sky Based Communication Industry Volume (Billion) Forecast, by Application 2020 & 2033
- Table 19: Canada Sky Based Communication Industry Revenue (Million) Forecast, by Application 2020 & 2033
- Table 20: Canada Sky Based Communication Industry Volume (Billion) Forecast, by Application 2020 & 2033
- Table 21: Global Sky Based Communication Industry Revenue Million Forecast, by Application 2020 & 2033
- Table 22: Global Sky Based Communication Industry Volume Billion Forecast, by Application 2020 & 2033
- Table 23: Global Sky Based Communication Industry Revenue Million Forecast, by Type 2020 & 2033
- Table 24: Global Sky Based Communication Industry Volume Billion Forecast, by Type 2020 & 2033
- Table 25: Global Sky Based Communication Industry Revenue Million Forecast, by End User 2020 & 2033
- Table 26: Global Sky Based Communication Industry Volume Billion Forecast, by End User 2020 & 2033
- Table 27: Global Sky Based Communication Industry Revenue Million Forecast, by Country 2020 & 2033
- Table 28: Global Sky Based Communication Industry Volume Billion Forecast, by Country 2020 & 2033
- Table 29: United Kingdom Sky Based Communication Industry Revenue (Million) Forecast, by Application 2020 & 2033
- Table 30: United Kingdom Sky Based Communication Industry Volume (Billion) Forecast, by Application 2020 & 2033
- Table 31: France Sky Based Communication Industry Revenue (Million) Forecast, by Application 2020 & 2033
- Table 32: France Sky Based Communication Industry Volume (Billion) Forecast, by Application 2020 & 2033
- Table 33: Germany Sky Based Communication Industry Revenue (Million) Forecast, by Application 2020 & 2033
- Table 34: Germany Sky Based Communication Industry Volume (Billion) Forecast, by Application 2020 & 2033
- Table 35: Russia Sky Based Communication Industry Revenue (Million) Forecast, by Application 2020 & 2033
- Table 36: Russia Sky Based Communication Industry Volume (Billion) Forecast, by Application 2020 & 2033
- Table 37: Rest of Europe Sky Based Communication Industry Revenue (Million) Forecast, by Application 2020 & 2033
- Table 38: Rest of Europe Sky Based Communication Industry Volume (Billion) Forecast, by Application 2020 & 2033
- Table 39: Global Sky Based Communication Industry Revenue Million Forecast, by Application 2020 & 2033
- Table 40: Global Sky Based Communication Industry Volume Billion Forecast, by Application 2020 & 2033
- Table 41: Global Sky Based Communication Industry Revenue Million Forecast, by Type 2020 & 2033
- Table 42: Global Sky Based Communication Industry Volume Billion Forecast, by Type 2020 & 2033
- Table 43: Global Sky Based Communication Industry Revenue Million Forecast, by End User 2020 & 2033
- Table 44: Global Sky Based Communication Industry Volume Billion Forecast, by End User 2020 & 2033
- Table 45: Global Sky Based Communication Industry Revenue Million Forecast, by Country 2020 & 2033
- Table 46: Global Sky Based Communication Industry Volume Billion Forecast, by Country 2020 & 2033
- Table 47: India Sky Based Communication Industry Revenue (Million) Forecast, by Application 2020 & 2033
- Table 48: India Sky Based Communication Industry Volume (Billion) Forecast, by Application 2020 & 2033
- Table 49: China Sky Based Communication Industry Revenue (Million) Forecast, by Application 2020 & 2033
- Table 50: China Sky Based Communication Industry Volume (Billion) Forecast, by Application 2020 & 2033
- Table 51: Japan Sky Based Communication Industry Revenue (Million) Forecast, by Application 2020 & 2033
- Table 52: Japan Sky Based Communication Industry Volume (Billion) Forecast, by Application 2020 & 2033
- Table 53: South Korea Sky Based Communication Industry Revenue (Million) Forecast, by Application 2020 & 2033
- Table 54: South Korea Sky Based Communication Industry Volume (Billion) Forecast, by Application 2020 & 2033
- Table 55: Rest of Asia Pacific Sky Based Communication Industry Revenue (Million) Forecast, by Application 2020 & 2033
- Table 56: Rest of Asia Pacific Sky Based Communication Industry Volume (Billion) Forecast, by Application 2020 & 2033
- Table 57: Global Sky Based Communication Industry Revenue Million Forecast, by Application 2020 & 2033
- Table 58: Global Sky Based Communication Industry Volume Billion Forecast, by Application 2020 & 2033
- Table 59: Global Sky Based Communication Industry Revenue Million Forecast, by Type 2020 & 2033
- Table 60: Global Sky Based Communication Industry Volume Billion Forecast, by Type 2020 & 2033
- Table 61: Global Sky Based Communication Industry Revenue Million Forecast, by End User 2020 & 2033
- Table 62: Global Sky Based Communication Industry Volume Billion Forecast, by End User 2020 & 2033
- Table 63: Global Sky Based Communication Industry Revenue Million Forecast, by Country 2020 & 2033
- Table 64: Global Sky Based Communication Industry Volume Billion Forecast, by Country 2020 & 2033
- Table 65: Brazil Sky Based Communication Industry Revenue (Million) Forecast, by Application 2020 & 2033
- Table 66: Brazil Sky Based Communication Industry Volume (Billion) Forecast, by Application 2020 & 2033
- Table 67: Rest of Latin America Sky Based Communication Industry Revenue (Million) Forecast, by Application 2020 & 2033
- Table 68: Rest of Latin America Sky Based Communication Industry Volume (Billion) Forecast, by Application 2020 & 2033
- Table 69: Global Sky Based Communication Industry Revenue Million Forecast, by Application 2020 & 2033
- Table 70: Global Sky Based Communication Industry Volume Billion Forecast, by Application 2020 & 2033
- Table 71: Global Sky Based Communication Industry Revenue Million Forecast, by Type 2020 & 2033
- Table 72: Global Sky Based Communication Industry Volume Billion Forecast, by Type 2020 & 2033
- Table 73: Global Sky Based Communication Industry Revenue Million Forecast, by End User 2020 & 2033
- Table 74: Global Sky Based Communication Industry Volume Billion Forecast, by End User 2020 & 2033
- Table 75: Global Sky Based Communication Industry Revenue Million Forecast, by Country 2020 & 2033
- Table 76: Global Sky Based Communication Industry Volume Billion Forecast, by Country 2020 & 2033
- Table 77: United Arab Emirates Sky Based Communication Industry Revenue (Million) Forecast, by Application 2020 & 2033
- Table 78: United Arab Emirates Sky Based Communication Industry Volume (Billion) Forecast, by Application 2020 & 2033
- Table 79: Saudi Arabia Sky Based Communication Industry Revenue (Million) Forecast, by Application 2020 & 2033
- Table 80: Saudi Arabia Sky Based Communication Industry Volume (Billion) Forecast, by Application 2020 & 2033
- Table 81: Israel Sky Based Communication Industry Revenue (Million) Forecast, by Application 2020 & 2033
- Table 82: Israel Sky Based Communication Industry Volume (Billion) Forecast, by Application 2020 & 2033
- Table 83: Rest of Middle East and Africa Sky Based Communication Industry Revenue (Million) Forecast, by Application 2020 & 2033
- Table 84: Rest of Middle East and Africa Sky Based Communication Industry Volume (Billion) Forecast, by Application 2020 & 2033
Frequently Asked Questions
1. What is the projected Compound Annual Growth Rate (CAGR) of the Sky Based Communication Industry?
The projected CAGR is approximately 25.53%.
2. Which companies are prominent players in the Sky Based Communication Industry?
Key companies in the market include Airbus SE, Cobham Limited, Honeywell International Inc, Intelsat, L3Harris Technologies Inc, Maxar Technologies Inc, THALES, Viasat Inc, Inmarsat Global Limited, Iridium Communications Inc.
3. What are the main segments of the Sky Based Communication Industry?
The market segments include Application, Type, End User.
4. Can you provide details about the market size?
The market size is estimated to be USD 136.81 Million as of 2022.
5. What are some drivers contributing to market growth?
N/A
6. What are the notable trends driving market growth?
The Low Earth Orbit (LEO) Segment is Expected to Dominate the Market During the Forecast Period.
7. Are there any restraints impacting market growth?
N/A
8. Can you provide examples of recent developments in the market?
February 2024: Northrop Grumman awarded Viasat Inc. a contract to bolster the US Air Force Research Laboratory (AFRL) initiative. Under this agreement, Viasat will deploy its ViaSat-3 Satellite Communications Network, facilitating seamless, high-bandwidth satellite internet access for military personnel aboard USAF aircraft and ground vehicles.
9. What pricing options are available for accessing the report?
Pricing options include single-user, multi-user, and enterprise licenses priced at USD 4750, USD 5250, and USD 8750 respectively.
10. Is the market size provided in terms of value or volume?
The market size is provided in terms of value, measured in Million and volume, measured in Billion.
11. Are there any specific market keywords associated with the report?
Yes, the market keyword associated with the report is "Sky Based Communication Industry," which aids in identifying and referencing the specific market segment covered.
12. How do I determine which pricing option suits my needs best?
The pricing options vary based on user requirements and access needs. Individual users may opt for single-user licenses, while businesses requiring broader access may choose multi-user or enterprise licenses for cost-effective access to the report.
13. Are there any additional resources or data provided in the Sky Based Communication Industry report?
While the report offers comprehensive insights, it's advisable to review the specific contents or supplementary materials provided to ascertain if additional resources or data are available.
14. How can I stay updated on further developments or reports in the Sky Based Communication Industry?
To stay informed about further developments, trends, and reports in the Sky Based Communication Industry, consider subscribing to industry newsletters, following relevant companies and organizations, or regularly checking reputable industry news sources and publications.
Methodology
Step 1 - Identification of Relevant Samples Size from Population Database


Step 2 - Approaches for Defining Global Market Size (Value, Volume* & Price*)

Note*: In applicable scenarios
Step 3 - Data Sources
Primary Research
- Web Analytics
- Survey Reports
- Research Institute
- Latest Research Reports
- Opinion Leaders
Secondary Research
- Annual Reports
- White Paper
- Latest Press Release
- Industry Association
- Paid Database
- Investor Presentations

Step 4 - Data Triangulation
Involves using different sources of information in order to increase the validity of a study
These sources are likely to be stakeholders in a program - participants, other researchers, program staff, other community members, and so on.
Then we put all data in single framework & apply various statistical tools to find out the dynamic on the market.
During the analysis stage, feedback from the stakeholder groups would be compared to determine areas of agreement as well as areas of divergence