

Key Insights
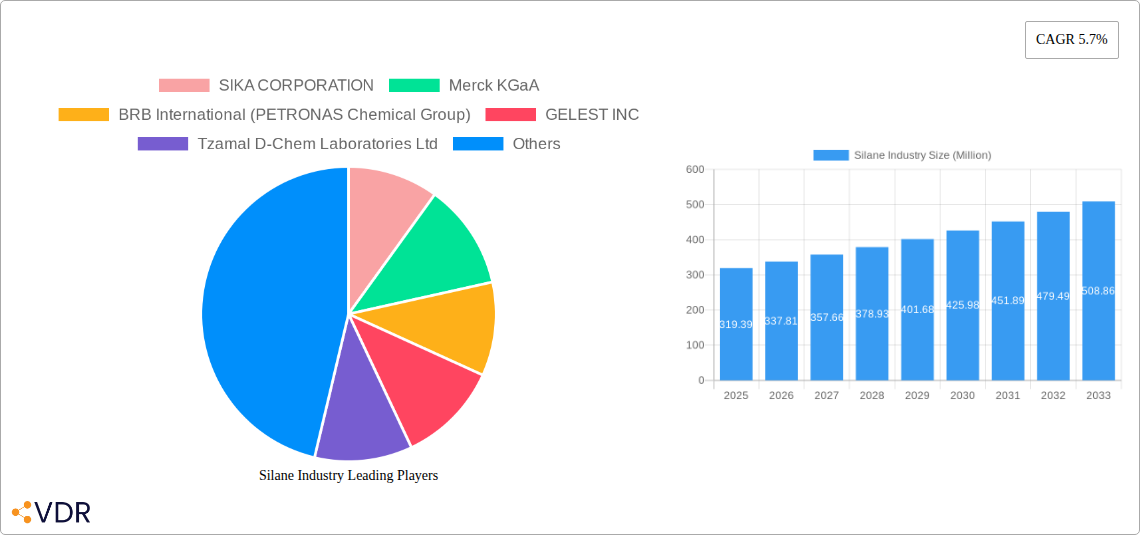
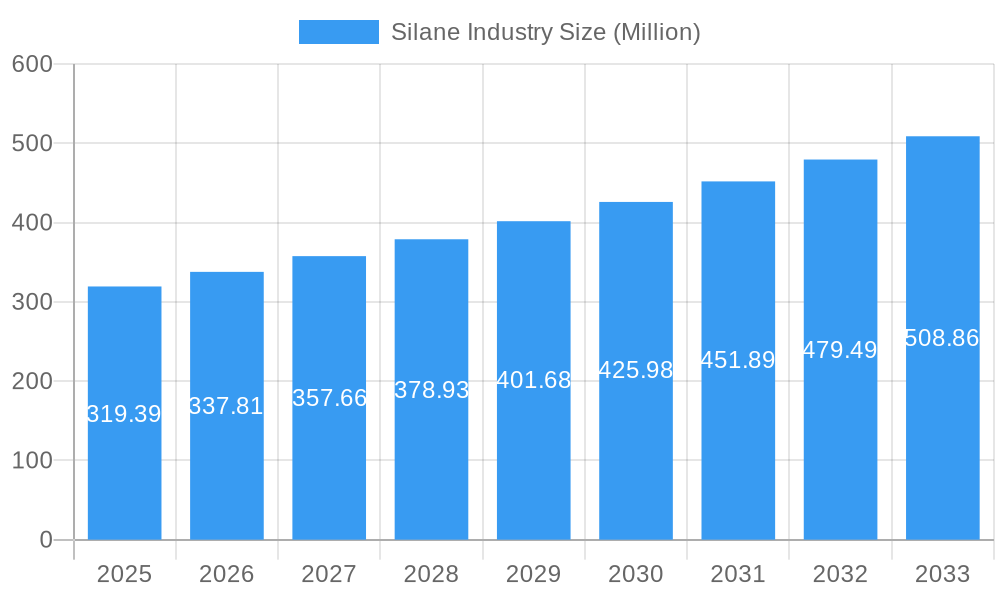
The global silane market, valued at $319.39 million in 2025, is projected to experience robust growth, driven by a compound annual growth rate (CAGR) of 5.7% from 2025 to 2033. This expansion is fueled by several key factors. Firstly, the increasing demand for high-performance materials across diverse sectors like construction, automotive, and electronics is a significant driver. The construction industry's reliance on silanes for enhancing the durability and water resistance of concrete and other building materials is a primary contributor. Simultaneously, the growing adoption of silanes in advanced materials like composites and rubber products, particularly in the automotive and aerospace industries, is boosting market growth. Furthermore, the rising focus on sustainable construction practices and the development of eco-friendly materials incorporating silanes are contributing to market expansion. Technological advancements leading to the development of new silane-based products with enhanced properties further propel market growth. Regional variations in market growth are anticipated, with Asia-Pacific expected to lead due to its robust construction and manufacturing sectors and increasing infrastructure development.
Silane Industry Market Size (In Million)
However, certain challenges could potentially restrain market growth. Fluctuations in raw material prices, particularly those of silicon, can impact silane production costs and profitability. Stringent environmental regulations related to the manufacturing and application of silanes could also pose challenges. Despite these potential restraints, the overall market outlook remains positive, driven by the expanding application base and ongoing innovation in silane technology. The market segmentation reveals strong growth across applications such as plastics, rubber and composites, and building & construction, with the emergence of niche applications in semiconductors and pharmaceuticals contributing to market diversification. Key players in the market are continuously investing in research and development to introduce innovative silane products and expand their market presence. This competitive landscape fuels innovation and ensures a steady supply of high-quality silanes to meet the growing demand.
Silane Industry Company Market Share
Silane Industry Market Report: 2019-2033
This comprehensive report provides an in-depth analysis of the global silane industry, encompassing market dynamics, growth trends, regional segmentation, product landscape, key players, and future outlook. The study period spans from 2019 to 2033, with 2025 serving as the base and estimated year. This report is invaluable for industry professionals, investors, and researchers seeking a comprehensive understanding of this dynamic market. The report forecasts a market valued at xx Million by 2033.
Silane Industry Market Dynamics & Structure
The global silane market, valued at xx Million in 2025, is characterized by a moderately concentrated structure with key players holding significant market share. Technological innovation, particularly in the development of high-performance silanes for specific applications, is a major driver. Stringent regulatory frameworks concerning environmental impact and safety are shaping industry practices. Competition from alternative materials, such as epoxy resins and other bonding agents, poses a challenge. End-user demographics, heavily influenced by construction and industrial growth, strongly impact demand. Mergers and acquisitions (M&A) activity has been moderate, with larger players strategically acquiring smaller specialized firms to expand their product portfolios and market reach.
- Market Concentration: Moderately concentrated, with top 5 players holding approximately xx% market share in 2025.
- Technological Innovation: Focus on developing silanes with enhanced properties like improved adhesion, durability, and hydrophobicity.
- Regulatory Framework: Compliance with environmental regulations concerning VOC emissions and material safety.
- Competitive Substitutes: Epoxy resins, polyurethane adhesives, and other bonding agents.
- M&A Activity: xx major M&A deals recorded between 2019 and 2024, with an average deal value of xx Million.
- Innovation Barriers: High R&D costs, stringent regulatory approvals, and challenges in scaling up production.
Silane Industry Growth Trends & Insights
The global silane market experienced robust growth during the historical period (2019-2024), driven by increasing demand from key end-use sectors such as building & construction, paints & coatings, and adhesives & sealants. The market is expected to maintain a healthy Compound Annual Growth Rate (CAGR) of xx% during the forecast period (2025-2033). Technological advancements, such as the development of novel silane chemistries with enhanced properties, are contributing significantly to market expansion. Shifting consumer preferences towards high-performance, eco-friendly materials are also fueling growth. Market penetration in emerging economies is expected to increase substantially, driven by infrastructure development and rising construction activities.
- Market Size (2025): xx Million
- CAGR (2025-2033): xx%
- Market Penetration (2025): xx% in developed economies, xx% in emerging economies.
- Key Growth Drivers: Infrastructure development, increasing construction activities, and growing demand for high-performance materials.
Dominant Regions, Countries, or Segments in Silane Industry
The Asia-Pacific region is projected to be the dominant market for silanes during the forecast period, fueled by rapid industrialization, robust construction activities, and increasing demand from various end-use sectors. Within this region, China and India are expected to be the key growth drivers. Among the application segments, the Building & Construction sector holds a dominant position, followed by Paints & Coatings and Adhesives & Sealants. Alkyl and Amino silanes are the leading types, accounting for a significant portion of the overall market share.
- Dominant Region: Asia-Pacific
- Key Countries: China, India, United States, Germany
- Dominant Application Segment: Building & Construction (Market Share: xx%)
- Dominant Type Segment: Alkyl silanes (Market Share: xx%)
- Growth Drivers: Rapid urbanization, infrastructure development, government initiatives promoting sustainable construction, and increasing disposable incomes.
Silane Industry Product Landscape
The silane market offers a diverse range of products, categorized by chemical structure (alkyl, amino, epoxy, methacryloxy, phenyl, vinyl, and others) and tailored for specific applications. Recent innovations have focused on developing silanes with enhanced properties, including improved adhesion, water repellency, and UV resistance. These advancements cater to the growing demand for high-performance materials in diverse industries, resulting in increased product differentiation and improved performance metrics. Companies are emphasizing sustainable and environmentally friendly manufacturing processes, further enhancing their product appeal.
Key Drivers, Barriers & Challenges in Silane Industry
Key Drivers:
- Growing demand from the construction industry.
- Rising adoption in automotive and electronics sectors.
- Technological advancements leading to improved product performance.
Challenges:
- Fluctuations in raw material prices.
- Stringent environmental regulations.
- Intense competition from alternative materials (xx% market share lost to alternatives in 2024).
Emerging Opportunities in Silane Industry
- Development of high-performance silanes for specialized applications (e.g., aerospace, medical devices).
- Expansion into emerging markets with high growth potential.
- Increasing demand for eco-friendly and sustainable silane-based products.
Growth Accelerators in the Silane Industry
Technological breakthroughs in silane synthesis and application techniques are paving the way for wider adoption across diverse industries. Strategic partnerships and collaborations are fostering innovation and market expansion. Companies are increasingly focusing on developing sustainable and environmentally friendly manufacturing processes, aligning with the global push for green technologies.
Key Players Shaping the Silane Industry Market
- SIKA CORPORATION
- Merck KGaA
- BRB International (PETRONAS Chemical Group)
- GELEST INC
- Tzamal D-Chem Laboratories Ltd
- Momentive
- Genesee Polymers Corporation
- Dow
- Alfa Aesar (Thermo Fisher Scientific)
- Shin-Etsu Chemical Co Ltd
- Prochimia Surfaces
- United Chemical Technologies
- Wacker Chemie AG
- Evonik
Notable Milestones in Silane Industry Sector
- 2020: Launch of a novel silane-based coating technology by SIKA CORPORATION.
- 2022: Acquisition of a smaller silane manufacturer by Dow, expanding its product portfolio.
- 2023: Introduction of a new environmentally friendly silane production process by Wacker Chemie AG.
In-Depth Silane Industry Market Outlook
The silane market is poised for significant growth driven by continued technological advancements, increasing demand from key end-use sectors, and expansion into emerging markets. Strategic partnerships and collaborations will play a crucial role in accelerating market expansion. The focus on sustainability and eco-friendly products will further shape industry dynamics, presenting opportunities for innovative and responsible players.
Silane Industry Segmentation
-
1. Type
- 1.1. Alkyl
- 1.2. Amino
- 1.3. Epoxy
- 1.4. Methacryloxy
- 1.5. Phenyl
- 1.6. Vinyl
- 1.7. Others
-
2. Application
- 2.1. Plastics, Rubber and Composites
- 2.2. Building & Construction
- 2.3. Paints & Coatings
- 2.4. Adhesives & Sealants
- 2.5. Mineral & Filler Treatment
- 2.6. Others (Semi-Conductors, Pharmaceutical, etc.,)
Silane Industry Segmentation By Geography
-
1. Asia Pacific
- 1.1. China
- 1.2. India
- 1.3. Japan
- 1.4. South Korea
- 1.5. Rest of Asia Pacific
-
2. North America
- 2.1. United States
- 2.2. Canada
- 2.3. Mexico
-
3. Europe
- 3.1. Germany
- 3.2. United Kingdom
- 3.3. Italy
- 3.4. France
- 3.5. Rest of Europe
-
4. South America
- 4.1. Brazil
- 4.2. Argentina
- 4.3. Rest of South America
-
5. Middle East and Africa
- 5.1. Saudi Arabia
- 5.2. South Africa
- 5.3. Rest of Middle East and Africa
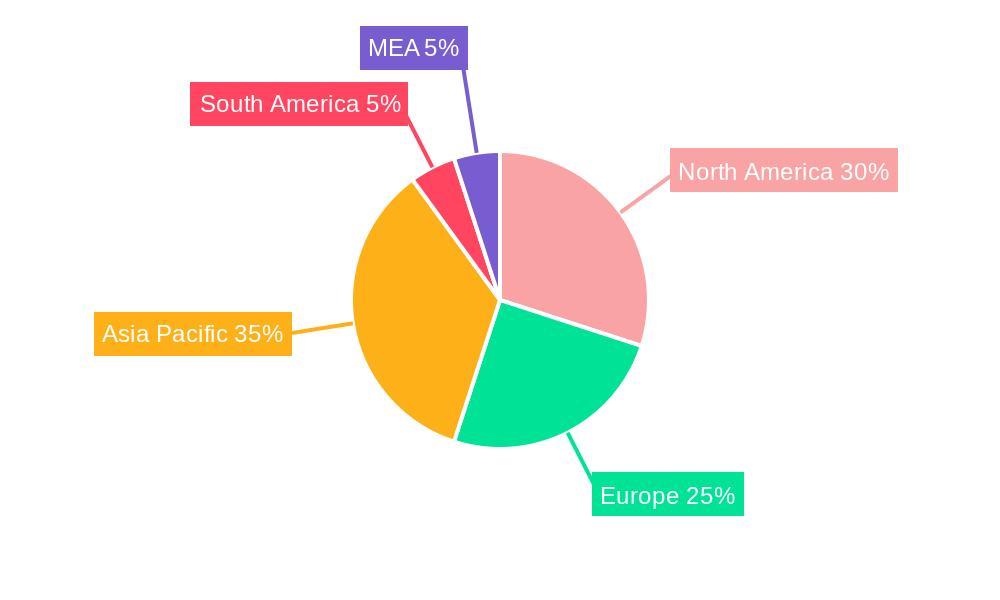
Silane Industry Regional Market Share
Geographic Coverage of Silane Industry
Silane Industry REPORT HIGHLIGHTS
| Aspects | Details |
|---|---|
| Study Period | 2020-2034 |
| Base Year | 2025 |
| Estimated Year | 2026 |
| Forecast Period | 2026-2034 |
| Historical Period | 2020-2025 |
| Growth Rate | CAGR of 5.7% from 2020-2034 |
| Segmentation |
|
Table of Contents
- 1. Introduction
- 1.1. Research Scope
- 1.2. Market Segmentation
- 1.3. Research Objective
- 1.4. Definitions and Assumptions
- 2. Executive Summary
- 2.1. Market Snapshot
- 3. Market Dynamics
- 3.1. Market Drivers
- 3.2. Market Restrains
- 3.3. Market Trends
- 3.4. Market Opportunities
- 4. Market Factor Analysis
- 4.1. Porters Five Forces
- 4.1.1. Bargaining Power of Suppliers
- 4.1.2. Bargaining Power of Buyers
- 4.1.3. Threat of New Entrants
- 4.1.4. Threat of Substitutes
- 4.1.5. Competitive Rivalry
- 4.2. PESTEL analysis
- 4.3. BCG Analysis
- 4.3.1. Stars (High Growth, High Market Share)
- 4.3.2. Cash Cows (Low Growth, High Market Share)
- 4.3.3. Question Mark (High Growth, Low Market Share)
- 4.3.4. Dogs (Low Growth, Low Market Share)
- 4.4. Ansoff Matrix Analysis
- 4.5. Supply Chain Analysis
- 4.6. Regulatory Landscape
- 4.7. Current Market Potential and Opportunity Assessment (TAM–SAM–SOM Framework)
- 4.8. VDR Analyst Note
- 4.1. Porters Five Forces
- 5. Market Analysis, Insights and Forecast 2021-2033
- 5.1. Market Analysis, Insights and Forecast - by Type
- 5.1.1. Alkyl
- 5.1.2. Amino
- 5.1.3. Epoxy
- 5.1.4. Methacryloxy
- 5.1.5. Phenyl
- 5.1.6. Vinyl
- 5.1.7. Others
- 5.2. Market Analysis, Insights and Forecast - by Application
- 5.2.1. Plastics, Rubber and Composites
- 5.2.2. Building & Construction
- 5.2.3. Paints & Coatings
- 5.2.4. Adhesives & Sealants
- 5.2.5. Mineral & Filler Treatment
- 5.2.6. Others (Semi-Conductors, Pharmaceutical, etc.,)
- 5.3. Market Analysis, Insights and Forecast - by Region
- 5.3.1. Asia Pacific
- 5.3.2. North America
- 5.3.3. Europe
- 5.3.4. South America
- 5.3.5. Middle East and Africa
- 5.1. Market Analysis, Insights and Forecast - by Type
- 6. Global Silane Industry Analysis, Insights and Forecast, 2021-2033
- 6.1. Market Analysis, Insights and Forecast - by Type
- 6.1.1. Alkyl
- 6.1.2. Amino
- 6.1.3. Epoxy
- 6.1.4. Methacryloxy
- 6.1.5. Phenyl
- 6.1.6. Vinyl
- 6.1.7. Others
- 6.2. Market Analysis, Insights and Forecast - by Application
- 6.2.1. Plastics, Rubber and Composites
- 6.2.2. Building & Construction
- 6.2.3. Paints & Coatings
- 6.2.4. Adhesives & Sealants
- 6.2.5. Mineral & Filler Treatment
- 6.2.6. Others (Semi-Conductors, Pharmaceutical, etc.,)
- 6.1. Market Analysis, Insights and Forecast - by Type
- 7. Asia Pacific Silane Industry Analysis, Insights and Forecast, 2021-2033
- 7.1. Market Analysis, Insights and Forecast - by Type
- 7.1.1. Alkyl
- 7.1.2. Amino
- 7.1.3. Epoxy
- 7.1.4. Methacryloxy
- 7.1.5. Phenyl
- 7.1.6. Vinyl
- 7.1.7. Others
- 7.2. Market Analysis, Insights and Forecast - by Application
- 7.2.1. Plastics, Rubber and Composites
- 7.2.2. Building & Construction
- 7.2.3. Paints & Coatings
- 7.2.4. Adhesives & Sealants
- 7.2.5. Mineral & Filler Treatment
- 7.2.6. Others (Semi-Conductors, Pharmaceutical, etc.,)
- 7.1. Market Analysis, Insights and Forecast - by Type
- 8. North America Silane Industry Analysis, Insights and Forecast, 2021-2033
- 8.1. Market Analysis, Insights and Forecast - by Type
- 8.1.1. Alkyl
- 8.1.2. Amino
- 8.1.3. Epoxy
- 8.1.4. Methacryloxy
- 8.1.5. Phenyl
- 8.1.6. Vinyl
- 8.1.7. Others
- 8.2. Market Analysis, Insights and Forecast - by Application
- 8.2.1. Plastics, Rubber and Composites
- 8.2.2. Building & Construction
- 8.2.3. Paints & Coatings
- 8.2.4. Adhesives & Sealants
- 8.2.5. Mineral & Filler Treatment
- 8.2.6. Others (Semi-Conductors, Pharmaceutical, etc.,)
- 8.1. Market Analysis, Insights and Forecast - by Type
- 9. Europe Silane Industry Analysis, Insights and Forecast, 2021-2033
- 9.1. Market Analysis, Insights and Forecast - by Type
- 9.1.1. Alkyl
- 9.1.2. Amino
- 9.1.3. Epoxy
- 9.1.4. Methacryloxy
- 9.1.5. Phenyl
- 9.1.6. Vinyl
- 9.1.7. Others
- 9.2. Market Analysis, Insights and Forecast - by Application
- 9.2.1. Plastics, Rubber and Composites
- 9.2.2. Building & Construction
- 9.2.3. Paints & Coatings
- 9.2.4. Adhesives & Sealants
- 9.2.5. Mineral & Filler Treatment
- 9.2.6. Others (Semi-Conductors, Pharmaceutical, etc.,)
- 9.1. Market Analysis, Insights and Forecast - by Type
- 10. South America Silane Industry Analysis, Insights and Forecast, 2021-2033
- 10.1. Market Analysis, Insights and Forecast - by Type
- 10.1.1. Alkyl
- 10.1.2. Amino
- 10.1.3. Epoxy
- 10.1.4. Methacryloxy
- 10.1.5. Phenyl
- 10.1.6. Vinyl
- 10.1.7. Others
- 10.2. Market Analysis, Insights and Forecast - by Application
- 10.2.1. Plastics, Rubber and Composites
- 10.2.2. Building & Construction
- 10.2.3. Paints & Coatings
- 10.2.4. Adhesives & Sealants
- 10.2.5. Mineral & Filler Treatment
- 10.2.6. Others (Semi-Conductors, Pharmaceutical, etc.,)
- 10.1. Market Analysis, Insights and Forecast - by Type
- 11. Middle East and Africa Silane Industry Analysis, Insights and Forecast, 2021-2033
- 11.1. Market Analysis, Insights and Forecast - by Type
- 11.1.1. Alkyl
- 11.1.2. Amino
- 11.1.3. Epoxy
- 11.1.4. Methacryloxy
- 11.1.5. Phenyl
- 11.1.6. Vinyl
- 11.1.7. Others
- 11.2. Market Analysis, Insights and Forecast - by Application
- 11.2.1. Plastics, Rubber and Composites
- 11.2.2. Building & Construction
- 11.2.3. Paints & Coatings
- 11.2.4. Adhesives & Sealants
- 11.2.5. Mineral & Filler Treatment
- 11.2.6. Others (Semi-Conductors, Pharmaceutical, etc.,)
- 11.1. Market Analysis, Insights and Forecast - by Type
- 12. Competitive Analysis
- 12.1. Company Profiles
- 12.1.1 SIKA CORPORATION
- 12.1.1.1. Company Overview
- 12.1.1.2. Products
- 12.1.1.3. Company Financials
- 12.1.1.4. SWOT Analysis
- 12.1.2 Merck KGaA
- 12.1.2.1. Company Overview
- 12.1.2.2. Products
- 12.1.2.3. Company Financials
- 12.1.2.4. SWOT Analysis
- 12.1.3 BRB International (PETRONAS Chemical Group)
- 12.1.3.1. Company Overview
- 12.1.3.2. Products
- 12.1.3.3. Company Financials
- 12.1.3.4. SWOT Analysis
- 12.1.4 GELEST INC
- 12.1.4.1. Company Overview
- 12.1.4.2. Products
- 12.1.4.3. Company Financials
- 12.1.4.4. SWOT Analysis
- 12.1.5 Tzamal D-Chem Laboratories Ltd
- 12.1.5.1. Company Overview
- 12.1.5.2. Products
- 12.1.5.3. Company Financials
- 12.1.5.4. SWOT Analysis
- 12.1.6 Momentive
- 12.1.6.1. Company Overview
- 12.1.6.2. Products
- 12.1.6.3. Company Financials
- 12.1.6.4. SWOT Analysis
- 12.1.7 Genesee Polymers Corporation
- 12.1.7.1. Company Overview
- 12.1.7.2. Products
- 12.1.7.3. Company Financials
- 12.1.7.4. SWOT Analysis
- 12.1.8 Dow
- 12.1.8.1. Company Overview
- 12.1.8.2. Products
- 12.1.8.3. Company Financials
- 12.1.8.4. SWOT Analysis
- 12.1.9 Alfa Aesar (Thermo Fisher Scientific)
- 12.1.9.1. Company Overview
- 12.1.9.2. Products
- 12.1.9.3. Company Financials
- 12.1.9.4. SWOT Analysis
- 12.1.10 Shin-Etsu Chemical Co Ltd
- 12.1.10.1. Company Overview
- 12.1.10.2. Products
- 12.1.10.3. Company Financials
- 12.1.10.4. SWOT Analysis
- 12.1.11 Prochimia Surfaces
- 12.1.11.1. Company Overview
- 12.1.11.2. Products
- 12.1.11.3. Company Financials
- 12.1.11.4. SWOT Analysis
- 12.1.12 United Chemical Technologies
- 12.1.12.1. Company Overview
- 12.1.12.2. Products
- 12.1.12.3. Company Financials
- 12.1.12.4. SWOT Analysis
- 12.1.13 Wacker Chemie AG
- 12.1.13.1. Company Overview
- 12.1.13.2. Products
- 12.1.13.3. Company Financials
- 12.1.13.4. SWOT Analysis
- 12.1.14 Evonik
- 12.1.14.1. Company Overview
- 12.1.14.2. Products
- 12.1.14.3. Company Financials
- 12.1.14.4. SWOT Analysis
- 12.1.1 SIKA CORPORATION
- 12.2. Market Entropy
- 12.2.1 Company's Key Areas Served
- 12.2.2 Recent Developments
- 12.3. Company Market Share Analysis 2025
- 12.3.1 Top 5 Companies Market Share Analysis
- 12.3.2 Top 3 Companies Market Share Analysis
- 12.4. List of Potential Customers
- 13. Research Methodology
List of Figures
- Figure 1: Global Silane Industry Revenue Breakdown (Million, %) by Region 2025 & 2033
- Figure 2: Global Silane Industry Volume Breakdown (K Tons, %) by Region 2025 & 2033
- Figure 3: Asia Pacific Silane Industry Revenue (Million), by Type 2025 & 2033
- Figure 4: Asia Pacific Silane Industry Volume (K Tons), by Type 2025 & 2033
- Figure 5: Asia Pacific Silane Industry Revenue Share (%), by Type 2025 & 2033
- Figure 6: Asia Pacific Silane Industry Volume Share (%), by Type 2025 & 2033
- Figure 7: Asia Pacific Silane Industry Revenue (Million), by Application 2025 & 2033
- Figure 8: Asia Pacific Silane Industry Volume (K Tons), by Application 2025 & 2033
- Figure 9: Asia Pacific Silane Industry Revenue Share (%), by Application 2025 & 2033
- Figure 10: Asia Pacific Silane Industry Volume Share (%), by Application 2025 & 2033
- Figure 11: Asia Pacific Silane Industry Revenue (Million), by Country 2025 & 2033
- Figure 12: Asia Pacific Silane Industry Volume (K Tons), by Country 2025 & 2033
- Figure 13: Asia Pacific Silane Industry Revenue Share (%), by Country 2025 & 2033
- Figure 14: Asia Pacific Silane Industry Volume Share (%), by Country 2025 & 2033
- Figure 15: North America Silane Industry Revenue (Million), by Type 2025 & 2033
- Figure 16: North America Silane Industry Volume (K Tons), by Type 2025 & 2033
- Figure 17: North America Silane Industry Revenue Share (%), by Type 2025 & 2033
- Figure 18: North America Silane Industry Volume Share (%), by Type 2025 & 2033
- Figure 19: North America Silane Industry Revenue (Million), by Application 2025 & 2033
- Figure 20: North America Silane Industry Volume (K Tons), by Application 2025 & 2033
- Figure 21: North America Silane Industry Revenue Share (%), by Application 2025 & 2033
- Figure 22: North America Silane Industry Volume Share (%), by Application 2025 & 2033
- Figure 23: North America Silane Industry Revenue (Million), by Country 2025 & 2033
- Figure 24: North America Silane Industry Volume (K Tons), by Country 2025 & 2033
- Figure 25: North America Silane Industry Revenue Share (%), by Country 2025 & 2033
- Figure 26: North America Silane Industry Volume Share (%), by Country 2025 & 2033
- Figure 27: Europe Silane Industry Revenue (Million), by Type 2025 & 2033
- Figure 28: Europe Silane Industry Volume (K Tons), by Type 2025 & 2033
- Figure 29: Europe Silane Industry Revenue Share (%), by Type 2025 & 2033
- Figure 30: Europe Silane Industry Volume Share (%), by Type 2025 & 2033
- Figure 31: Europe Silane Industry Revenue (Million), by Application 2025 & 2033
- Figure 32: Europe Silane Industry Volume (K Tons), by Application 2025 & 2033
- Figure 33: Europe Silane Industry Revenue Share (%), by Application 2025 & 2033
- Figure 34: Europe Silane Industry Volume Share (%), by Application 2025 & 2033
- Figure 35: Europe Silane Industry Revenue (Million), by Country 2025 & 2033
- Figure 36: Europe Silane Industry Volume (K Tons), by Country 2025 & 2033
- Figure 37: Europe Silane Industry Revenue Share (%), by Country 2025 & 2033
- Figure 38: Europe Silane Industry Volume Share (%), by Country 2025 & 2033
- Figure 39: South America Silane Industry Revenue (Million), by Type 2025 & 2033
- Figure 40: South America Silane Industry Volume (K Tons), by Type 2025 & 2033
- Figure 41: South America Silane Industry Revenue Share (%), by Type 2025 & 2033
- Figure 42: South America Silane Industry Volume Share (%), by Type 2025 & 2033
- Figure 43: South America Silane Industry Revenue (Million), by Application 2025 & 2033
- Figure 44: South America Silane Industry Volume (K Tons), by Application 2025 & 2033
- Figure 45: South America Silane Industry Revenue Share (%), by Application 2025 & 2033
- Figure 46: South America Silane Industry Volume Share (%), by Application 2025 & 2033
- Figure 47: South America Silane Industry Revenue (Million), by Country 2025 & 2033
- Figure 48: South America Silane Industry Volume (K Tons), by Country 2025 & 2033
- Figure 49: South America Silane Industry Revenue Share (%), by Country 2025 & 2033
- Figure 50: South America Silane Industry Volume Share (%), by Country 2025 & 2033
- Figure 51: Middle East and Africa Silane Industry Revenue (Million), by Type 2025 & 2033
- Figure 52: Middle East and Africa Silane Industry Volume (K Tons), by Type 2025 & 2033
- Figure 53: Middle East and Africa Silane Industry Revenue Share (%), by Type 2025 & 2033
- Figure 54: Middle East and Africa Silane Industry Volume Share (%), by Type 2025 & 2033
- Figure 55: Middle East and Africa Silane Industry Revenue (Million), by Application 2025 & 2033
- Figure 56: Middle East and Africa Silane Industry Volume (K Tons), by Application 2025 & 2033
- Figure 57: Middle East and Africa Silane Industry Revenue Share (%), by Application 2025 & 2033
- Figure 58: Middle East and Africa Silane Industry Volume Share (%), by Application 2025 & 2033
- Figure 59: Middle East and Africa Silane Industry Revenue (Million), by Country 2025 & 2033
- Figure 60: Middle East and Africa Silane Industry Volume (K Tons), by Country 2025 & 2033
- Figure 61: Middle East and Africa Silane Industry Revenue Share (%), by Country 2025 & 2033
- Figure 62: Middle East and Africa Silane Industry Volume Share (%), by Country 2025 & 2033
List of Tables
- Table 1: Global Silane Industry Revenue Million Forecast, by Type 2020 & 2033
- Table 2: Global Silane Industry Volume K Tons Forecast, by Type 2020 & 2033
- Table 3: Global Silane Industry Revenue Million Forecast, by Application 2020 & 2033
- Table 4: Global Silane Industry Volume K Tons Forecast, by Application 2020 & 2033
- Table 5: Global Silane Industry Revenue Million Forecast, by Region 2020 & 2033
- Table 6: Global Silane Industry Volume K Tons Forecast, by Region 2020 & 2033
- Table 7: Global Silane Industry Revenue Million Forecast, by Type 2020 & 2033
- Table 8: Global Silane Industry Volume K Tons Forecast, by Type 2020 & 2033
- Table 9: Global Silane Industry Revenue Million Forecast, by Application 2020 & 2033
- Table 10: Global Silane Industry Volume K Tons Forecast, by Application 2020 & 2033
- Table 11: Global Silane Industry Revenue Million Forecast, by Country 2020 & 2033
- Table 12: Global Silane Industry Volume K Tons Forecast, by Country 2020 & 2033
- Table 13: China Silane Industry Revenue (Million) Forecast, by Application 2020 & 2033
- Table 14: China Silane Industry Volume (K Tons) Forecast, by Application 2020 & 2033
- Table 15: India Silane Industry Revenue (Million) Forecast, by Application 2020 & 2033
- Table 16: India Silane Industry Volume (K Tons) Forecast, by Application 2020 & 2033
- Table 17: Japan Silane Industry Revenue (Million) Forecast, by Application 2020 & 2033
- Table 18: Japan Silane Industry Volume (K Tons) Forecast, by Application 2020 & 2033
- Table 19: South Korea Silane Industry Revenue (Million) Forecast, by Application 2020 & 2033
- Table 20: South Korea Silane Industry Volume (K Tons) Forecast, by Application 2020 & 2033
- Table 21: Rest of Asia Pacific Silane Industry Revenue (Million) Forecast, by Application 2020 & 2033
- Table 22: Rest of Asia Pacific Silane Industry Volume (K Tons) Forecast, by Application 2020 & 2033
- Table 23: Global Silane Industry Revenue Million Forecast, by Type 2020 & 2033
- Table 24: Global Silane Industry Volume K Tons Forecast, by Type 2020 & 2033
- Table 25: Global Silane Industry Revenue Million Forecast, by Application 2020 & 2033
- Table 26: Global Silane Industry Volume K Tons Forecast, by Application 2020 & 2033
- Table 27: Global Silane Industry Revenue Million Forecast, by Country 2020 & 2033
- Table 28: Global Silane Industry Volume K Tons Forecast, by Country 2020 & 2033
- Table 29: United States Silane Industry Revenue (Million) Forecast, by Application 2020 & 2033
- Table 30: United States Silane Industry Volume (K Tons) Forecast, by Application 2020 & 2033
- Table 31: Canada Silane Industry Revenue (Million) Forecast, by Application 2020 & 2033
- Table 32: Canada Silane Industry Volume (K Tons) Forecast, by Application 2020 & 2033
- Table 33: Mexico Silane Industry Revenue (Million) Forecast, by Application 2020 & 2033
- Table 34: Mexico Silane Industry Volume (K Tons) Forecast, by Application 2020 & 2033
- Table 35: Global Silane Industry Revenue Million Forecast, by Type 2020 & 2033
- Table 36: Global Silane Industry Volume K Tons Forecast, by Type 2020 & 2033
- Table 37: Global Silane Industry Revenue Million Forecast, by Application 2020 & 2033
- Table 38: Global Silane Industry Volume K Tons Forecast, by Application 2020 & 2033
- Table 39: Global Silane Industry Revenue Million Forecast, by Country 2020 & 2033
- Table 40: Global Silane Industry Volume K Tons Forecast, by Country 2020 & 2033
- Table 41: Germany Silane Industry Revenue (Million) Forecast, by Application 2020 & 2033
- Table 42: Germany Silane Industry Volume (K Tons) Forecast, by Application 2020 & 2033
- Table 43: United Kingdom Silane Industry Revenue (Million) Forecast, by Application 2020 & 2033
- Table 44: United Kingdom Silane Industry Volume (K Tons) Forecast, by Application 2020 & 2033
- Table 45: Italy Silane Industry Revenue (Million) Forecast, by Application 2020 & 2033
- Table 46: Italy Silane Industry Volume (K Tons) Forecast, by Application 2020 & 2033
- Table 47: France Silane Industry Revenue (Million) Forecast, by Application 2020 & 2033
- Table 48: France Silane Industry Volume (K Tons) Forecast, by Application 2020 & 2033
- Table 49: Rest of Europe Silane Industry Revenue (Million) Forecast, by Application 2020 & 2033
- Table 50: Rest of Europe Silane Industry Volume (K Tons) Forecast, by Application 2020 & 2033
- Table 51: Global Silane Industry Revenue Million Forecast, by Type 2020 & 2033
- Table 52: Global Silane Industry Volume K Tons Forecast, by Type 2020 & 2033
- Table 53: Global Silane Industry Revenue Million Forecast, by Application 2020 & 2033
- Table 54: Global Silane Industry Volume K Tons Forecast, by Application 2020 & 2033
- Table 55: Global Silane Industry Revenue Million Forecast, by Country 2020 & 2033
- Table 56: Global Silane Industry Volume K Tons Forecast, by Country 2020 & 2033
- Table 57: Brazil Silane Industry Revenue (Million) Forecast, by Application 2020 & 2033
- Table 58: Brazil Silane Industry Volume (K Tons) Forecast, by Application 2020 & 2033
- Table 59: Argentina Silane Industry Revenue (Million) Forecast, by Application 2020 & 2033
- Table 60: Argentina Silane Industry Volume (K Tons) Forecast, by Application 2020 & 2033
- Table 61: Rest of South America Silane Industry Revenue (Million) Forecast, by Application 2020 & 2033
- Table 62: Rest of South America Silane Industry Volume (K Tons) Forecast, by Application 2020 & 2033
- Table 63: Global Silane Industry Revenue Million Forecast, by Type 2020 & 2033
- Table 64: Global Silane Industry Volume K Tons Forecast, by Type 2020 & 2033
- Table 65: Global Silane Industry Revenue Million Forecast, by Application 2020 & 2033
- Table 66: Global Silane Industry Volume K Tons Forecast, by Application 2020 & 2033
- Table 67: Global Silane Industry Revenue Million Forecast, by Country 2020 & 2033
- Table 68: Global Silane Industry Volume K Tons Forecast, by Country 2020 & 2033
- Table 69: Saudi Arabia Silane Industry Revenue (Million) Forecast, by Application 2020 & 2033
- Table 70: Saudi Arabia Silane Industry Volume (K Tons) Forecast, by Application 2020 & 2033
- Table 71: South Africa Silane Industry Revenue (Million) Forecast, by Application 2020 & 2033
- Table 72: South Africa Silane Industry Volume (K Tons) Forecast, by Application 2020 & 2033
- Table 73: Rest of Middle East and Africa Silane Industry Revenue (Million) Forecast, by Application 2020 & 2033
- Table 74: Rest of Middle East and Africa Silane Industry Volume (K Tons) Forecast, by Application 2020 & 2033
Frequently Asked Questions
1. What is the projected Compound Annual Growth Rate (CAGR) of the Silane Industry?
The projected CAGR is approximately 5.7%.
2. Which companies are prominent players in the Silane Industry?
Key companies in the market include SIKA CORPORATION, Merck KGaA, BRB International (PETRONAS Chemical Group), GELEST INC, Tzamal D-Chem Laboratories Ltd, Momentive, Genesee Polymers Corporation, Dow, Alfa Aesar (Thermo Fisher Scientific), Shin-Etsu Chemical Co Ltd, Prochimia Surfaces, United Chemical Technologies, Wacker Chemie AG, Evonik.
3. What are the main segments of the Silane Industry?
The market segments include Type, Application.
4. Can you provide details about the market size?
The market size is estimated to be USD 319.39 Million as of 2022.
5. What are some drivers contributing to market growth?
; Growing Demand form the Construction Industry; Growing Demand for Light-Weight Composites; Increasing Demand from Automotive Industry.
6. What are the notable trends driving market growth?
Growing Demand from the Construction Industry.
7. Are there any restraints impacting market growth?
; Higher Production Costs; Unfavorable Conditions Arising Due to the COVID-19 Outbreak.
8. Can you provide examples of recent developments in the market?
N/A
9. What pricing options are available for accessing the report?
Pricing options include single-user, multi-user, and enterprise licenses priced at USD 4750, USD 5250, and USD 8750 respectively.
10. Is the market size provided in terms of value or volume?
The market size is provided in terms of value, measured in Million and volume, measured in K Tons.
11. Are there any specific market keywords associated with the report?
Yes, the market keyword associated with the report is "Silane Industry," which aids in identifying and referencing the specific market segment covered.
12. How do I determine which pricing option suits my needs best?
The pricing options vary based on user requirements and access needs. Individual users may opt for single-user licenses, while businesses requiring broader access may choose multi-user or enterprise licenses for cost-effective access to the report.
13. Are there any additional resources or data provided in the Silane Industry report?
While the report offers comprehensive insights, it's advisable to review the specific contents or supplementary materials provided to ascertain if additional resources or data are available.
14. How can I stay updated on further developments or reports in the Silane Industry?
To stay informed about further developments, trends, and reports in the Silane Industry, consider subscribing to industry newsletters, following relevant companies and organizations, or regularly checking reputable industry news sources and publications.
Methodology
Step 1 - Identification of Relevant Samples Size from Population Database


Step 2 - Approaches for Defining Global Market Size (Value, Volume* & Price*)

Note*: In applicable scenarios
Step 3 - Data Sources
Primary Research
- Web Analytics
- Survey Reports
- Research Institute
- Latest Research Reports
- Opinion Leaders
Secondary Research
- Annual Reports
- White Paper
- Latest Press Release
- Industry Association
- Paid Database
- Investor Presentations

Step 4 - Data Triangulation
Involves using different sources of information in order to increase the validity of a study
These sources are likely to be stakeholders in a program - participants, other researchers, program staff, other community members, and so on.
Then we put all data in single framework & apply various statistical tools to find out the dynamic on the market.
During the analysis stage, feedback from the stakeholder groups would be compared to determine areas of agreement as well as areas of divergence