

Key Insights
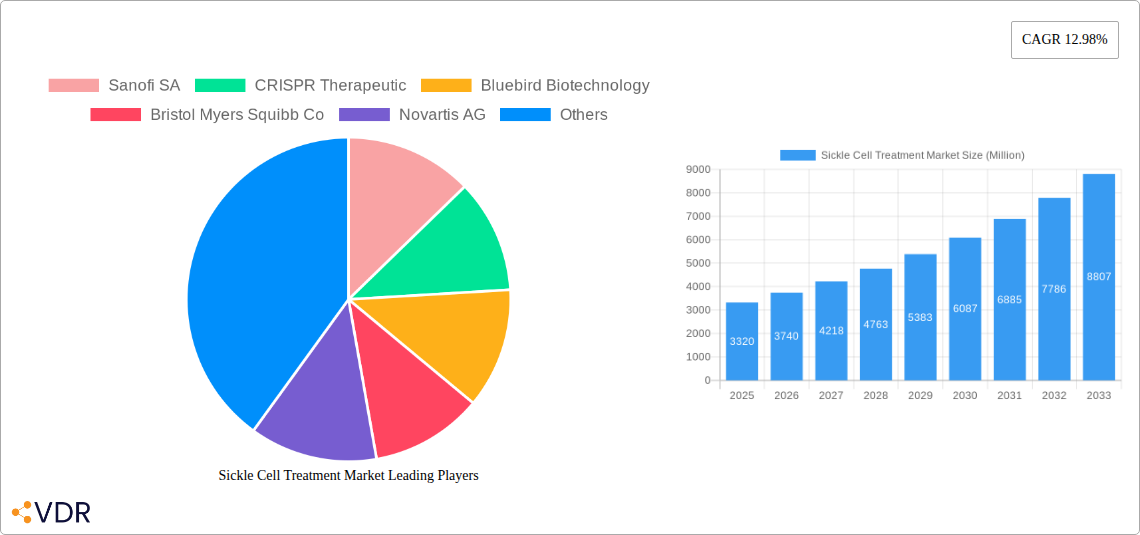
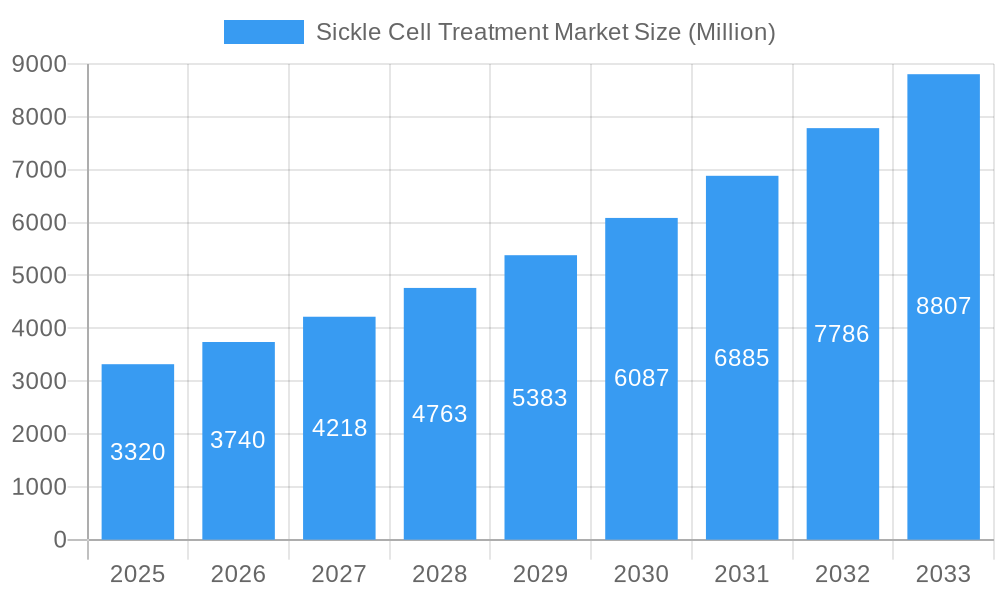
The global Sickle Cell Treatment market, valued at $3.32 billion in 2025, is projected to experience robust growth, driven by a rising prevalence of sickle cell disease (SCD), advancements in gene therapy and novel pharmacotherapies, and increased awareness and diagnosis rates. The Compound Annual Growth Rate (CAGR) of 12.98% from 2025 to 2033 indicates significant market expansion. Key drivers include the growing understanding of the disease's genetic basis, leading to targeted therapies, and the increasing availability of sophisticated diagnostic tools enabling earlier and more accurate diagnosis. The market is segmented by end-user (hospitals, specialty clinics, and other end-users) and treatment modality (blood transfusion, bone marrow transplant, and pharmacotherapy). Pharmacotherapy, encompassing hydroxyurea and newer targeted therapies, currently dominates the treatment landscape, but gene therapies and novel approaches are expected to capture substantial market share in the coming years. The high cost of advanced therapies, however, remains a significant restraint, particularly in low- and middle-income countries. North America and Europe currently hold the largest market share due to advanced healthcare infrastructure and higher per capita healthcare expenditure, but the Asia Pacific region is anticipated to witness rapid growth, spurred by increasing awareness and rising disposable incomes. The competitive landscape features established pharmaceutical companies like Sanofi, Novartis, and Pfizer, alongside innovative biotech companies specializing in gene editing technologies such as CRISPR Therapeutics and Bluebird bio, driving intense research and development activity within the market.
Sickle Cell Treatment Market Market Size (In Billion)
The projected market growth is expected to be fueled by several factors. Firstly, ongoing research and development efforts are leading to the development of more effective and targeted therapies, including gene editing techniques that offer the potential for a cure. Secondly, increased government funding and initiatives focused on improving SCD diagnosis and management are contributing to market expansion. Thirdly, the growing awareness among patients and healthcare providers regarding the latest treatment advancements is fostering higher adoption rates of innovative therapies. However, challenges such as the high cost of advanced therapies, particularly gene therapies, and the need for improved access in resource-limited settings continue to present obstacles to market growth. The increasing number of clinical trials and regulatory approvals for new therapies, alongside the expansion of healthcare infrastructure in emerging economies, will significantly shape the future dynamics of this market.
Sickle Cell Treatment Market Company Market Share
Sickle Cell Treatment Market: A Comprehensive Report (2019-2033)
This comprehensive report provides an in-depth analysis of the Sickle Cell Treatment Market, encompassing market dynamics, growth trends, regional analysis, product landscape, and key players. The study period spans from 2019 to 2033, with 2025 serving as the base and estimated year. The report utilizes a robust methodology, incorporating both quantitative and qualitative data to deliver actionable insights for industry professionals and stakeholders. The market is segmented by end-user (Hospitals, Specialty Clinics, Other End Users) and treatment modality (Blood Transfusion, Bone Marrow Transplant, Pharmacotherapy). The parent market is the overall hematological disease treatment market, while the child market is specifically focused on sickle cell disease treatments. The total market size is projected to reach xx Million by 2033.
Sickle Cell Treatment Market Market Dynamics & Structure
The Sickle Cell Treatment Market is characterized by a moderately concentrated landscape with a few major players holding significant market share. Technological innovation, particularly in gene therapy and CRISPR-Cas9 technology, is a primary growth driver. Stringent regulatory frameworks, including FDA approvals, influence market entry and product adoption. Competitive substitutes include existing pharmacotherapies and supportive care. End-user demographics, predominantly focusing on patients with sickle cell disease (SCD), are a crucial factor. M&A activity has been moderate, with several strategic acquisitions aimed at expanding product portfolios and therapeutic approaches.
- Market Concentration: The top 5 players account for approximately xx% of the market share in 2025.
- Technological Innovation: Gene therapy and CRISPR-based treatments represent significant advancements, driving market expansion.
- Regulatory Framework: FDA approvals and international regulatory guidelines significantly impact market access and growth.
- Competitive Substitutes: Existing pharmacotherapies and supportive care measures create competition in the market.
- End-User Demographics: The prevalence and incidence of SCD in various regions are key drivers of regional market differences.
- M&A Activity: The past five years have seen approximately xx M&A deals in the Sickle Cell Treatment Market, focusing primarily on expanding therapeutic pipelines.
Sickle Cell Treatment Market Growth Trends & Insights
The Sickle Cell Treatment Market has experienced significant growth in recent years, driven by increased awareness of SCD, advancements in treatment modalities, and growing investment in research and development. The market size expanded from xx Million in 2019 to xx Million in 2024, exhibiting a CAGR of xx% during the historical period. This growth is expected to continue, with the market projected to reach xx Million by 2033, exhibiting a CAGR of xx% during the forecast period. This growth is fueled by the increasing adoption of novel therapies, rising prevalence of SCD globally, and supportive government initiatives. Increased access to healthcare, improved diagnosis rates, and advancements in gene editing technology are also contributing factors. Consumer behavior shifts include a growing preference for less invasive and more effective treatments.
Dominant Regions, Countries, or Segments in Sickle Cell Treatment Market
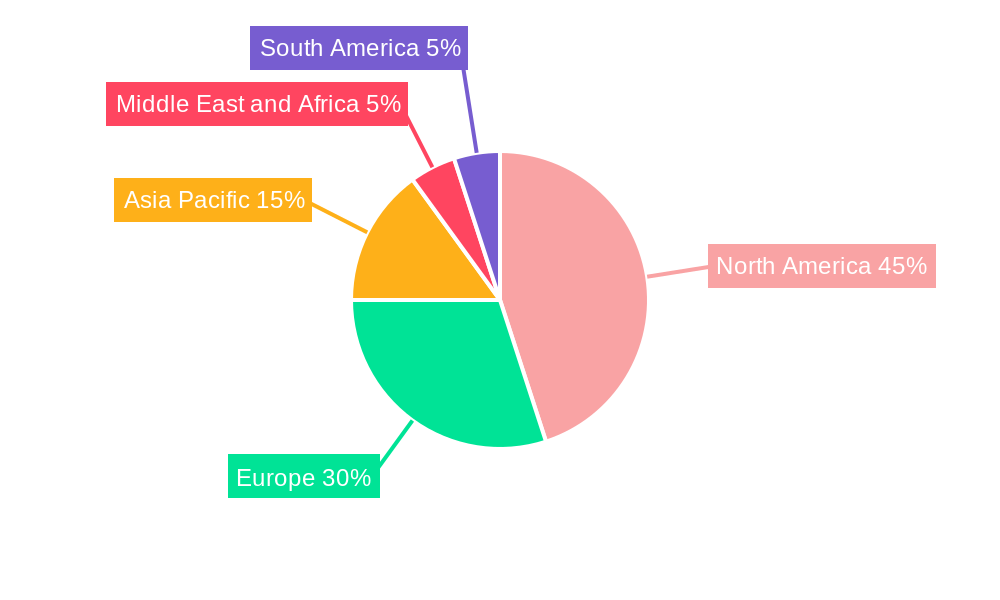
The North American region currently dominates the Sickle Cell Treatment Market, driven by high healthcare expenditure, robust research infrastructure, and a significant patient population. Within this region, the United States holds the largest market share due to high prevalence rates and increased access to advanced therapies. The European market is also witnessing significant growth due to ongoing research and development activities and increasing government funding for SCD treatment. Pharmacotherapy currently holds the largest segment share, followed by blood transfusion. Hospitals represent the largest end-user segment.
- North America: High healthcare expenditure, advanced research facilities, and a large patient pool.
- Europe: Strong R&D activities and government funding contribute to significant growth.
- Pharmacotherapy: This segment dominates due to the availability of multiple FDA-approved drugs.
- Hospitals: Hospitals are major end-users given their advanced infrastructure and expertise in treating SCD.
Sickle Cell Treatment Market Product Landscape
The Sickle Cell Treatment Market offers a diverse range of products, including pharmacotherapies like hydroxyurea, novel therapies targeting disease mechanisms, and gene therapies. Recent advancements focus on improving efficacy, reducing side effects, and expanding treatment options for various patient populations. Innovative gene editing technologies, such as CRISPR-Cas9, are revolutionizing the therapeutic landscape. Unique selling propositions include improved efficacy, reduced hospitalization, and improved quality of life.
Key Drivers, Barriers & Challenges in Sickle Cell Treatment Market
Key Drivers:
- Increased prevalence of SCD globally.
- Technological advancements in gene therapy and other novel therapies.
- Rising healthcare expenditure and health insurance coverage.
- Growing awareness and advocacy efforts for SCD.
Challenges & Restraints:
- High cost of novel therapies limits accessibility in several regions.
- Stringent regulatory processes for new drug approvals cause delays.
- Competition from existing pharmacotherapies and supportive care.
- Limited availability of specialized healthcare professionals in several developing countries.
Emerging Opportunities in Sickle Cell Treatment Market
- Untapped markets in developing countries with high SCD prevalence.
- Expansion of gene therapy applications to address unmet clinical needs.
- Development of personalized medicine approaches for enhanced efficacy.
- Focus on improving patient access through affordable treatment options.
Growth Accelerators in the Sickle Cell Treatment Market Industry
Technological breakthroughs in gene editing, particularly CRISPR-Cas9 technology, represent a significant growth catalyst. Strategic partnerships between pharmaceutical companies and research institutions are accelerating innovation and market expansion. Government funding and initiatives supporting SCD research and treatment are driving market growth. The global expansion of healthcare infrastructure and improved access to healthcare are vital contributors to market growth.
Key Players Shaping the Sickle Cell Treatment Market Market
- Sanofi SA
- CRISPR Therapeutics
- Bluebird Biotechnology
- Bristol Myers Squibb Co
- Novartis AG
- Medunik USA
- Addmedica
- Glycomimetics Inc
- Aruvant Sciences Inc
- Emmaus Medical Inc
- Global Blood Therapeutics Inc
- Editas Medicine Inc
- Pfizer Inc
Notable Milestones in Sickle Cell Treatment Market Sector
- February 2022: Global Blood Therapeutics Inc. received marketing authorization for Oxbryta.
- December 2022: Bluebird Bio Inc. announced the lifting of a partial clinical hold on its gene therapy studies.
In-Depth Sickle Cell Treatment Market Market Outlook
The Sickle Cell Treatment Market is poised for substantial growth in the coming years, driven by continuous technological advancements, expanding treatment options, and increasing global awareness of SCD. Strategic partnerships and investments in R&D will further fuel innovation. The market presents significant opportunities for companies developing novel therapies, particularly in gene editing and personalized medicine. Focus on addressing the challenges of cost and accessibility will be crucial for expanding market penetration and improving patient outcomes.
Sickle Cell Treatment Market Segmentation
-
1. Treatment Modality
- 1.1. Blood Transfusion
- 1.2. Bone Marrow Transplant
- 1.3. Pharmacotherapy
-
2. End User
- 2.1. Hospitals
- 2.2. Specialty Clinics
- 2.3. Other End Users
Sickle Cell Treatment Market Segmentation By Geography
-
1. North America
- 1.1. United States
- 1.2. Canada
- 1.3. Mexico
-
2. Europe
- 2.1. Germany
- 2.2. United Kingdom
- 2.3. France
- 2.4. Italy
- 2.5. Spain
- 2.6. Rest of Europe
-
3. Asia Pacific
- 3.1. China
- 3.2. Japan
- 3.3. India
- 3.4. Australia
- 3.5. South Korea
- 3.6. Rest of Asia Pacific
-
4. Middle East and Africa
- 4.1. GCC
- 4.2. South Africa
- 4.3. Rest of Middle East and Africa
-
5. South America
- 5.1. Brazil
- 5.2. Argentina
- 5.3. Rest of South America
Sickle Cell Treatment Market Regional Market Share
Geographic Coverage of Sickle Cell Treatment Market
Sickle Cell Treatment Market REPORT HIGHLIGHTS
| Aspects | Details |
|---|---|
| Study Period | 2020-2034 |
| Base Year | 2025 |
| Estimated Year | 2026 |
| Forecast Period | 2026-2034 |
| Historical Period | 2020-2025 |
| Growth Rate | CAGR of 12.98% from 2020-2034 |
| Segmentation |
|
Table of Contents
- 1. Introduction
- 1.1. Research Scope
- 1.2. Market Segmentation
- 1.3. Research Methodology
- 1.4. Definitions and Assumptions
- 2. Executive Summary
- 2.1. Introduction
- 3. Market Dynamics
- 3.1. Introduction
- 3.2. Market Drivers
- 3.2.1. Increasing Prevalence of Sickle Cell Disease; Increasing R&D Activity
- 3.3. Market Restrains
- 3.3.1. High Cost of Treatment
- 3.4. Market Trends
- 3.4.1. Blood Transfusion Segment is Expected to Witness Significant Growth Over the Forecast Period
- 4. Market Factor Analysis
- 4.1. Porters Five Forces
- 4.2. Supply/Value Chain
- 4.3. PESTEL analysis
- 4.4. Market Entropy
- 4.5. Patent/Trademark Analysis
- 5. Global Sickle Cell Treatment Market Analysis, Insights and Forecast, 2020-2032
- 5.1. Market Analysis, Insights and Forecast - by Treatment Modality
- 5.1.1. Blood Transfusion
- 5.1.2. Bone Marrow Transplant
- 5.1.3. Pharmacotherapy
- 5.2. Market Analysis, Insights and Forecast - by End User
- 5.2.1. Hospitals
- 5.2.2. Specialty Clinics
- 5.2.3. Other End Users
- 5.3. Market Analysis, Insights and Forecast - by Region
- 5.3.1. North America
- 5.3.2. Europe
- 5.3.3. Asia Pacific
- 5.3.4. Middle East and Africa
- 5.3.5. South America
- 5.1. Market Analysis, Insights and Forecast - by Treatment Modality
- 6. North America Sickle Cell Treatment Market Analysis, Insights and Forecast, 2020-2032
- 6.1. Market Analysis, Insights and Forecast - by Treatment Modality
- 6.1.1. Blood Transfusion
- 6.1.2. Bone Marrow Transplant
- 6.1.3. Pharmacotherapy
- 6.2. Market Analysis, Insights and Forecast - by End User
- 6.2.1. Hospitals
- 6.2.2. Specialty Clinics
- 6.2.3. Other End Users
- 6.1. Market Analysis, Insights and Forecast - by Treatment Modality
- 7. Europe Sickle Cell Treatment Market Analysis, Insights and Forecast, 2020-2032
- 7.1. Market Analysis, Insights and Forecast - by Treatment Modality
- 7.1.1. Blood Transfusion
- 7.1.2. Bone Marrow Transplant
- 7.1.3. Pharmacotherapy
- 7.2. Market Analysis, Insights and Forecast - by End User
- 7.2.1. Hospitals
- 7.2.2. Specialty Clinics
- 7.2.3. Other End Users
- 7.1. Market Analysis, Insights and Forecast - by Treatment Modality
- 8. Asia Pacific Sickle Cell Treatment Market Analysis, Insights and Forecast, 2020-2032
- 8.1. Market Analysis, Insights and Forecast - by Treatment Modality
- 8.1.1. Blood Transfusion
- 8.1.2. Bone Marrow Transplant
- 8.1.3. Pharmacotherapy
- 8.2. Market Analysis, Insights and Forecast - by End User
- 8.2.1. Hospitals
- 8.2.2. Specialty Clinics
- 8.2.3. Other End Users
- 8.1. Market Analysis, Insights and Forecast - by Treatment Modality
- 9. Middle East and Africa Sickle Cell Treatment Market Analysis, Insights and Forecast, 2020-2032
- 9.1. Market Analysis, Insights and Forecast - by Treatment Modality
- 9.1.1. Blood Transfusion
- 9.1.2. Bone Marrow Transplant
- 9.1.3. Pharmacotherapy
- 9.2. Market Analysis, Insights and Forecast - by End User
- 9.2.1. Hospitals
- 9.2.2. Specialty Clinics
- 9.2.3. Other End Users
- 9.1. Market Analysis, Insights and Forecast - by Treatment Modality
- 10. South America Sickle Cell Treatment Market Analysis, Insights and Forecast, 2020-2032
- 10.1. Market Analysis, Insights and Forecast - by Treatment Modality
- 10.1.1. Blood Transfusion
- 10.1.2. Bone Marrow Transplant
- 10.1.3. Pharmacotherapy
- 10.2. Market Analysis, Insights and Forecast - by End User
- 10.2.1. Hospitals
- 10.2.2. Specialty Clinics
- 10.2.3. Other End Users
- 10.1. Market Analysis, Insights and Forecast - by Treatment Modality
- 11. Competitive Analysis
- 11.1. Global Market Share Analysis 2025
- 11.2. Company Profiles
- 11.2.1 Sanofi SA
- 11.2.1.1. Overview
- 11.2.1.2. Products
- 11.2.1.3. SWOT Analysis
- 11.2.1.4. Recent Developments
- 11.2.1.5. Financials (Based on Availability)
- 11.2.2 CRISPR Therapeutic
- 11.2.2.1. Overview
- 11.2.2.2. Products
- 11.2.2.3. SWOT Analysis
- 11.2.2.4. Recent Developments
- 11.2.2.5. Financials (Based on Availability)
- 11.2.3 Bluebird Biotechnology
- 11.2.3.1. Overview
- 11.2.3.2. Products
- 11.2.3.3. SWOT Analysis
- 11.2.3.4. Recent Developments
- 11.2.3.5. Financials (Based on Availability)
- 11.2.4 Bristol Myers Squibb Co
- 11.2.4.1. Overview
- 11.2.4.2. Products
- 11.2.4.3. SWOT Analysis
- 11.2.4.4. Recent Developments
- 11.2.4.5. Financials (Based on Availability)
- 11.2.5 Novartis AG
- 11.2.5.1. Overview
- 11.2.5.2. Products
- 11.2.5.3. SWOT Analysis
- 11.2.5.4. Recent Developments
- 11.2.5.5. Financials (Based on Availability)
- 11.2.6 Medunik USA
- 11.2.6.1. Overview
- 11.2.6.2. Products
- 11.2.6.3. SWOT Analysis
- 11.2.6.4. Recent Developments
- 11.2.6.5. Financials (Based on Availability)
- 11.2.7 Addmedica
- 11.2.7.1. Overview
- 11.2.7.2. Products
- 11.2.7.3. SWOT Analysis
- 11.2.7.4. Recent Developments
- 11.2.7.5. Financials (Based on Availability)
- 11.2.8 Glycomimetics Inc
- 11.2.8.1. Overview
- 11.2.8.2. Products
- 11.2.8.3. SWOT Analysis
- 11.2.8.4. Recent Developments
- 11.2.8.5. Financials (Based on Availability)
- 11.2.9 Aruvant Sciences Inc
- 11.2.9.1. Overview
- 11.2.9.2. Products
- 11.2.9.3. SWOT Analysis
- 11.2.9.4. Recent Developments
- 11.2.9.5. Financials (Based on Availability)
- 11.2.10 Emmaus Medical Inc
- 11.2.10.1. Overview
- 11.2.10.2. Products
- 11.2.10.3. SWOT Analysis
- 11.2.10.4. Recent Developments
- 11.2.10.5. Financials (Based on Availability)
- 11.2.11 Global Blood Therapeutics Inc
- 11.2.11.1. Overview
- 11.2.11.2. Products
- 11.2.11.3. SWOT Analysis
- 11.2.11.4. Recent Developments
- 11.2.11.5. Financials (Based on Availability)
- 11.2.12 Editas Medicine Inc
- 11.2.12.1. Overview
- 11.2.12.2. Products
- 11.2.12.3. SWOT Analysis
- 11.2.12.4. Recent Developments
- 11.2.12.5. Financials (Based on Availability)
- 11.2.13 Pfizer Inc
- 11.2.13.1. Overview
- 11.2.13.2. Products
- 11.2.13.3. SWOT Analysis
- 11.2.13.4. Recent Developments
- 11.2.13.5. Financials (Based on Availability)
- 11.2.1 Sanofi SA
List of Figures
- Figure 1: Global Sickle Cell Treatment Market Revenue Breakdown (Million, %) by Region 2025 & 2033
- Figure 2: Global Sickle Cell Treatment Market Volume Breakdown (K Unit, %) by Region 2025 & 2033
- Figure 3: North America Sickle Cell Treatment Market Revenue (Million), by Treatment Modality 2025 & 2033
- Figure 4: North America Sickle Cell Treatment Market Volume (K Unit), by Treatment Modality 2025 & 2033
- Figure 5: North America Sickle Cell Treatment Market Revenue Share (%), by Treatment Modality 2025 & 2033
- Figure 6: North America Sickle Cell Treatment Market Volume Share (%), by Treatment Modality 2025 & 2033
- Figure 7: North America Sickle Cell Treatment Market Revenue (Million), by End User 2025 & 2033
- Figure 8: North America Sickle Cell Treatment Market Volume (K Unit), by End User 2025 & 2033
- Figure 9: North America Sickle Cell Treatment Market Revenue Share (%), by End User 2025 & 2033
- Figure 10: North America Sickle Cell Treatment Market Volume Share (%), by End User 2025 & 2033
- Figure 11: North America Sickle Cell Treatment Market Revenue (Million), by Country 2025 & 2033
- Figure 12: North America Sickle Cell Treatment Market Volume (K Unit), by Country 2025 & 2033
- Figure 13: North America Sickle Cell Treatment Market Revenue Share (%), by Country 2025 & 2033
- Figure 14: North America Sickle Cell Treatment Market Volume Share (%), by Country 2025 & 2033
- Figure 15: Europe Sickle Cell Treatment Market Revenue (Million), by Treatment Modality 2025 & 2033
- Figure 16: Europe Sickle Cell Treatment Market Volume (K Unit), by Treatment Modality 2025 & 2033
- Figure 17: Europe Sickle Cell Treatment Market Revenue Share (%), by Treatment Modality 2025 & 2033
- Figure 18: Europe Sickle Cell Treatment Market Volume Share (%), by Treatment Modality 2025 & 2033
- Figure 19: Europe Sickle Cell Treatment Market Revenue (Million), by End User 2025 & 2033
- Figure 20: Europe Sickle Cell Treatment Market Volume (K Unit), by End User 2025 & 2033
- Figure 21: Europe Sickle Cell Treatment Market Revenue Share (%), by End User 2025 & 2033
- Figure 22: Europe Sickle Cell Treatment Market Volume Share (%), by End User 2025 & 2033
- Figure 23: Europe Sickle Cell Treatment Market Revenue (Million), by Country 2025 & 2033
- Figure 24: Europe Sickle Cell Treatment Market Volume (K Unit), by Country 2025 & 2033
- Figure 25: Europe Sickle Cell Treatment Market Revenue Share (%), by Country 2025 & 2033
- Figure 26: Europe Sickle Cell Treatment Market Volume Share (%), by Country 2025 & 2033
- Figure 27: Asia Pacific Sickle Cell Treatment Market Revenue (Million), by Treatment Modality 2025 & 2033
- Figure 28: Asia Pacific Sickle Cell Treatment Market Volume (K Unit), by Treatment Modality 2025 & 2033
- Figure 29: Asia Pacific Sickle Cell Treatment Market Revenue Share (%), by Treatment Modality 2025 & 2033
- Figure 30: Asia Pacific Sickle Cell Treatment Market Volume Share (%), by Treatment Modality 2025 & 2033
- Figure 31: Asia Pacific Sickle Cell Treatment Market Revenue (Million), by End User 2025 & 2033
- Figure 32: Asia Pacific Sickle Cell Treatment Market Volume (K Unit), by End User 2025 & 2033
- Figure 33: Asia Pacific Sickle Cell Treatment Market Revenue Share (%), by End User 2025 & 2033
- Figure 34: Asia Pacific Sickle Cell Treatment Market Volume Share (%), by End User 2025 & 2033
- Figure 35: Asia Pacific Sickle Cell Treatment Market Revenue (Million), by Country 2025 & 2033
- Figure 36: Asia Pacific Sickle Cell Treatment Market Volume (K Unit), by Country 2025 & 2033
- Figure 37: Asia Pacific Sickle Cell Treatment Market Revenue Share (%), by Country 2025 & 2033
- Figure 38: Asia Pacific Sickle Cell Treatment Market Volume Share (%), by Country 2025 & 2033
- Figure 39: Middle East and Africa Sickle Cell Treatment Market Revenue (Million), by Treatment Modality 2025 & 2033
- Figure 40: Middle East and Africa Sickle Cell Treatment Market Volume (K Unit), by Treatment Modality 2025 & 2033
- Figure 41: Middle East and Africa Sickle Cell Treatment Market Revenue Share (%), by Treatment Modality 2025 & 2033
- Figure 42: Middle East and Africa Sickle Cell Treatment Market Volume Share (%), by Treatment Modality 2025 & 2033
- Figure 43: Middle East and Africa Sickle Cell Treatment Market Revenue (Million), by End User 2025 & 2033
- Figure 44: Middle East and Africa Sickle Cell Treatment Market Volume (K Unit), by End User 2025 & 2033
- Figure 45: Middle East and Africa Sickle Cell Treatment Market Revenue Share (%), by End User 2025 & 2033
- Figure 46: Middle East and Africa Sickle Cell Treatment Market Volume Share (%), by End User 2025 & 2033
- Figure 47: Middle East and Africa Sickle Cell Treatment Market Revenue (Million), by Country 2025 & 2033
- Figure 48: Middle East and Africa Sickle Cell Treatment Market Volume (K Unit), by Country 2025 & 2033
- Figure 49: Middle East and Africa Sickle Cell Treatment Market Revenue Share (%), by Country 2025 & 2033
- Figure 50: Middle East and Africa Sickle Cell Treatment Market Volume Share (%), by Country 2025 & 2033
- Figure 51: South America Sickle Cell Treatment Market Revenue (Million), by Treatment Modality 2025 & 2033
- Figure 52: South America Sickle Cell Treatment Market Volume (K Unit), by Treatment Modality 2025 & 2033
- Figure 53: South America Sickle Cell Treatment Market Revenue Share (%), by Treatment Modality 2025 & 2033
- Figure 54: South America Sickle Cell Treatment Market Volume Share (%), by Treatment Modality 2025 & 2033
- Figure 55: South America Sickle Cell Treatment Market Revenue (Million), by End User 2025 & 2033
- Figure 56: South America Sickle Cell Treatment Market Volume (K Unit), by End User 2025 & 2033
- Figure 57: South America Sickle Cell Treatment Market Revenue Share (%), by End User 2025 & 2033
- Figure 58: South America Sickle Cell Treatment Market Volume Share (%), by End User 2025 & 2033
- Figure 59: South America Sickle Cell Treatment Market Revenue (Million), by Country 2025 & 2033
- Figure 60: South America Sickle Cell Treatment Market Volume (K Unit), by Country 2025 & 2033
- Figure 61: South America Sickle Cell Treatment Market Revenue Share (%), by Country 2025 & 2033
- Figure 62: South America Sickle Cell Treatment Market Volume Share (%), by Country 2025 & 2033
List of Tables
- Table 1: Global Sickle Cell Treatment Market Revenue Million Forecast, by Treatment Modality 2020 & 2033
- Table 2: Global Sickle Cell Treatment Market Volume K Unit Forecast, by Treatment Modality 2020 & 2033
- Table 3: Global Sickle Cell Treatment Market Revenue Million Forecast, by End User 2020 & 2033
- Table 4: Global Sickle Cell Treatment Market Volume K Unit Forecast, by End User 2020 & 2033
- Table 5: Global Sickle Cell Treatment Market Revenue Million Forecast, by Region 2020 & 2033
- Table 6: Global Sickle Cell Treatment Market Volume K Unit Forecast, by Region 2020 & 2033
- Table 7: Global Sickle Cell Treatment Market Revenue Million Forecast, by Treatment Modality 2020 & 2033
- Table 8: Global Sickle Cell Treatment Market Volume K Unit Forecast, by Treatment Modality 2020 & 2033
- Table 9: Global Sickle Cell Treatment Market Revenue Million Forecast, by End User 2020 & 2033
- Table 10: Global Sickle Cell Treatment Market Volume K Unit Forecast, by End User 2020 & 2033
- Table 11: Global Sickle Cell Treatment Market Revenue Million Forecast, by Country 2020 & 2033
- Table 12: Global Sickle Cell Treatment Market Volume K Unit Forecast, by Country 2020 & 2033
- Table 13: United States Sickle Cell Treatment Market Revenue (Million) Forecast, by Application 2020 & 2033
- Table 14: United States Sickle Cell Treatment Market Volume (K Unit) Forecast, by Application 2020 & 2033
- Table 15: Canada Sickle Cell Treatment Market Revenue (Million) Forecast, by Application 2020 & 2033
- Table 16: Canada Sickle Cell Treatment Market Volume (K Unit) Forecast, by Application 2020 & 2033
- Table 17: Mexico Sickle Cell Treatment Market Revenue (Million) Forecast, by Application 2020 & 2033
- Table 18: Mexico Sickle Cell Treatment Market Volume (K Unit) Forecast, by Application 2020 & 2033
- Table 19: Global Sickle Cell Treatment Market Revenue Million Forecast, by Treatment Modality 2020 & 2033
- Table 20: Global Sickle Cell Treatment Market Volume K Unit Forecast, by Treatment Modality 2020 & 2033
- Table 21: Global Sickle Cell Treatment Market Revenue Million Forecast, by End User 2020 & 2033
- Table 22: Global Sickle Cell Treatment Market Volume K Unit Forecast, by End User 2020 & 2033
- Table 23: Global Sickle Cell Treatment Market Revenue Million Forecast, by Country 2020 & 2033
- Table 24: Global Sickle Cell Treatment Market Volume K Unit Forecast, by Country 2020 & 2033
- Table 25: Germany Sickle Cell Treatment Market Revenue (Million) Forecast, by Application 2020 & 2033
- Table 26: Germany Sickle Cell Treatment Market Volume (K Unit) Forecast, by Application 2020 & 2033
- Table 27: United Kingdom Sickle Cell Treatment Market Revenue (Million) Forecast, by Application 2020 & 2033
- Table 28: United Kingdom Sickle Cell Treatment Market Volume (K Unit) Forecast, by Application 2020 & 2033
- Table 29: France Sickle Cell Treatment Market Revenue (Million) Forecast, by Application 2020 & 2033
- Table 30: France Sickle Cell Treatment Market Volume (K Unit) Forecast, by Application 2020 & 2033
- Table 31: Italy Sickle Cell Treatment Market Revenue (Million) Forecast, by Application 2020 & 2033
- Table 32: Italy Sickle Cell Treatment Market Volume (K Unit) Forecast, by Application 2020 & 2033
- Table 33: Spain Sickle Cell Treatment Market Revenue (Million) Forecast, by Application 2020 & 2033
- Table 34: Spain Sickle Cell Treatment Market Volume (K Unit) Forecast, by Application 2020 & 2033
- Table 35: Rest of Europe Sickle Cell Treatment Market Revenue (Million) Forecast, by Application 2020 & 2033
- Table 36: Rest of Europe Sickle Cell Treatment Market Volume (K Unit) Forecast, by Application 2020 & 2033
- Table 37: Global Sickle Cell Treatment Market Revenue Million Forecast, by Treatment Modality 2020 & 2033
- Table 38: Global Sickle Cell Treatment Market Volume K Unit Forecast, by Treatment Modality 2020 & 2033
- Table 39: Global Sickle Cell Treatment Market Revenue Million Forecast, by End User 2020 & 2033
- Table 40: Global Sickle Cell Treatment Market Volume K Unit Forecast, by End User 2020 & 2033
- Table 41: Global Sickle Cell Treatment Market Revenue Million Forecast, by Country 2020 & 2033
- Table 42: Global Sickle Cell Treatment Market Volume K Unit Forecast, by Country 2020 & 2033
- Table 43: China Sickle Cell Treatment Market Revenue (Million) Forecast, by Application 2020 & 2033
- Table 44: China Sickle Cell Treatment Market Volume (K Unit) Forecast, by Application 2020 & 2033
- Table 45: Japan Sickle Cell Treatment Market Revenue (Million) Forecast, by Application 2020 & 2033
- Table 46: Japan Sickle Cell Treatment Market Volume (K Unit) Forecast, by Application 2020 & 2033
- Table 47: India Sickle Cell Treatment Market Revenue (Million) Forecast, by Application 2020 & 2033
- Table 48: India Sickle Cell Treatment Market Volume (K Unit) Forecast, by Application 2020 & 2033
- Table 49: Australia Sickle Cell Treatment Market Revenue (Million) Forecast, by Application 2020 & 2033
- Table 50: Australia Sickle Cell Treatment Market Volume (K Unit) Forecast, by Application 2020 & 2033
- Table 51: South Korea Sickle Cell Treatment Market Revenue (Million) Forecast, by Application 2020 & 2033
- Table 52: South Korea Sickle Cell Treatment Market Volume (K Unit) Forecast, by Application 2020 & 2033
- Table 53: Rest of Asia Pacific Sickle Cell Treatment Market Revenue (Million) Forecast, by Application 2020 & 2033
- Table 54: Rest of Asia Pacific Sickle Cell Treatment Market Volume (K Unit) Forecast, by Application 2020 & 2033
- Table 55: Global Sickle Cell Treatment Market Revenue Million Forecast, by Treatment Modality 2020 & 2033
- Table 56: Global Sickle Cell Treatment Market Volume K Unit Forecast, by Treatment Modality 2020 & 2033
- Table 57: Global Sickle Cell Treatment Market Revenue Million Forecast, by End User 2020 & 2033
- Table 58: Global Sickle Cell Treatment Market Volume K Unit Forecast, by End User 2020 & 2033
- Table 59: Global Sickle Cell Treatment Market Revenue Million Forecast, by Country 2020 & 2033
- Table 60: Global Sickle Cell Treatment Market Volume K Unit Forecast, by Country 2020 & 2033
- Table 61: GCC Sickle Cell Treatment Market Revenue (Million) Forecast, by Application 2020 & 2033
- Table 62: GCC Sickle Cell Treatment Market Volume (K Unit) Forecast, by Application 2020 & 2033
- Table 63: South Africa Sickle Cell Treatment Market Revenue (Million) Forecast, by Application 2020 & 2033
- Table 64: South Africa Sickle Cell Treatment Market Volume (K Unit) Forecast, by Application 2020 & 2033
- Table 65: Rest of Middle East and Africa Sickle Cell Treatment Market Revenue (Million) Forecast, by Application 2020 & 2033
- Table 66: Rest of Middle East and Africa Sickle Cell Treatment Market Volume (K Unit) Forecast, by Application 2020 & 2033
- Table 67: Global Sickle Cell Treatment Market Revenue Million Forecast, by Treatment Modality 2020 & 2033
- Table 68: Global Sickle Cell Treatment Market Volume K Unit Forecast, by Treatment Modality 2020 & 2033
- Table 69: Global Sickle Cell Treatment Market Revenue Million Forecast, by End User 2020 & 2033
- Table 70: Global Sickle Cell Treatment Market Volume K Unit Forecast, by End User 2020 & 2033
- Table 71: Global Sickle Cell Treatment Market Revenue Million Forecast, by Country 2020 & 2033
- Table 72: Global Sickle Cell Treatment Market Volume K Unit Forecast, by Country 2020 & 2033
- Table 73: Brazil Sickle Cell Treatment Market Revenue (Million) Forecast, by Application 2020 & 2033
- Table 74: Brazil Sickle Cell Treatment Market Volume (K Unit) Forecast, by Application 2020 & 2033
- Table 75: Argentina Sickle Cell Treatment Market Revenue (Million) Forecast, by Application 2020 & 2033
- Table 76: Argentina Sickle Cell Treatment Market Volume (K Unit) Forecast, by Application 2020 & 2033
- Table 77: Rest of South America Sickle Cell Treatment Market Revenue (Million) Forecast, by Application 2020 & 2033
- Table 78: Rest of South America Sickle Cell Treatment Market Volume (K Unit) Forecast, by Application 2020 & 2033
Frequently Asked Questions
1. What is the projected Compound Annual Growth Rate (CAGR) of the Sickle Cell Treatment Market?
The projected CAGR is approximately 12.98%.
2. Which companies are prominent players in the Sickle Cell Treatment Market?
Key companies in the market include Sanofi SA, CRISPR Therapeutic, Bluebird Biotechnology, Bristol Myers Squibb Co, Novartis AG, Medunik USA, Addmedica, Glycomimetics Inc, Aruvant Sciences Inc, Emmaus Medical Inc, Global Blood Therapeutics Inc, Editas Medicine Inc, Pfizer Inc.
3. What are the main segments of the Sickle Cell Treatment Market?
The market segments include Treatment Modality, End User.
4. Can you provide details about the market size?
The market size is estimated to be USD 3.32 Million as of 2022.
5. What are some drivers contributing to market growth?
Increasing Prevalence of Sickle Cell Disease; Increasing R&D Activity.
6. What are the notable trends driving market growth?
Blood Transfusion Segment is Expected to Witness Significant Growth Over the Forecast Period.
7. Are there any restraints impacting market growth?
High Cost of Treatment.
8. Can you provide examples of recent developments in the market?
In December 2022, Bluebird Bio Inc. announced that the US FDA had lifted a partial clinical hold on studies for its gene therapy to treat the blood disorder sickle cell disease.
9. What pricing options are available for accessing the report?
Pricing options include single-user, multi-user, and enterprise licenses priced at USD 4750, USD 5250, and USD 8750 respectively.
10. Is the market size provided in terms of value or volume?
The market size is provided in terms of value, measured in Million and volume, measured in K Unit.
11. Are there any specific market keywords associated with the report?
Yes, the market keyword associated with the report is "Sickle Cell Treatment Market," which aids in identifying and referencing the specific market segment covered.
12. How do I determine which pricing option suits my needs best?
The pricing options vary based on user requirements and access needs. Individual users may opt for single-user licenses, while businesses requiring broader access may choose multi-user or enterprise licenses for cost-effective access to the report.
13. Are there any additional resources or data provided in the Sickle Cell Treatment Market report?
While the report offers comprehensive insights, it's advisable to review the specific contents or supplementary materials provided to ascertain if additional resources or data are available.
14. How can I stay updated on further developments or reports in the Sickle Cell Treatment Market?
To stay informed about further developments, trends, and reports in the Sickle Cell Treatment Market, consider subscribing to industry newsletters, following relevant companies and organizations, or regularly checking reputable industry news sources and publications.
Methodology
Step 1 - Identification of Relevant Samples Size from Population Database


Step 2 - Approaches for Defining Global Market Size (Value, Volume* & Price*)

Note*: In applicable scenarios
Step 3 - Data Sources
Primary Research
- Web Analytics
- Survey Reports
- Research Institute
- Latest Research Reports
- Opinion Leaders
Secondary Research
- Annual Reports
- White Paper
- Latest Press Release
- Industry Association
- Paid Database
- Investor Presentations

Step 4 - Data Triangulation
Involves using different sources of information in order to increase the validity of a study
These sources are likely to be stakeholders in a program - participants, other researchers, program staff, other community members, and so on.
Then we put all data in single framework & apply various statistical tools to find out the dynamic on the market.
During the analysis stage, feedback from the stakeholder groups would be compared to determine areas of agreement as well as areas of divergence