

Key Insights
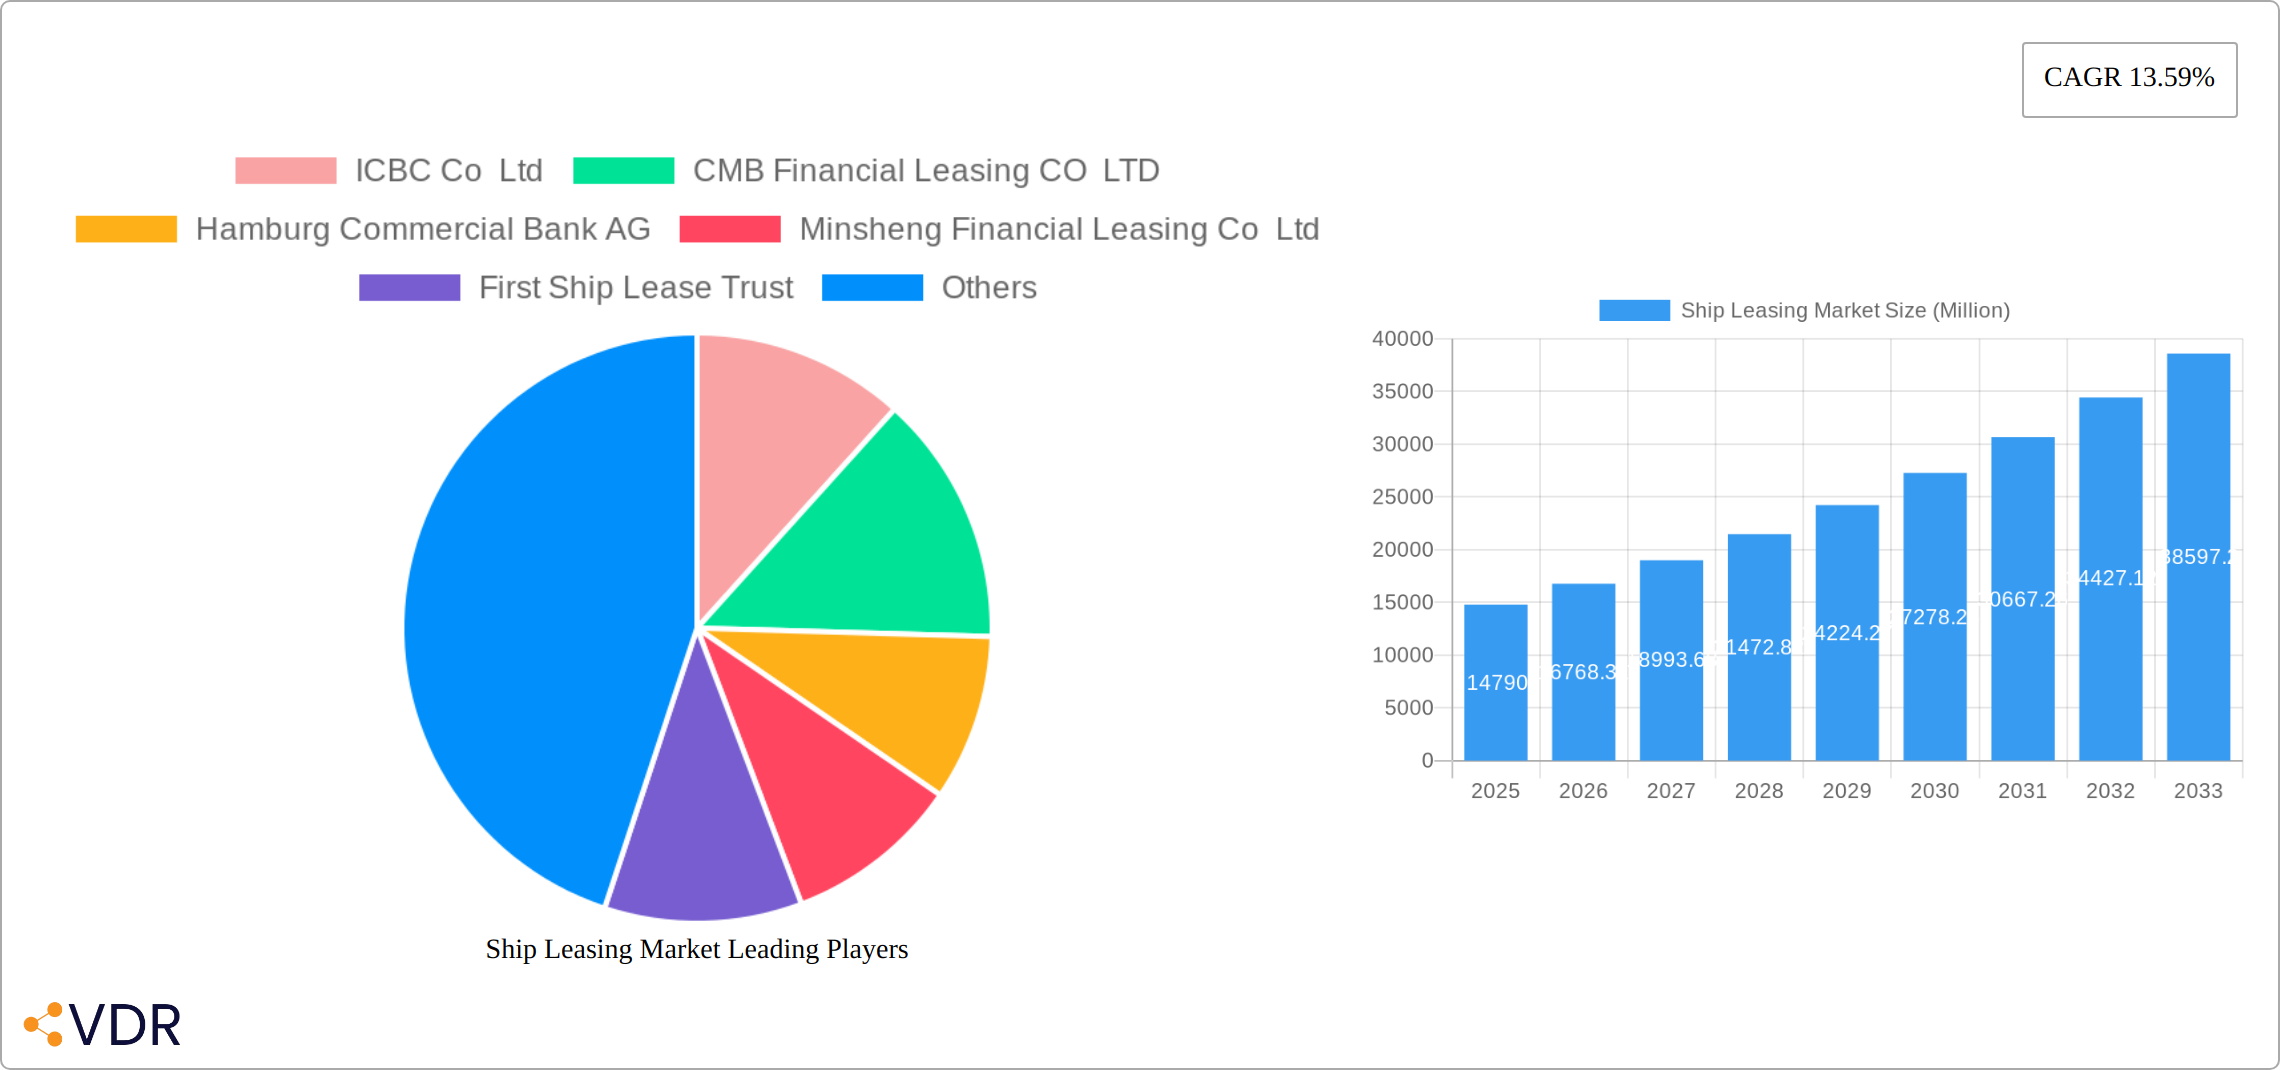
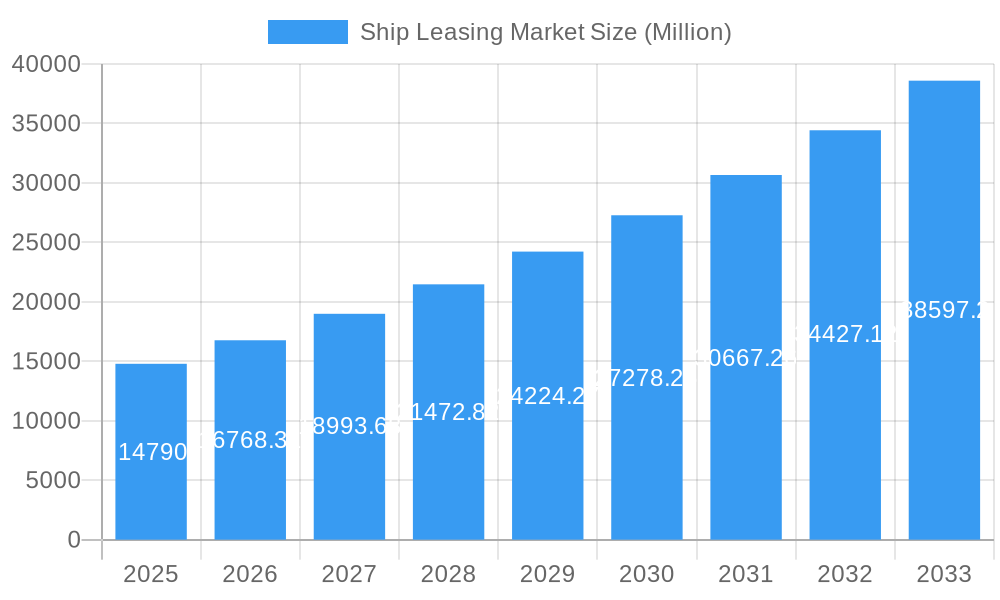
The global ship leasing market, valued at $14.79 billion in 2025, is projected to experience robust growth, driven by a Compound Annual Growth Rate (CAGR) of 13.59% from 2025 to 2033. This expansion is fueled by several key factors. Increasing global trade volumes necessitate a larger shipping fleet, stimulating demand for leasing arrangements. The preference for operational efficiency and cost optimization among shipping companies is another major driver, as leasing allows them to avoid the capital expenditure and operational complexities of vessel ownership. Furthermore, the growing adoption of advanced technologies within the shipping industry, such as real-time monitoring and data analytics, contributes to market growth by improving operational efficiency and risk management in leased vessels. The market is segmented by lease type (financial lease, full-service lease), application (container ships, bulk carriers), and lease duration (real-time lease, periodic tenancy, bareboat charter). Competitive dynamics are shaped by major players such as ICBC Co Ltd, CMB Financial Leasing Co LTD, and A P Møller - Mærsk A/S, who are constantly striving to expand their market share through strategic partnerships and investments. Geographic distribution of the market reveals strong growth in Asia-Pacific and North America, reflecting the high levels of maritime trade activity in these regions. The emergence of new technologies and evolving global trade patterns will likely influence market segmentation and player strategies in the coming years.
Ship Leasing Market Market Size (In Billion)
The restraining factors for the market include cyclical fluctuations in the shipping industry and geopolitical uncertainties that affect global trade. However, these challenges are likely to be offset by the long-term trends of increasing global trade and the continued focus on operational efficiency in shipping. The diverse range of lease types and vessel applications within the market creates varied opportunities for specialized leasing providers. The industry is expected to witness consolidation as larger leasing companies strategically acquire smaller players, further enhancing the market's competitive landscape. Investment in sustainable shipping solutions and environmentally friendly vessels is also emerging as a significant factor, with environmentally conscious leasing policies expected to attract a greater market share. The continued growth in global container shipping, driven by e-commerce and globalization, will significantly bolster market growth over the forecast period.
Ship Leasing Market Company Market Share
Ship Leasing Market: A Comprehensive Report (2019-2033)
This comprehensive report provides a detailed analysis of the global Ship Leasing Market, encompassing its dynamics, growth trends, dominant segments, key players, and future outlook. The study period covers 2019-2033, with 2025 serving as the base and estimated year. The report segments the market by lease type (Financial Lease, Full-Service Lease), application (Container Ships, Bulk Carriers), and type (Real-Time Lease, Periodic Tenancy, Bareboat Charter, Other Types). The analysis incorporates both parent (Maritime Leasing) and child market (Ship Leasing) perspectives for a holistic understanding. Market values are presented in Million units.
Ship Leasing Market Dynamics & Structure
The global ship leasing market is characterized by moderate concentration, with a few large players dominating alongside numerous smaller, specialized firms. Technological innovation, particularly in ship design and operational efficiency, plays a significant role, impacting lease terms and overall market dynamics. Stringent regulatory frameworks governing maritime operations and environmental compliance significantly influence operational costs and leasing strategies. The market also faces competition from alternative transportation methods (e.g., rail, trucking) and internal pressures due to fluctuating fuel prices and global trade dynamics. Mergers and acquisitions (M&A) activity within the sector remains relatively steady, with larger players consolidating their market share. In 2024, approximately xx M&A deals were recorded, resulting in a xx% increase in market concentration compared to 2019.
- Market Concentration: Moderately concentrated, with top 5 players holding approximately xx% market share in 2024.
- Technological Innovation: Focus on fuel efficiency and automation drives market growth, but high initial investment presents a barrier.
- Regulatory Framework: IMO 2020 regulations and other environmental standards influence lease agreements and vessel specifications.
- Competitive Substitutes: Alternative transportation modes pose a competitive challenge, impacting demand for certain ship types.
- End-User Demographics: Market demand driven by global trade patterns and the transportation needs of diverse industries.
- M&A Trends: Consolidation through acquisitions is expected to continue, driven by economies of scale and market dominance strategies.
Ship Leasing Market Growth Trends & Insights
The global ship leasing market exhibited robust growth, achieving a Compound Annual Growth Rate (CAGR) of X% during the period 2019-2024, culminating in a market valuation of X Million by 2024. This expansion is primarily driven by the surge in global trade volumes, the increasing adoption of containerization, and a growing preference among shipping companies for leasing over outright vessel ownership. The integration of smart shipping technologies and the emergence of autonomous vessels are poised to significantly disrupt and reshape the market landscape. However, the market's trajectory is susceptible to external factors such as economic fluctuations, geopolitical uncertainties, and volatile fuel prices. Despite these challenges, the market penetration rate for leased vessels is projected to reach X% by 2033, underscoring the substantial growth potential within this sector.
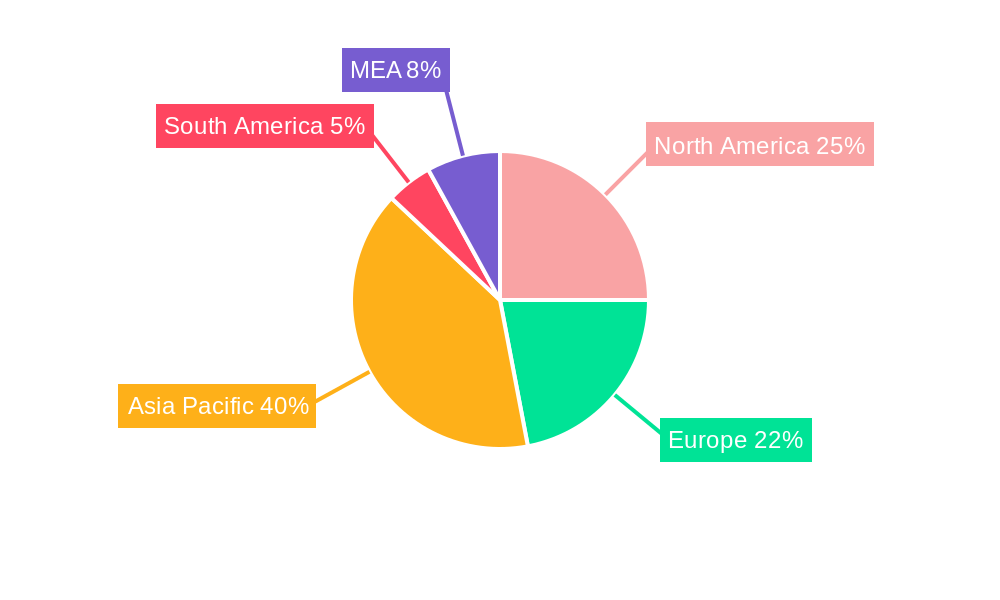
Dominant Regions, Countries, or Segments in Ship Leasing Market
Asia (particularly East Asia) emerged as the dominant region in the ship leasing market in 2024, holding approximately xx% of the global market share. This dominance is attributed to robust economic growth, expanding trade networks, and a substantial concentration of shipping companies and leasing firms within the region. The Container Ships segment holds the largest share within the application segment, followed by Bulk Carriers. Within lease types, Financial Lease continues to be the preferred method, accounting for over xx% of total lease contracts.
- Key Drivers in Asia: Strong economic growth, substantial shipping activity, and significant government investment in port infrastructure.
- Container Ships Dominance: Driven by increased global containerized trade and the expansion of e-commerce.
- Financial Lease Preference: Offers greater flexibility and cost-effectiveness compared to Full-Service Lease arrangements.
- Growth Potential: Emerging markets in Africa and South America present untapped potential for market expansion.
Ship Leasing Market Product Landscape
The ship leasing market offers a range of lease types, catering to diverse client needs and risk profiles. Innovations focus on enhancing vessel efficiency, incorporating advanced technologies (e.g., digitalization, automation), and improving environmental performance to meet stringent regulatory requirements. Unique selling propositions center on customized lease terms, flexible financing options, and comprehensive risk management solutions. Technological advancements in vessel design, fuel efficiency, and emission control systems are driving product innovation and influencing leasing contracts.
Key Drivers, Barriers & Challenges in Ship Leasing Market
Key Drivers:
- Growing global trade and containerization.
- Increasing demand for efficient and environmentally friendly vessels.
- Favorable financing options and flexible lease terms.
Challenges & Restraints:
- Geopolitical instability and trade wars impacting shipping routes and demand.
- Fluctuating fuel prices impacting operational costs and lease agreements.
- Stringent environmental regulations increasing compliance costs.
- Supply chain disruptions impacting vessel availability and delivery times.
Emerging Opportunities in Ship Leasing Market
- E-commerce Boom: The exponential growth of e-commerce fuels the demand for specialized container ships, creating lucrative leasing opportunities.
- Alternative Fuels: The expansion of LNG and other alternative fuel technologies presents a new wave of leasing prospects for environmentally friendly vessels.
- Digital Transformation: Innovative digital platforms are streamlining leasing processes, enhancing efficiency and transparency across the market.
- Sustainable Shipping: The increasing focus on sustainable shipping practices is driving demand for eco-friendly leasing solutions, fostering a greener maritime industry.
- Short-Term Charters: Increased demand for flexibility is driving growth in short-term charter agreements, offering both owners and operators greater adaptability.
Growth Accelerators in the Ship Leasing Market Industry
Strategic alliances between ship owners, leasing companies, and technology providers are significantly accelerating market expansion. The integration of advanced technologies such as automation, AI, and IoT is optimizing vessel efficiency and reducing operational costs. Furthermore, the expansion into developing economies with nascent shipping industries presents considerable untapped growth potential.
Key Players Shaping the Ship Leasing Market Market
- ICBC Co Ltd
- CMB Financial Leasing CO LTD
- Hamburg Commercial Bank AG
- Minsheng Financial Leasing Co Ltd
- First Ship Lease Trust
- MUFG Bank Ltd
- Bothra Group
- Bank of Communications Financial Leasing Co Ltd
- Galbraiths Ltd
- A P Møller - Mærsk A/S
- Global Ship Lease Inc
Notable Milestones in Ship Leasing Market Sector
- 2020: Implementation of IMO 2020 sulfur cap significantly impacts vessel specifications and lease agreements.
- 2022: Increased M&A activity consolidates market share among major players.
- 2023: Several leasing companies launch new digital platforms for improved efficiency.
- 2024: Significant investments in LNG-powered vessels drive growth in this segment.
In-Depth Ship Leasing Market Market Outlook
The ship leasing market is poised for continued growth driven by global trade expansion, technological advancements, and the increasing preference for leasing among shipping companies. Strategic partnerships, technological innovation, and expansion into emerging markets will play a crucial role in shaping the future market landscape. The focus on sustainable shipping and decarbonization will present both opportunities and challenges for market players in the coming years.
Ship Leasing Market Segmentation
-
1. Lease Type
- 1.1. Financial Lease
- 1.2. Full-Service Lease
-
2. Application
- 2.1. Container Ships
- 2.2. Bulk Carriers
-
3. Type
- 3.1. Real-Time Lease
- 3.2. Periodic Tenancy
- 3.3. Bareboat Charter
- 3.4. Other Types
Ship Leasing Market Segmentation By Geography
-
1. North America
- 1.1. United States
- 1.2. Canada
-
2. Europe
- 2.1. United Kingdom
- 2.2. France
- 2.3. Germany
- 2.4. Rest of Europe
-
3. Asia Pacific
- 3.1. China
- 3.2. India
- 3.3. Japan
- 3.4. South Korea
- 3.5. Rest of Asia Pacific
-
4. Latin America
- 4.1. Brazil
- 4.2. Rest of Latin America
-
5. Middle East and Africa
- 5.1. United Arab Emirates
- 5.2. Saudi Arabia
- 5.3. South Africa
- 5.4. Rest of Middle East and Africa
Ship Leasing Market Regional Market Share
Geographic Coverage of Ship Leasing Market
Ship Leasing Market REPORT HIGHLIGHTS
| Aspects | Details |
|---|---|
| Study Period | 2020-2034 |
| Base Year | 2025 |
| Estimated Year | 2026 |
| Forecast Period | 2026-2034 |
| Historical Period | 2020-2025 |
| Growth Rate | CAGR of 12% from 2020-2034 |
| Segmentation |
|
Table of Contents
- 1. Introduction
- 1.1. Research Scope
- 1.2. Market Segmentation
- 1.3. Research Objective
- 1.4. Definitions and Assumptions
- 2. Executive Summary
- 2.1. Market Snapshot
- 3. Market Dynamics
- 3.1. Market Drivers
- 3.2. Market Restrains
- 3.3. Market Trends
- 3.4. Market Opportunities
- 4. Market Factor Analysis
- 4.1. Porters Five Forces
- 4.1.1. Bargaining Power of Suppliers
- 4.1.2. Bargaining Power of Buyers
- 4.1.3. Threat of New Entrants
- 4.1.4. Threat of Substitutes
- 4.1.5. Competitive Rivalry
- 4.2. PESTEL analysis
- 4.3. BCG Analysis
- 4.3.1. Stars (High Growth, High Market Share)
- 4.3.2. Cash Cows (Low Growth, High Market Share)
- 4.3.3. Question Mark (High Growth, Low Market Share)
- 4.3.4. Dogs (Low Growth, Low Market Share)
- 4.4. Ansoff Matrix Analysis
- 4.5. Supply Chain Analysis
- 4.6. Regulatory Landscape
- 4.7. Current Market Potential and Opportunity Assessment (TAM–SAM–SOM Framework)
- 4.8. VDR Analyst Note
- 4.1. Porters Five Forces
- 5. Market Analysis, Insights and Forecast 2021-2033
- 5.1. Market Analysis, Insights and Forecast - by Lease Type
- 5.1.1. Financial Lease
- 5.1.2. Full-Service Lease
- 5.2. Market Analysis, Insights and Forecast - by Application
- 5.2.1. Container Ships
- 5.2.2. Bulk Carriers
- 5.3. Market Analysis, Insights and Forecast - by Type
- 5.3.1. Real-Time Lease
- 5.3.2. Periodic Tenancy
- 5.3.3. Bareboat Charter
- 5.3.4. Other Types
- 5.4. Market Analysis, Insights and Forecast - by Region
- 5.4.1. North America
- 5.4.2. Europe
- 5.4.3. Asia Pacific
- 5.4.4. Latin America
- 5.4.5. Middle East and Africa
- 5.1. Market Analysis, Insights and Forecast - by Lease Type
- 6. Global Ship Leasing Market Analysis, Insights and Forecast, 2021-2033
- 6.1. Market Analysis, Insights and Forecast - by Lease Type
- 6.1.1. Financial Lease
- 6.1.2. Full-Service Lease
- 6.2. Market Analysis, Insights and Forecast - by Application
- 6.2.1. Container Ships
- 6.2.2. Bulk Carriers
- 6.3. Market Analysis, Insights and Forecast - by Type
- 6.3.1. Real-Time Lease
- 6.3.2. Periodic Tenancy
- 6.3.3. Bareboat Charter
- 6.3.4. Other Types
- 6.1. Market Analysis, Insights and Forecast - by Lease Type
- 7. North America Ship Leasing Market Analysis, Insights and Forecast, 2021-2033
- 7.1. Market Analysis, Insights and Forecast - by Lease Type
- 7.1.1. Financial Lease
- 7.1.2. Full-Service Lease
- 7.2. Market Analysis, Insights and Forecast - by Application
- 7.2.1. Container Ships
- 7.2.2. Bulk Carriers
- 7.3. Market Analysis, Insights and Forecast - by Type
- 7.3.1. Real-Time Lease
- 7.3.2. Periodic Tenancy
- 7.3.3. Bareboat Charter
- 7.3.4. Other Types
- 7.1. Market Analysis, Insights and Forecast - by Lease Type
- 8. Europe Ship Leasing Market Analysis, Insights and Forecast, 2021-2033
- 8.1. Market Analysis, Insights and Forecast - by Lease Type
- 8.1.1. Financial Lease
- 8.1.2. Full-Service Lease
- 8.2. Market Analysis, Insights and Forecast - by Application
- 8.2.1. Container Ships
- 8.2.2. Bulk Carriers
- 8.3. Market Analysis, Insights and Forecast - by Type
- 8.3.1. Real-Time Lease
- 8.3.2. Periodic Tenancy
- 8.3.3. Bareboat Charter
- 8.3.4. Other Types
- 8.1. Market Analysis, Insights and Forecast - by Lease Type
- 9. Asia Pacific Ship Leasing Market Analysis, Insights and Forecast, 2021-2033
- 9.1. Market Analysis, Insights and Forecast - by Lease Type
- 9.1.1. Financial Lease
- 9.1.2. Full-Service Lease
- 9.2. Market Analysis, Insights and Forecast - by Application
- 9.2.1. Container Ships
- 9.2.2. Bulk Carriers
- 9.3. Market Analysis, Insights and Forecast - by Type
- 9.3.1. Real-Time Lease
- 9.3.2. Periodic Tenancy
- 9.3.3. Bareboat Charter
- 9.3.4. Other Types
- 9.1. Market Analysis, Insights and Forecast - by Lease Type
- 10. Latin America Ship Leasing Market Analysis, Insights and Forecast, 2021-2033
- 10.1. Market Analysis, Insights and Forecast - by Lease Type
- 10.1.1. Financial Lease
- 10.1.2. Full-Service Lease
- 10.2. Market Analysis, Insights and Forecast - by Application
- 10.2.1. Container Ships
- 10.2.2. Bulk Carriers
- 10.3. Market Analysis, Insights and Forecast - by Type
- 10.3.1. Real-Time Lease
- 10.3.2. Periodic Tenancy
- 10.3.3. Bareboat Charter
- 10.3.4. Other Types
- 10.1. Market Analysis, Insights and Forecast - by Lease Type
- 11. Middle East and Africa Ship Leasing Market Analysis, Insights and Forecast, 2021-2033
- 11.1. Market Analysis, Insights and Forecast - by Lease Type
- 11.1.1. Financial Lease
- 11.1.2. Full-Service Lease
- 11.2. Market Analysis, Insights and Forecast - by Application
- 11.2.1. Container Ships
- 11.2.2. Bulk Carriers
- 11.3. Market Analysis, Insights and Forecast - by Type
- 11.3.1. Real-Time Lease
- 11.3.2. Periodic Tenancy
- 11.3.3. Bareboat Charter
- 11.3.4. Other Types
- 11.1. Market Analysis, Insights and Forecast - by Lease Type
- 12. Competitive Analysis
- 12.1. Company Profiles
- 12.1.1 ICBC Co Ltd
- 12.1.1.1. Company Overview
- 12.1.1.2. Products
- 12.1.1.3. Company Financials
- 12.1.1.4. SWOT Analysis
- 12.1.2 CMB Financial Leasing CO LTD
- 12.1.2.1. Company Overview
- 12.1.2.2. Products
- 12.1.2.3. Company Financials
- 12.1.2.4. SWOT Analysis
- 12.1.3 Hamburg Commercial Bank AG
- 12.1.3.1. Company Overview
- 12.1.3.2. Products
- 12.1.3.3. Company Financials
- 12.1.3.4. SWOT Analysis
- 12.1.4 Minsheng Financial Leasing Co Ltd
- 12.1.4.1. Company Overview
- 12.1.4.2. Products
- 12.1.4.3. Company Financials
- 12.1.4.4. SWOT Analysis
- 12.1.5 First Ship Lease Trust
- 12.1.5.1. Company Overview
- 12.1.5.2. Products
- 12.1.5.3. Company Financials
- 12.1.5.4. SWOT Analysis
- 12.1.6 MUFG Bank Ltd
- 12.1.6.1. Company Overview
- 12.1.6.2. Products
- 12.1.6.3. Company Financials
- 12.1.6.4. SWOT Analysis
- 12.1.7 Bothra Group
- 12.1.7.1. Company Overview
- 12.1.7.2. Products
- 12.1.7.3. Company Financials
- 12.1.7.4. SWOT Analysis
- 12.1.8 Bank of Communications Financial Leasing Co Ltd
- 12.1.8.1. Company Overview
- 12.1.8.2. Products
- 12.1.8.3. Company Financials
- 12.1.8.4. SWOT Analysis
- 12.1.9 Galbraiths Ltd
- 12.1.9.1. Company Overview
- 12.1.9.2. Products
- 12.1.9.3. Company Financials
- 12.1.9.4. SWOT Analysis
- 12.1.10 A P Møller - Mærsk A/S
- 12.1.10.1. Company Overview
- 12.1.10.2. Products
- 12.1.10.3. Company Financials
- 12.1.10.4. SWOT Analysis
- 12.1.11 Global Ship Lease Inc
- 12.1.11.1. Company Overview
- 12.1.11.2. Products
- 12.1.11.3. Company Financials
- 12.1.11.4. SWOT Analysis
- 12.1.1 ICBC Co Ltd
- 12.2. Market Entropy
- 12.2.1 Company's Key Areas Served
- 12.2.2 Recent Developments
- 12.3. Company Market Share Analysis 2025
- 12.3.1 Top 5 Companies Market Share Analysis
- 12.3.2 Top 3 Companies Market Share Analysis
- 12.4. List of Potential Customers
- 13. Research Methodology
List of Figures
- Figure 1: Global Ship Leasing Market Revenue Breakdown (billion, %) by Region 2025 & 2033
- Figure 2: North America Ship Leasing Market Revenue (billion), by Lease Type 2025 & 2033
- Figure 3: North America Ship Leasing Market Revenue Share (%), by Lease Type 2025 & 2033
- Figure 4: North America Ship Leasing Market Revenue (billion), by Application 2025 & 2033
- Figure 5: North America Ship Leasing Market Revenue Share (%), by Application 2025 & 2033
- Figure 6: North America Ship Leasing Market Revenue (billion), by Type 2025 & 2033
- Figure 7: North America Ship Leasing Market Revenue Share (%), by Type 2025 & 2033
- Figure 8: North America Ship Leasing Market Revenue (billion), by Country 2025 & 2033
- Figure 9: North America Ship Leasing Market Revenue Share (%), by Country 2025 & 2033
- Figure 10: Europe Ship Leasing Market Revenue (billion), by Lease Type 2025 & 2033
- Figure 11: Europe Ship Leasing Market Revenue Share (%), by Lease Type 2025 & 2033
- Figure 12: Europe Ship Leasing Market Revenue (billion), by Application 2025 & 2033
- Figure 13: Europe Ship Leasing Market Revenue Share (%), by Application 2025 & 2033
- Figure 14: Europe Ship Leasing Market Revenue (billion), by Type 2025 & 2033
- Figure 15: Europe Ship Leasing Market Revenue Share (%), by Type 2025 & 2033
- Figure 16: Europe Ship Leasing Market Revenue (billion), by Country 2025 & 2033
- Figure 17: Europe Ship Leasing Market Revenue Share (%), by Country 2025 & 2033
- Figure 18: Asia Pacific Ship Leasing Market Revenue (billion), by Lease Type 2025 & 2033
- Figure 19: Asia Pacific Ship Leasing Market Revenue Share (%), by Lease Type 2025 & 2033
- Figure 20: Asia Pacific Ship Leasing Market Revenue (billion), by Application 2025 & 2033
- Figure 21: Asia Pacific Ship Leasing Market Revenue Share (%), by Application 2025 & 2033
- Figure 22: Asia Pacific Ship Leasing Market Revenue (billion), by Type 2025 & 2033
- Figure 23: Asia Pacific Ship Leasing Market Revenue Share (%), by Type 2025 & 2033
- Figure 24: Asia Pacific Ship Leasing Market Revenue (billion), by Country 2025 & 2033
- Figure 25: Asia Pacific Ship Leasing Market Revenue Share (%), by Country 2025 & 2033
- Figure 26: Latin America Ship Leasing Market Revenue (billion), by Lease Type 2025 & 2033
- Figure 27: Latin America Ship Leasing Market Revenue Share (%), by Lease Type 2025 & 2033
- Figure 28: Latin America Ship Leasing Market Revenue (billion), by Application 2025 & 2033
- Figure 29: Latin America Ship Leasing Market Revenue Share (%), by Application 2025 & 2033
- Figure 30: Latin America Ship Leasing Market Revenue (billion), by Type 2025 & 2033
- Figure 31: Latin America Ship Leasing Market Revenue Share (%), by Type 2025 & 2033
- Figure 32: Latin America Ship Leasing Market Revenue (billion), by Country 2025 & 2033
- Figure 33: Latin America Ship Leasing Market Revenue Share (%), by Country 2025 & 2033
- Figure 34: Middle East and Africa Ship Leasing Market Revenue (billion), by Lease Type 2025 & 2033
- Figure 35: Middle East and Africa Ship Leasing Market Revenue Share (%), by Lease Type 2025 & 2033
- Figure 36: Middle East and Africa Ship Leasing Market Revenue (billion), by Application 2025 & 2033
- Figure 37: Middle East and Africa Ship Leasing Market Revenue Share (%), by Application 2025 & 2033
- Figure 38: Middle East and Africa Ship Leasing Market Revenue (billion), by Type 2025 & 2033
- Figure 39: Middle East and Africa Ship Leasing Market Revenue Share (%), by Type 2025 & 2033
- Figure 40: Middle East and Africa Ship Leasing Market Revenue (billion), by Country 2025 & 2033
- Figure 41: Middle East and Africa Ship Leasing Market Revenue Share (%), by Country 2025 & 2033
List of Tables
- Table 1: Global Ship Leasing Market Revenue billion Forecast, by Lease Type 2020 & 2033
- Table 2: Global Ship Leasing Market Revenue billion Forecast, by Application 2020 & 2033
- Table 3: Global Ship Leasing Market Revenue billion Forecast, by Type 2020 & 2033
- Table 4: Global Ship Leasing Market Revenue billion Forecast, by Region 2020 & 2033
- Table 5: Global Ship Leasing Market Revenue billion Forecast, by Lease Type 2020 & 2033
- Table 6: Global Ship Leasing Market Revenue billion Forecast, by Application 2020 & 2033
- Table 7: Global Ship Leasing Market Revenue billion Forecast, by Type 2020 & 2033
- Table 8: Global Ship Leasing Market Revenue billion Forecast, by Country 2020 & 2033
- Table 9: United States Ship Leasing Market Revenue (billion) Forecast, by Application 2020 & 2033
- Table 10: Canada Ship Leasing Market Revenue (billion) Forecast, by Application 2020 & 2033
- Table 11: Global Ship Leasing Market Revenue billion Forecast, by Lease Type 2020 & 2033
- Table 12: Global Ship Leasing Market Revenue billion Forecast, by Application 2020 & 2033
- Table 13: Global Ship Leasing Market Revenue billion Forecast, by Type 2020 & 2033
- Table 14: Global Ship Leasing Market Revenue billion Forecast, by Country 2020 & 2033
- Table 15: United Kingdom Ship Leasing Market Revenue (billion) Forecast, by Application 2020 & 2033
- Table 16: France Ship Leasing Market Revenue (billion) Forecast, by Application 2020 & 2033
- Table 17: Germany Ship Leasing Market Revenue (billion) Forecast, by Application 2020 & 2033
- Table 18: Rest of Europe Ship Leasing Market Revenue (billion) Forecast, by Application 2020 & 2033
- Table 19: Global Ship Leasing Market Revenue billion Forecast, by Lease Type 2020 & 2033
- Table 20: Global Ship Leasing Market Revenue billion Forecast, by Application 2020 & 2033
- Table 21: Global Ship Leasing Market Revenue billion Forecast, by Type 2020 & 2033
- Table 22: Global Ship Leasing Market Revenue billion Forecast, by Country 2020 & 2033
- Table 23: China Ship Leasing Market Revenue (billion) Forecast, by Application 2020 & 2033
- Table 24: India Ship Leasing Market Revenue (billion) Forecast, by Application 2020 & 2033
- Table 25: Japan Ship Leasing Market Revenue (billion) Forecast, by Application 2020 & 2033
- Table 26: South Korea Ship Leasing Market Revenue (billion) Forecast, by Application 2020 & 2033
- Table 27: Rest of Asia Pacific Ship Leasing Market Revenue (billion) Forecast, by Application 2020 & 2033
- Table 28: Global Ship Leasing Market Revenue billion Forecast, by Lease Type 2020 & 2033
- Table 29: Global Ship Leasing Market Revenue billion Forecast, by Application 2020 & 2033
- Table 30: Global Ship Leasing Market Revenue billion Forecast, by Type 2020 & 2033
- Table 31: Global Ship Leasing Market Revenue billion Forecast, by Country 2020 & 2033
- Table 32: Brazil Ship Leasing Market Revenue (billion) Forecast, by Application 2020 & 2033
- Table 33: Rest of Latin America Ship Leasing Market Revenue (billion) Forecast, by Application 2020 & 2033
- Table 34: Global Ship Leasing Market Revenue billion Forecast, by Lease Type 2020 & 2033
- Table 35: Global Ship Leasing Market Revenue billion Forecast, by Application 2020 & 2033
- Table 36: Global Ship Leasing Market Revenue billion Forecast, by Type 2020 & 2033
- Table 37: Global Ship Leasing Market Revenue billion Forecast, by Country 2020 & 2033
- Table 38: United Arab Emirates Ship Leasing Market Revenue (billion) Forecast, by Application 2020 & 2033
- Table 39: Saudi Arabia Ship Leasing Market Revenue (billion) Forecast, by Application 2020 & 2033
- Table 40: South Africa Ship Leasing Market Revenue (billion) Forecast, by Application 2020 & 2033
- Table 41: Rest of Middle East and Africa Ship Leasing Market Revenue (billion) Forecast, by Application 2020 & 2033
Frequently Asked Questions
1. What is the projected Compound Annual Growth Rate (CAGR) of the Ship Leasing Market?
The projected CAGR is approximately 12%.
2. Which companies are prominent players in the Ship Leasing Market?
Key companies in the market include ICBC Co Ltd, CMB Financial Leasing CO LTD, Hamburg Commercial Bank AG, Minsheng Financial Leasing Co Ltd, First Ship Lease Trust, MUFG Bank Ltd, Bothra Group, Bank of Communications Financial Leasing Co Ltd, Galbraiths Ltd, A P Møller - Mærsk A/S, Global Ship Lease Inc.
3. What are the main segments of the Ship Leasing Market?
The market segments include Lease Type, Application, Type.
4. Can you provide details about the market size?
The market size is estimated to be USD 15.78 billion as of 2022.
5. What are some drivers contributing to market growth?
N/A
6. What are the notable trends driving market growth?
Bareboat Charter Segment is Expected to Witness Significant Growth During the Forecast Period.
7. Are there any restraints impacting market growth?
N/A
8. Can you provide examples of recent developments in the market?
N/A
9. What pricing options are available for accessing the report?
Pricing options include single-user, multi-user, and enterprise licenses priced at USD 4750, USD 5250, and USD 8750 respectively.
10. Is the market size provided in terms of value or volume?
The market size is provided in terms of value, measured in billion.
11. Are there any specific market keywords associated with the report?
Yes, the market keyword associated with the report is "Ship Leasing Market," which aids in identifying and referencing the specific market segment covered.
12. How do I determine which pricing option suits my needs best?
The pricing options vary based on user requirements and access needs. Individual users may opt for single-user licenses, while businesses requiring broader access may choose multi-user or enterprise licenses for cost-effective access to the report.
13. Are there any additional resources or data provided in the Ship Leasing Market report?
While the report offers comprehensive insights, it's advisable to review the specific contents or supplementary materials provided to ascertain if additional resources or data are available.
14. How can I stay updated on further developments or reports in the Ship Leasing Market?
To stay informed about further developments, trends, and reports in the Ship Leasing Market, consider subscribing to industry newsletters, following relevant companies and organizations, or regularly checking reputable industry news sources and publications.
Methodology
Step 1 - Identification of Relevant Samples Size from Population Database


Step 2 - Approaches for Defining Global Market Size (Value, Volume* & Price*)

Note*: In applicable scenarios
Step 3 - Data Sources
Primary Research
- Web Analytics
- Survey Reports
- Research Institute
- Latest Research Reports
- Opinion Leaders
Secondary Research
- Annual Reports
- White Paper
- Latest Press Release
- Industry Association
- Paid Database
- Investor Presentations

Step 4 - Data Triangulation
Involves using different sources of information in order to increase the validity of a study
These sources are likely to be stakeholders in a program - participants, other researchers, program staff, other community members, and so on.
Then we put all data in single framework & apply various statistical tools to find out the dynamic on the market.
During the analysis stage, feedback from the stakeholder groups would be compared to determine areas of agreement as well as areas of divergence