
Key Insights
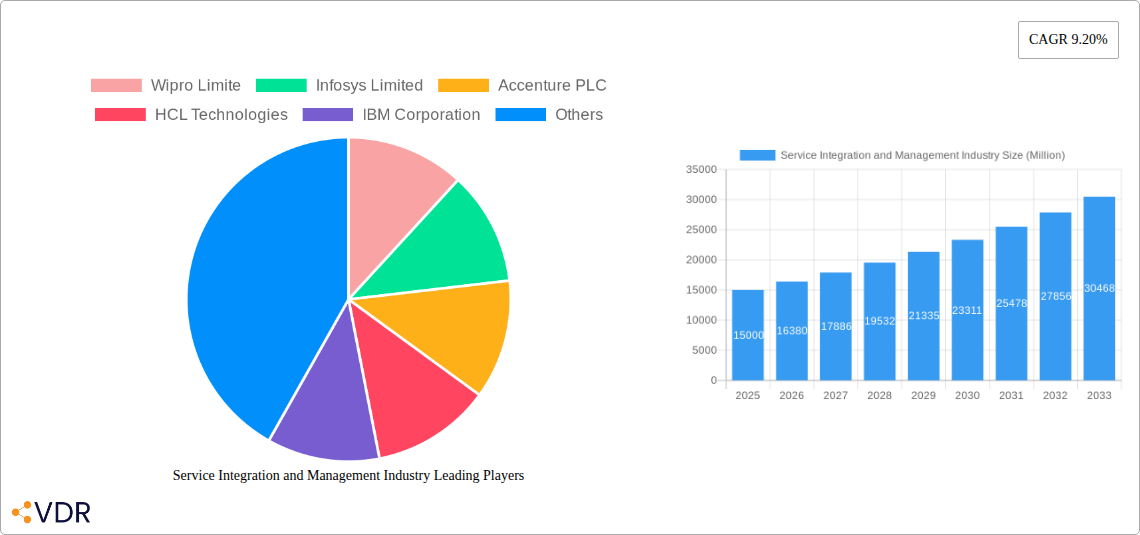
The Service Integration and Management (SIAM) market is experiencing robust growth, fueled by the increasing complexity of IT environments and the rising demand for streamlined IT service delivery. With a Compound Annual Growth Rate (CAGR) of 9.20% from 2019 to 2024, the market is projected to continue this trajectory, driven by several key factors. The shift towards hybrid and multi-cloud environments necessitates efficient management and integration of services across disparate platforms, creating a significant demand for SIAM solutions. Furthermore, the growing adoption of digital transformation initiatives across various industries, including BFSI, IT and Telecom, and Healthcare, is accelerating the need for comprehensive service integration and management capabilities. Large enterprises are leading the adoption, owing to their complex IT landscapes and the need for optimized service delivery. However, Small and Medium Enterprises (SMEs) are also increasingly recognizing the value proposition of SIAM, leading to market expansion across all organizational sizes. The increasing focus on automation and AI-driven solutions within SIAM is also contributing to market growth, enabling improved efficiency and cost optimization. Geographic expansion is another significant driver, with North America and Europe currently holding substantial market share, followed by the rapidly growing Asia-Pacific region. While the market faces challenges such as the need for skilled professionals and the integration complexity associated with legacy systems, the overall growth prospects for the SIAM market remain positive through 2033.
The competitive landscape is highly fragmented, with a mix of established players like Wipro, Infosys, Accenture, and IBM alongside specialized SIAM providers. The presence of these diverse players fosters innovation and competitive pricing, benefiting end-users. However, maintaining a competitive edge requires continuous innovation in service delivery models and technological advancements. The market is witnessing the emergence of cloud-based SIAM solutions, providing scalability and flexibility. Furthermore, the integration of advanced analytics and monitoring tools is becoming crucial for optimizing performance and proactively addressing potential issues. Future growth will be influenced by factors such as the maturation of cloud-native technologies, increased adoption of DevOps practices, and the growing adoption of AI and machine learning within SIAM platforms. The market's ongoing expansion will be dependent on continued innovation, addressing integration challenges, and nurturing the talent pool to support the growing demand for skilled professionals in the field.
Service Integration and Management (SIAM) Industry Market Report: 2019-2033
This comprehensive report provides an in-depth analysis of the Service Integration and Management (SIAM) industry, encompassing market dynamics, growth trends, key players, and future outlook. The report covers the period 2019-2033, with a focus on the estimated year 2025. It segments the market by component (Solutions, Services), organization size (SMEs, Large Enterprises), and end-user industry (BFSI, IT & Telecom, Healthcare, Retail, Others), offering granular insights for informed decision-making. The total market size is projected to reach xx Million by 2033.
Service Integration and Management Industry Market Dynamics & Structure
The SIAM market is characterized by a moderately concentrated structure, with key players like Accenture PLC, IBM Corporation, and Infosys Limited holding significant market share. Technological innovation, particularly in areas like AI and automation, is a key driver, while regulatory compliance and data security remain significant challenges. The market is witnessing increased M&A activity as larger players consolidate their position.
- Market Concentration: Top 5 players hold approximately xx% of the market share in 2025.
- Technological Innovation: AI-powered ITSM tools and automation are driving efficiency gains and market expansion.
- Regulatory Framework: Compliance with GDPR, HIPAA, and other regulations impacts market growth and adoption.
- Competitive Landscape: Intense competition exists among established players and emerging niche providers.
- M&A Trends: Over xx M&A deals were recorded between 2019 and 2024, with an average deal size of xx Million.
- Innovation Barriers: High initial investment costs, integration complexities, and skills gap hinder widespread innovation.
Service Integration and Management Industry Growth Trends & Insights
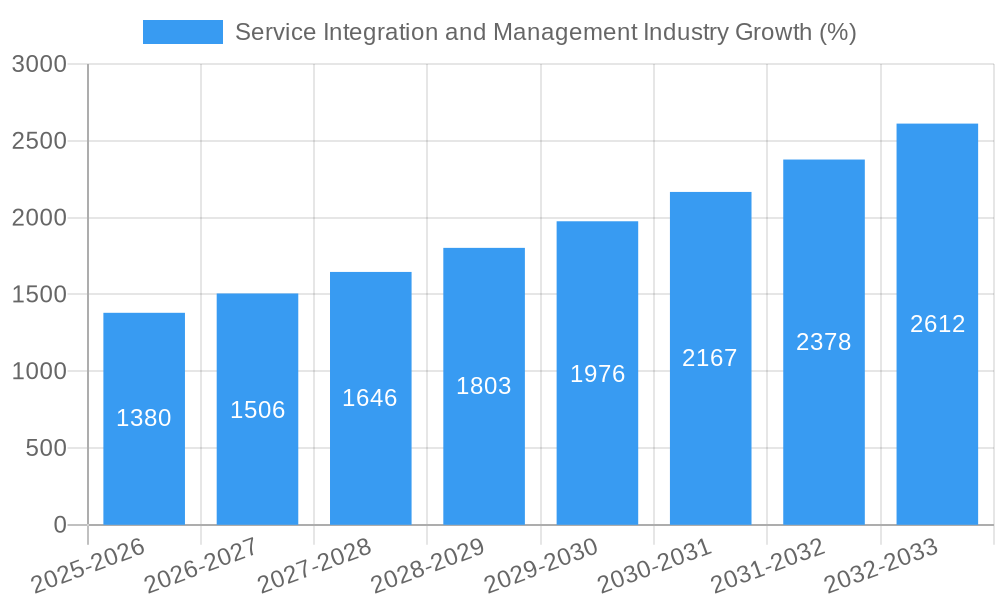
The SIAM market experienced substantial growth during the historical period (2019-2024), driven by increasing demand for improved IT service delivery and reduced operational costs across various industries. The market is expected to continue its expansion throughout the forecast period (2025-2033), with a projected CAGR of xx%. This growth is fueled by the rising adoption of cloud services, digital transformation initiatives, and the growing need for efficient IT service management. Increased outsourcing of IT functions and the shift toward hybrid IT environments are also contributing to market expansion. Market penetration for SIAM solutions is expected to reach xx% by 2033.
Dominant Regions, Countries, or Segments in Service Integration and Management Industry
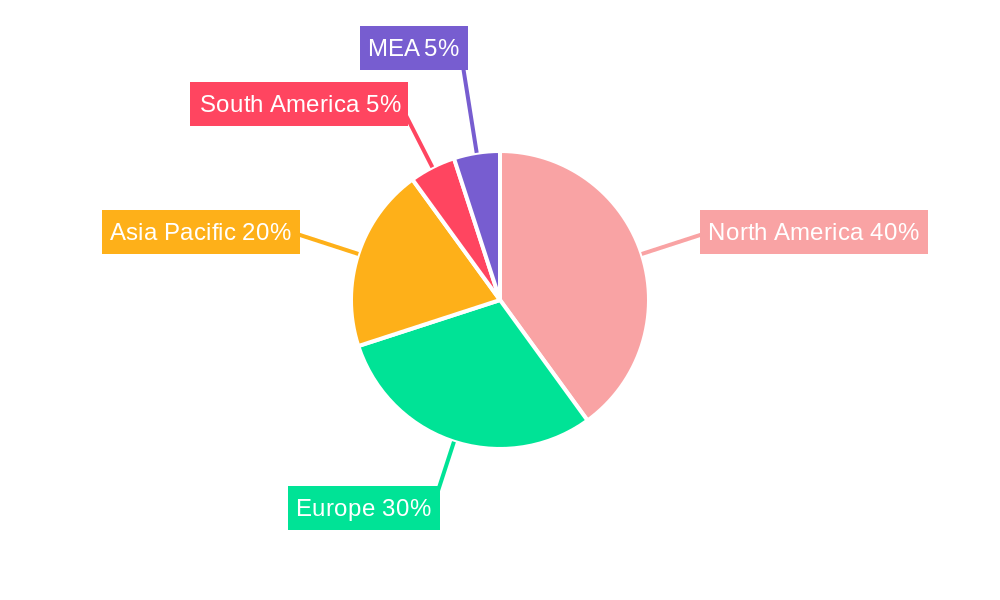
North America currently dominates the SIAM market, driven by high IT spending, early adoption of advanced technologies, and the presence of major players. However, the Asia-Pacific region is exhibiting the fastest growth rate, fueled by rapid digitalization and increasing IT investments across various sectors. Within segments, Large Enterprises segment represents the largest market share, due to their higher IT budgets and complex IT infrastructure. The BFSI and IT & Telecom sectors are major end-users.
- Leading Region: North America (xx Million in 2025)
- Fastest-Growing Region: Asia-Pacific (xx% CAGR)
- Largest Segment (by organization size): Large Enterprises (xx% market share)
- Largest Segment (by end-user industry): BFSI (xx% market share)
- Key Drivers: Government IT modernization initiatives, increasing cloud adoption, and strong digital transformation strategies.
Service Integration and Management Industry Product Landscape
The SIAM product landscape is evolving rapidly, with vendors offering a range of solutions, including integrated platforms, specialized tools, and managed services. These solutions emphasize automation, AI-powered analytics, and seamless integration with existing IT infrastructure. Unique selling propositions often center on improved service visibility, enhanced efficiency, and reduced operational costs. Technological advancements include AI-driven incident management, predictive analytics for capacity planning, and automated service level management.
Key Drivers, Barriers & Challenges in Service Integration and Management Industry
Key Drivers: The growing complexity of IT landscapes, the increasing demand for cost optimization, and the need for improved IT service delivery are primary drivers of SIAM adoption. The rising adoption of cloud-based services and digital transformation initiatives further fuel market growth.
Key Challenges: Integration complexities, resistance to change within organizations, skills shortage, and data security concerns pose significant challenges. The competitive landscape and cost pressures can also limit market expansion. Supply chain disruptions may impact the availability of critical components and services, potentially affecting project timelines and costs. Estimated impact of supply chain issues on market growth: xx%.
Emerging Opportunities in Service Integration and Management Industry
The expansion into untapped markets, such as the public sector and smaller enterprises, presents significant opportunities. Innovative applications, like AI-powered service desk automation and predictive maintenance, are also creating new growth avenues. The increasing demand for integrated security solutions and cybersecurity services within SIAM offerings represents a notable opportunity. Evolving consumer preferences towards personalized and proactive service delivery also create opportunities.
Growth Accelerators in the Service Integration and Management Industry
Strategic partnerships between SIAM providers and technology vendors are accelerating market growth. Technological breakthroughs, particularly in AI and automation, are enhancing the capabilities of SIAM solutions. The expansion into new geographic markets and the development of specialized solutions for specific industry verticals are key growth catalysts.
Key Players Shaping the Service Integration and Management Industry Market
- Wipro Limited
- Infosys Limited
- Accenture PLC
- HCL Technologies
- IBM Corporation
- Capgemini SE
- Hewlett Packard Enterprise (HPE)
- Fujitsu Limited
- Mindtree Limited
- Atos SE
Notable Milestones in Service Integration and Management Industry Sector
- August 2021: Perspecta Enterprise Solutions LLC awarded a USD 2 billion contract for Military Health System Enterprise Information Technology Services Integrator (EITSI).
- March 2020: Infosys and IBM partnered to accelerate digital transformation using IBM cloud services, focusing on regulated industries.
In-Depth Service Integration and Management Industry Market Outlook
The SIAM market is poised for sustained growth, driven by ongoing digital transformation, increasing IT complexity, and the need for efficient service management. Strategic partnerships, technological advancements, and expansion into new markets will further propel market expansion. The focus on AI, automation, and security will shape the future of SIAM solutions, creating significant opportunities for both established players and new entrants.
Service Integration and Management Industry Segmentation
-
1. Component
-
1.1. Solutions
- 1.1.1. Business Solutions
- 1.1.2. Technology Solutions
- 1.2. Services
-
1.1. Solutions
-
2. Organization Size
- 2.1. Small and Medium Enterprises
- 2.2. Large Enterprises
-
3. End user Industry
- 3.1. BFSI
- 3.2. IT and Telecom
- 3.3. Healthcare
- 3.4. Retail
- 3.5. Other End-user Industries
Service Integration and Management Industry Segmentation By Geography
- 1. North America
- 2. Europe
- 3. Asia Pacific
- 4. Rest of the World
Service Integration and Management Industry REPORT HIGHLIGHTS
| Aspects | Details |
|---|---|
| Study Period | 2019-2033 |
| Base Year | 2024 |
| Estimated Year | 2025 |
| Forecast Period | 2025-2033 |
| Historical Period | 2019-2024 |
| Growth Rate | CAGR of 9.20% from 2019-2033 |
| Segmentation |
|
Table of Contents
- 1. Introduction
- 1.1. Research Scope
- 1.2. Market Segmentation
- 1.3. Research Methodology
- 1.4. Definitions and Assumptions
- 2. Executive Summary
- 2.1. Introduction
- 3. Market Dynamics
- 3.1. Introduction
- 3.2. Market Drivers
- 3.2.1. Increasing Complexities of Service Management; Increasing Demand for Multi-Vendor Outsourcing
- 3.3. Market Restrains
- 3.3.1. Lack of Uniform SLAs and Regulatory Compliances
- 3.4. Market Trends
- 3.4.1. Cloud Technology to witness significant growth
- 4. Market Factor Analysis
- 4.1. Porters Five Forces
- 4.2. Supply/Value Chain
- 4.3. PESTEL analysis
- 4.4. Market Entropy
- 4.5. Patent/Trademark Analysis
- 5. Global Service Integration and Management Industry Analysis, Insights and Forecast, 2019-2031
- 5.1. Market Analysis, Insights and Forecast - by Component
- 5.1.1. Solutions
- 5.1.1.1. Business Solutions
- 5.1.1.2. Technology Solutions
- 5.1.2. Services
- 5.1.1. Solutions
- 5.2. Market Analysis, Insights and Forecast - by Organization Size
- 5.2.1. Small and Medium Enterprises
- 5.2.2. Large Enterprises
- 5.3. Market Analysis, Insights and Forecast - by End user Industry
- 5.3.1. BFSI
- 5.3.2. IT and Telecom
- 5.3.3. Healthcare
- 5.3.4. Retail
- 5.3.5. Other End-user Industries
- 5.4. Market Analysis, Insights and Forecast - by Region
- 5.4.1. North America
- 5.4.2. Europe
- 5.4.3. Asia Pacific
- 5.4.4. Rest of the World
- 5.1. Market Analysis, Insights and Forecast - by Component
- 6. North America Service Integration and Management Industry Analysis, Insights and Forecast, 2019-2031
- 6.1. Market Analysis, Insights and Forecast - by Component
- 6.1.1. Solutions
- 6.1.1.1. Business Solutions
- 6.1.1.2. Technology Solutions
- 6.1.2. Services
- 6.1.1. Solutions
- 6.2. Market Analysis, Insights and Forecast - by Organization Size
- 6.2.1. Small and Medium Enterprises
- 6.2.2. Large Enterprises
- 6.3. Market Analysis, Insights and Forecast - by End user Industry
- 6.3.1. BFSI
- 6.3.2. IT and Telecom
- 6.3.3. Healthcare
- 6.3.4. Retail
- 6.3.5. Other End-user Industries
- 6.1. Market Analysis, Insights and Forecast - by Component
- 7. Europe Service Integration and Management Industry Analysis, Insights and Forecast, 2019-2031
- 7.1. Market Analysis, Insights and Forecast - by Component
- 7.1.1. Solutions
- 7.1.1.1. Business Solutions
- 7.1.1.2. Technology Solutions
- 7.1.2. Services
- 7.1.1. Solutions
- 7.2. Market Analysis, Insights and Forecast - by Organization Size
- 7.2.1. Small and Medium Enterprises
- 7.2.2. Large Enterprises
- 7.3. Market Analysis, Insights and Forecast - by End user Industry
- 7.3.1. BFSI
- 7.3.2. IT and Telecom
- 7.3.3. Healthcare
- 7.3.4. Retail
- 7.3.5. Other End-user Industries
- 7.1. Market Analysis, Insights and Forecast - by Component
- 8. Asia Pacific Service Integration and Management Industry Analysis, Insights and Forecast, 2019-2031
- 8.1. Market Analysis, Insights and Forecast - by Component
- 8.1.1. Solutions
- 8.1.1.1. Business Solutions
- 8.1.1.2. Technology Solutions
- 8.1.2. Services
- 8.1.1. Solutions
- 8.2. Market Analysis, Insights and Forecast - by Organization Size
- 8.2.1. Small and Medium Enterprises
- 8.2.2. Large Enterprises
- 8.3. Market Analysis, Insights and Forecast - by End user Industry
- 8.3.1. BFSI
- 8.3.2. IT and Telecom
- 8.3.3. Healthcare
- 8.3.4. Retail
- 8.3.5. Other End-user Industries
- 8.1. Market Analysis, Insights and Forecast - by Component
- 9. Rest of the World Service Integration and Management Industry Analysis, Insights and Forecast, 2019-2031
- 9.1. Market Analysis, Insights and Forecast - by Component
- 9.1.1. Solutions
- 9.1.1.1. Business Solutions
- 9.1.1.2. Technology Solutions
- 9.1.2. Services
- 9.1.1. Solutions
- 9.2. Market Analysis, Insights and Forecast - by Organization Size
- 9.2.1. Small and Medium Enterprises
- 9.2.2. Large Enterprises
- 9.3. Market Analysis, Insights and Forecast - by End user Industry
- 9.3.1. BFSI
- 9.3.2. IT and Telecom
- 9.3.3. Healthcare
- 9.3.4. Retail
- 9.3.5. Other End-user Industries
- 9.1. Market Analysis, Insights and Forecast - by Component
- 10. North America Service Integration and Management Industry Analysis, Insights and Forecast, 2019-2031
- 10.1. Market Analysis, Insights and Forecast - By Country/Sub-region
- 10.1.1 United States
- 10.1.2 Canada
- 10.1.3 Mexico
- 11. Europe Service Integration and Management Industry Analysis, Insights and Forecast, 2019-2031
- 11.1. Market Analysis, Insights and Forecast - By Country/Sub-region
- 11.1.1 Germany
- 11.1.2 United Kingdom
- 11.1.3 France
- 11.1.4 Spain
- 11.1.5 Italy
- 11.1.6 Spain
- 11.1.7 Belgium
- 11.1.8 Netherland
- 11.1.9 Nordics
- 11.1.10 Rest of Europe
- 12. Asia Pacific Service Integration and Management Industry Analysis, Insights and Forecast, 2019-2031
- 12.1. Market Analysis, Insights and Forecast - By Country/Sub-region
- 12.1.1 China
- 12.1.2 Japan
- 12.1.3 India
- 12.1.4 South Korea
- 12.1.5 Southeast Asia
- 12.1.6 Australia
- 12.1.7 Indonesia
- 12.1.8 Phillipes
- 12.1.9 Singapore
- 12.1.10 Thailandc
- 12.1.11 Rest of Asia Pacific
- 13. South America Service Integration and Management Industry Analysis, Insights and Forecast, 2019-2031
- 13.1. Market Analysis, Insights and Forecast - By Country/Sub-region
- 13.1.1 Brazil
- 13.1.2 Argentina
- 13.1.3 Peru
- 13.1.4 Chile
- 13.1.5 Colombia
- 13.1.6 Ecuador
- 13.1.7 Venezuela
- 13.1.8 Rest of South America
- 14. North America Service Integration and Management Industry Analysis, Insights and Forecast, 2019-2031
- 14.1. Market Analysis, Insights and Forecast - By Country/Sub-region
- 14.1.1 United States
- 14.1.2 Canada
- 14.1.3 Mexico
- 15. MEA Service Integration and Management Industry Analysis, Insights and Forecast, 2019-2031
- 15.1. Market Analysis, Insights and Forecast - By Country/Sub-region
- 15.1.1 United Arab Emirates
- 15.1.2 Saudi Arabia
- 15.1.3 South Africa
- 15.1.4 Rest of Middle East and Africa
- 16. Competitive Analysis
- 16.1. Global Market Share Analysis 2024
- 16.2. Company Profiles
- 16.2.1 Wipro Limite
- 16.2.1.1. Overview
- 16.2.1.2. Products
- 16.2.1.3. SWOT Analysis
- 16.2.1.4. Recent Developments
- 16.2.1.5. Financials (Based on Availability)
- 16.2.2 Infosys Limited
- 16.2.2.1. Overview
- 16.2.2.2. Products
- 16.2.2.3. SWOT Analysis
- 16.2.2.4. Recent Developments
- 16.2.2.5. Financials (Based on Availability)
- 16.2.3 Accenture PLC
- 16.2.3.1. Overview
- 16.2.3.2. Products
- 16.2.3.3. SWOT Analysis
- 16.2.3.4. Recent Developments
- 16.2.3.5. Financials (Based on Availability)
- 16.2.4 HCL Technologies
- 16.2.4.1. Overview
- 16.2.4.2. Products
- 16.2.4.3. SWOT Analysis
- 16.2.4.4. Recent Developments
- 16.2.4.5. Financials (Based on Availability)
- 16.2.5 IBM Corporation
- 16.2.5.1. Overview
- 16.2.5.2. Products
- 16.2.5.3. SWOT Analysis
- 16.2.5.4. Recent Developments
- 16.2.5.5. Financials (Based on Availability)
- 16.2.6 Capgemini SE
- 16.2.6.1. Overview
- 16.2.6.2. Products
- 16.2.6.3. SWOT Analysis
- 16.2.6.4. Recent Developments
- 16.2.6.5. Financials (Based on Availability)
- 16.2.7 Hewlett Packard Enterprise (HPE)
- 16.2.7.1. Overview
- 16.2.7.2. Products
- 16.2.7.3. SWOT Analysis
- 16.2.7.4. Recent Developments
- 16.2.7.5. Financials (Based on Availability)
- 16.2.8 Fujitsu Limited
- 16.2.8.1. Overview
- 16.2.8.2. Products
- 16.2.8.3. SWOT Analysis
- 16.2.8.4. Recent Developments
- 16.2.8.5. Financials (Based on Availability)
- 16.2.9 Mindtree Limited
- 16.2.9.1. Overview
- 16.2.9.2. Products
- 16.2.9.3. SWOT Analysis
- 16.2.9.4. Recent Developments
- 16.2.9.5. Financials (Based on Availability)
- 16.2.10 AtoS SE
- 16.2.10.1. Overview
- 16.2.10.2. Products
- 16.2.10.3. SWOT Analysis
- 16.2.10.4. Recent Developments
- 16.2.10.5. Financials (Based on Availability)
- 16.2.1 Wipro Limite
List of Figures
- Figure 1: Global Service Integration and Management Industry Revenue Breakdown (Million, %) by Region 2024 & 2032
- Figure 2: North America Service Integration and Management Industry Revenue (Million), by Country 2024 & 2032
- Figure 3: North America Service Integration and Management Industry Revenue Share (%), by Country 2024 & 2032
- Figure 4: Europe Service Integration and Management Industry Revenue (Million), by Country 2024 & 2032
- Figure 5: Europe Service Integration and Management Industry Revenue Share (%), by Country 2024 & 2032
- Figure 6: Asia Pacific Service Integration and Management Industry Revenue (Million), by Country 2024 & 2032
- Figure 7: Asia Pacific Service Integration and Management Industry Revenue Share (%), by Country 2024 & 2032
- Figure 8: South America Service Integration and Management Industry Revenue (Million), by Country 2024 & 2032
- Figure 9: South America Service Integration and Management Industry Revenue Share (%), by Country 2024 & 2032
- Figure 10: North America Service Integration and Management Industry Revenue (Million), by Country 2024 & 2032
- Figure 11: North America Service Integration and Management Industry Revenue Share (%), by Country 2024 & 2032
- Figure 12: MEA Service Integration and Management Industry Revenue (Million), by Country 2024 & 2032
- Figure 13: MEA Service Integration and Management Industry Revenue Share (%), by Country 2024 & 2032
- Figure 14: North America Service Integration and Management Industry Revenue (Million), by Component 2024 & 2032
- Figure 15: North America Service Integration and Management Industry Revenue Share (%), by Component 2024 & 2032
- Figure 16: North America Service Integration and Management Industry Revenue (Million), by Organization Size 2024 & 2032
- Figure 17: North America Service Integration and Management Industry Revenue Share (%), by Organization Size 2024 & 2032
- Figure 18: North America Service Integration and Management Industry Revenue (Million), by End user Industry 2024 & 2032
- Figure 19: North America Service Integration and Management Industry Revenue Share (%), by End user Industry 2024 & 2032
- Figure 20: North America Service Integration and Management Industry Revenue (Million), by Country 2024 & 2032
- Figure 21: North America Service Integration and Management Industry Revenue Share (%), by Country 2024 & 2032
- Figure 22: Europe Service Integration and Management Industry Revenue (Million), by Component 2024 & 2032
- Figure 23: Europe Service Integration and Management Industry Revenue Share (%), by Component 2024 & 2032
- Figure 24: Europe Service Integration and Management Industry Revenue (Million), by Organization Size 2024 & 2032
- Figure 25: Europe Service Integration and Management Industry Revenue Share (%), by Organization Size 2024 & 2032
- Figure 26: Europe Service Integration and Management Industry Revenue (Million), by End user Industry 2024 & 2032
- Figure 27: Europe Service Integration and Management Industry Revenue Share (%), by End user Industry 2024 & 2032
- Figure 28: Europe Service Integration and Management Industry Revenue (Million), by Country 2024 & 2032
- Figure 29: Europe Service Integration and Management Industry Revenue Share (%), by Country 2024 & 2032
- Figure 30: Asia Pacific Service Integration and Management Industry Revenue (Million), by Component 2024 & 2032
- Figure 31: Asia Pacific Service Integration and Management Industry Revenue Share (%), by Component 2024 & 2032
- Figure 32: Asia Pacific Service Integration and Management Industry Revenue (Million), by Organization Size 2024 & 2032
- Figure 33: Asia Pacific Service Integration and Management Industry Revenue Share (%), by Organization Size 2024 & 2032
- Figure 34: Asia Pacific Service Integration and Management Industry Revenue (Million), by End user Industry 2024 & 2032
- Figure 35: Asia Pacific Service Integration and Management Industry Revenue Share (%), by End user Industry 2024 & 2032
- Figure 36: Asia Pacific Service Integration and Management Industry Revenue (Million), by Country 2024 & 2032
- Figure 37: Asia Pacific Service Integration and Management Industry Revenue Share (%), by Country 2024 & 2032
- Figure 38: Rest of the World Service Integration and Management Industry Revenue (Million), by Component 2024 & 2032
- Figure 39: Rest of the World Service Integration and Management Industry Revenue Share (%), by Component 2024 & 2032
- Figure 40: Rest of the World Service Integration and Management Industry Revenue (Million), by Organization Size 2024 & 2032
- Figure 41: Rest of the World Service Integration and Management Industry Revenue Share (%), by Organization Size 2024 & 2032
- Figure 42: Rest of the World Service Integration and Management Industry Revenue (Million), by End user Industry 2024 & 2032
- Figure 43: Rest of the World Service Integration and Management Industry Revenue Share (%), by End user Industry 2024 & 2032
- Figure 44: Rest of the World Service Integration and Management Industry Revenue (Million), by Country 2024 & 2032
- Figure 45: Rest of the World Service Integration and Management Industry Revenue Share (%), by Country 2024 & 2032
List of Tables
- Table 1: Global Service Integration and Management Industry Revenue Million Forecast, by Region 2019 & 2032
- Table 2: Global Service Integration and Management Industry Revenue Million Forecast, by Component 2019 & 2032
- Table 3: Global Service Integration and Management Industry Revenue Million Forecast, by Organization Size 2019 & 2032
- Table 4: Global Service Integration and Management Industry Revenue Million Forecast, by End user Industry 2019 & 2032
- Table 5: Global Service Integration and Management Industry Revenue Million Forecast, by Region 2019 & 2032
- Table 6: Global Service Integration and Management Industry Revenue Million Forecast, by Country 2019 & 2032
- Table 7: United States Service Integration and Management Industry Revenue (Million) Forecast, by Application 2019 & 2032
- Table 8: Canada Service Integration and Management Industry Revenue (Million) Forecast, by Application 2019 & 2032
- Table 9: Mexico Service Integration and Management Industry Revenue (Million) Forecast, by Application 2019 & 2032
- Table 10: Global Service Integration and Management Industry Revenue Million Forecast, by Country 2019 & 2032
- Table 11: Germany Service Integration and Management Industry Revenue (Million) Forecast, by Application 2019 & 2032
- Table 12: United Kingdom Service Integration and Management Industry Revenue (Million) Forecast, by Application 2019 & 2032
- Table 13: France Service Integration and Management Industry Revenue (Million) Forecast, by Application 2019 & 2032
- Table 14: Spain Service Integration and Management Industry Revenue (Million) Forecast, by Application 2019 & 2032
- Table 15: Italy Service Integration and Management Industry Revenue (Million) Forecast, by Application 2019 & 2032
- Table 16: Spain Service Integration and Management Industry Revenue (Million) Forecast, by Application 2019 & 2032
- Table 17: Belgium Service Integration and Management Industry Revenue (Million) Forecast, by Application 2019 & 2032
- Table 18: Netherland Service Integration and Management Industry Revenue (Million) Forecast, by Application 2019 & 2032
- Table 19: Nordics Service Integration and Management Industry Revenue (Million) Forecast, by Application 2019 & 2032
- Table 20: Rest of Europe Service Integration and Management Industry Revenue (Million) Forecast, by Application 2019 & 2032
- Table 21: Global Service Integration and Management Industry Revenue Million Forecast, by Country 2019 & 2032
- Table 22: China Service Integration and Management Industry Revenue (Million) Forecast, by Application 2019 & 2032
- Table 23: Japan Service Integration and Management Industry Revenue (Million) Forecast, by Application 2019 & 2032
- Table 24: India Service Integration and Management Industry Revenue (Million) Forecast, by Application 2019 & 2032
- Table 25: South Korea Service Integration and Management Industry Revenue (Million) Forecast, by Application 2019 & 2032
- Table 26: Southeast Asia Service Integration and Management Industry Revenue (Million) Forecast, by Application 2019 & 2032
- Table 27: Australia Service Integration and Management Industry Revenue (Million) Forecast, by Application 2019 & 2032
- Table 28: Indonesia Service Integration and Management Industry Revenue (Million) Forecast, by Application 2019 & 2032
- Table 29: Phillipes Service Integration and Management Industry Revenue (Million) Forecast, by Application 2019 & 2032
- Table 30: Singapore Service Integration and Management Industry Revenue (Million) Forecast, by Application 2019 & 2032
- Table 31: Thailandc Service Integration and Management Industry Revenue (Million) Forecast, by Application 2019 & 2032
- Table 32: Rest of Asia Pacific Service Integration and Management Industry Revenue (Million) Forecast, by Application 2019 & 2032
- Table 33: Global Service Integration and Management Industry Revenue Million Forecast, by Country 2019 & 2032
- Table 34: Brazil Service Integration and Management Industry Revenue (Million) Forecast, by Application 2019 & 2032
- Table 35: Argentina Service Integration and Management Industry Revenue (Million) Forecast, by Application 2019 & 2032
- Table 36: Peru Service Integration and Management Industry Revenue (Million) Forecast, by Application 2019 & 2032
- Table 37: Chile Service Integration and Management Industry Revenue (Million) Forecast, by Application 2019 & 2032
- Table 38: Colombia Service Integration and Management Industry Revenue (Million) Forecast, by Application 2019 & 2032
- Table 39: Ecuador Service Integration and Management Industry Revenue (Million) Forecast, by Application 2019 & 2032
- Table 40: Venezuela Service Integration and Management Industry Revenue (Million) Forecast, by Application 2019 & 2032
- Table 41: Rest of South America Service Integration and Management Industry Revenue (Million) Forecast, by Application 2019 & 2032
- Table 42: Global Service Integration and Management Industry Revenue Million Forecast, by Country 2019 & 2032
- Table 43: United States Service Integration and Management Industry Revenue (Million) Forecast, by Application 2019 & 2032
- Table 44: Canada Service Integration and Management Industry Revenue (Million) Forecast, by Application 2019 & 2032
- Table 45: Mexico Service Integration and Management Industry Revenue (Million) Forecast, by Application 2019 & 2032
- Table 46: Global Service Integration and Management Industry Revenue Million Forecast, by Country 2019 & 2032
- Table 47: United Arab Emirates Service Integration and Management Industry Revenue (Million) Forecast, by Application 2019 & 2032
- Table 48: Saudi Arabia Service Integration and Management Industry Revenue (Million) Forecast, by Application 2019 & 2032
- Table 49: South Africa Service Integration and Management Industry Revenue (Million) Forecast, by Application 2019 & 2032
- Table 50: Rest of Middle East and Africa Service Integration and Management Industry Revenue (Million) Forecast, by Application 2019 & 2032
- Table 51: Global Service Integration and Management Industry Revenue Million Forecast, by Component 2019 & 2032
- Table 52: Global Service Integration and Management Industry Revenue Million Forecast, by Organization Size 2019 & 2032
- Table 53: Global Service Integration and Management Industry Revenue Million Forecast, by End user Industry 2019 & 2032
- Table 54: Global Service Integration and Management Industry Revenue Million Forecast, by Country 2019 & 2032
- Table 55: Global Service Integration and Management Industry Revenue Million Forecast, by Component 2019 & 2032
- Table 56: Global Service Integration and Management Industry Revenue Million Forecast, by Organization Size 2019 & 2032
- Table 57: Global Service Integration and Management Industry Revenue Million Forecast, by End user Industry 2019 & 2032
- Table 58: Global Service Integration and Management Industry Revenue Million Forecast, by Country 2019 & 2032
- Table 59: Global Service Integration and Management Industry Revenue Million Forecast, by Component 2019 & 2032
- Table 60: Global Service Integration and Management Industry Revenue Million Forecast, by Organization Size 2019 & 2032
- Table 61: Global Service Integration and Management Industry Revenue Million Forecast, by End user Industry 2019 & 2032
- Table 62: Global Service Integration and Management Industry Revenue Million Forecast, by Country 2019 & 2032
- Table 63: Global Service Integration and Management Industry Revenue Million Forecast, by Component 2019 & 2032
- Table 64: Global Service Integration and Management Industry Revenue Million Forecast, by Organization Size 2019 & 2032
- Table 65: Global Service Integration and Management Industry Revenue Million Forecast, by End user Industry 2019 & 2032
- Table 66: Global Service Integration and Management Industry Revenue Million Forecast, by Country 2019 & 2032
Frequently Asked Questions
1. What is the projected Compound Annual Growth Rate (CAGR) of the Service Integration and Management Industry?
The projected CAGR is approximately 9.20%.
2. Which companies are prominent players in the Service Integration and Management Industry?
Key companies in the market include Wipro Limite, Infosys Limited, Accenture PLC, HCL Technologies, IBM Corporation, Capgemini SE, Hewlett Packard Enterprise (HPE), Fujitsu Limited, Mindtree Limited, AtoS SE.
3. What are the main segments of the Service Integration and Management Industry?
The market segments include Component, Organization Size, End user Industry.
4. Can you provide details about the market size?
The market size is estimated to be USD XX Million as of 2022.
5. What are some drivers contributing to market growth?
Increasing Complexities of Service Management; Increasing Demand for Multi-Vendor Outsourcing.
6. What are the notable trends driving market growth?
Cloud Technology to witness significant growth.
7. Are there any restraints impacting market growth?
Lack of Uniform SLAs and Regulatory Compliances.
8. Can you provide examples of recent developments in the market?
August 2021 - Perspecta Enterprise Solutions LLC, as contractor team arrangement (CTA) lead with Capgemini Government Solutions LLC, as a CTA member, was awarded a single award, firm-fixed-price, blanket purchase agreement (BPA) with an ordering ceiling of USD 2 billion. BPA HT001521A0002 represents the Military Health System Enterprise Information Technology Services Integrator (EITSI). The EITSI would use a multisourcing services integrator approach to coordinate, integrate, and manage the Defense Health Agency's (DHA) IT transformation to consolidate services and reduce costs.
9. What pricing options are available for accessing the report?
Pricing options include single-user, multi-user, and enterprise licenses priced at USD 4750, USD 5250, and USD 8750 respectively.
10. Is the market size provided in terms of value or volume?
The market size is provided in terms of value, measured in Million.
11. Are there any specific market keywords associated with the report?
Yes, the market keyword associated with the report is "Service Integration and Management Industry," which aids in identifying and referencing the specific market segment covered.
12. How do I determine which pricing option suits my needs best?
The pricing options vary based on user requirements and access needs. Individual users may opt for single-user licenses, while businesses requiring broader access may choose multi-user or enterprise licenses for cost-effective access to the report.
13. Are there any additional resources or data provided in the Service Integration and Management Industry report?
While the report offers comprehensive insights, it's advisable to review the specific contents or supplementary materials provided to ascertain if additional resources or data are available.
14. How can I stay updated on further developments or reports in the Service Integration and Management Industry?
To stay informed about further developments, trends, and reports in the Service Integration and Management Industry, consider subscribing to industry newsletters, following relevant companies and organizations, or regularly checking reputable industry news sources and publications.
Methodology
Step 1 - Identification of Relevant Samples Size from Population Database


Step 2 - Approaches for Defining Global Market Size (Value, Volume* & Price*)

Note*: In applicable scenarios
Step 3 - Data Sources
Primary Research
- Web Analytics
- Survey Reports
- Research Institute
- Latest Research Reports
- Opinion Leaders
Secondary Research
- Annual Reports
- White Paper
- Latest Press Release
- Industry Association
- Paid Database
- Investor Presentations

Step 4 - Data Triangulation
Involves using different sources of information in order to increase the validity of a study
These sources are likely to be stakeholders in a program - participants, other researchers, program staff, other community members, and so on.
Then we put all data in single framework & apply various statistical tools to find out the dynamic on the market.
During the analysis stage, feedback from the stakeholder groups would be compared to determine areas of agreement as well as areas of divergence


