


Key Insights
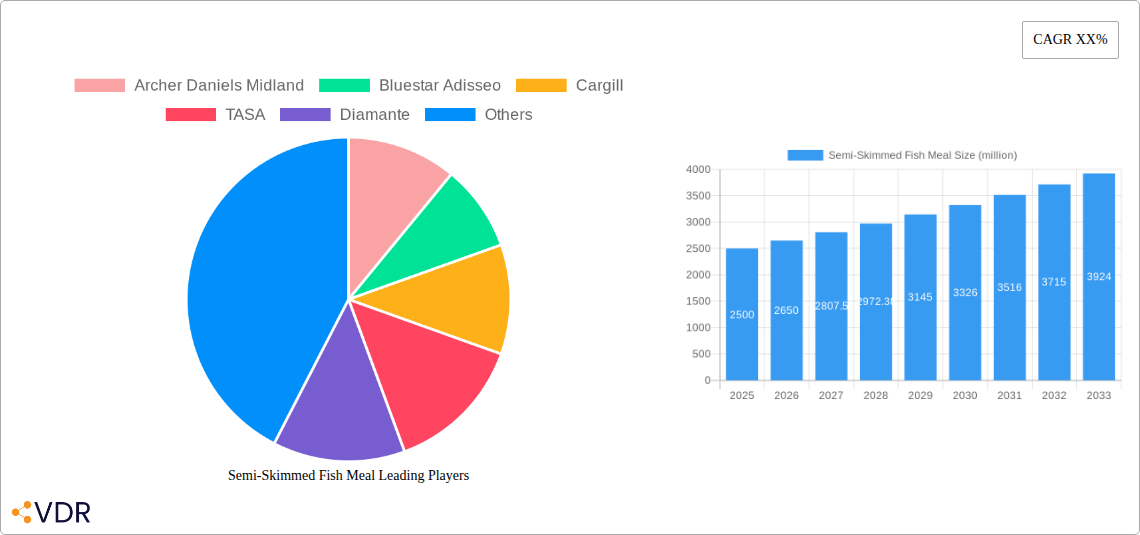
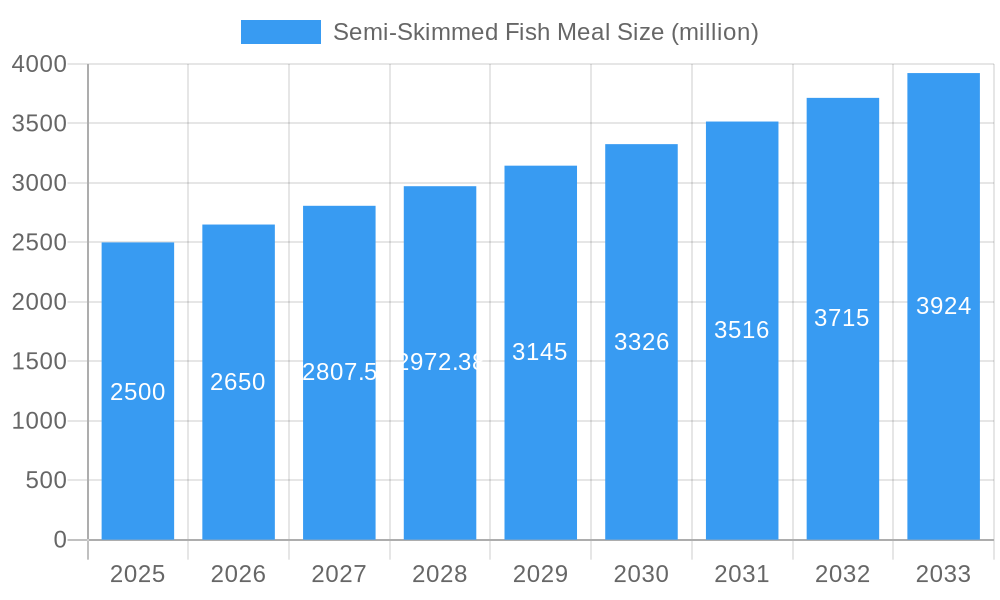
The global semi-skimmed fish meal market is poised for significant expansion, propelled by escalating demand within the aquaculture sector. This growth is underpinned by a burgeoning global population and an increasing preference for seafood as a primary protein source. Aquaculture, particularly the farming of high-value species like salmon and shrimp, critically depends on fish meal for its feed formulations. Semi-skimmed fish meal offers a nutritionally balanced and cost-effective alternative to full-fat variants, establishing it as a preferred choice for many aquaculture operations. Innovations in processing are yielding higher quality products with enhanced digestibility and a reduced environmental footprint. However, market expansion faces headwinds from volatile raw material pricing and sustainability challenges related to overfishing. Competitive pressures from established entities such as Archer Daniels Midland, Cargill, and TASA, alongside emerging regional players, are shaping market dynamics. The market is segmented by geography, aquaculture feed application, and fish meal protein/fat content. The projected market size for 2025 is 5916 million, with a forecasted Compound Annual Growth Rate (CAGR) of 3.4% through 2033. Producers must prioritize sustainable sourcing and environmentally responsible production methods to maintain a competitive advantage.
Semi-Skimmed Fish Meal Market Size (In Billion)

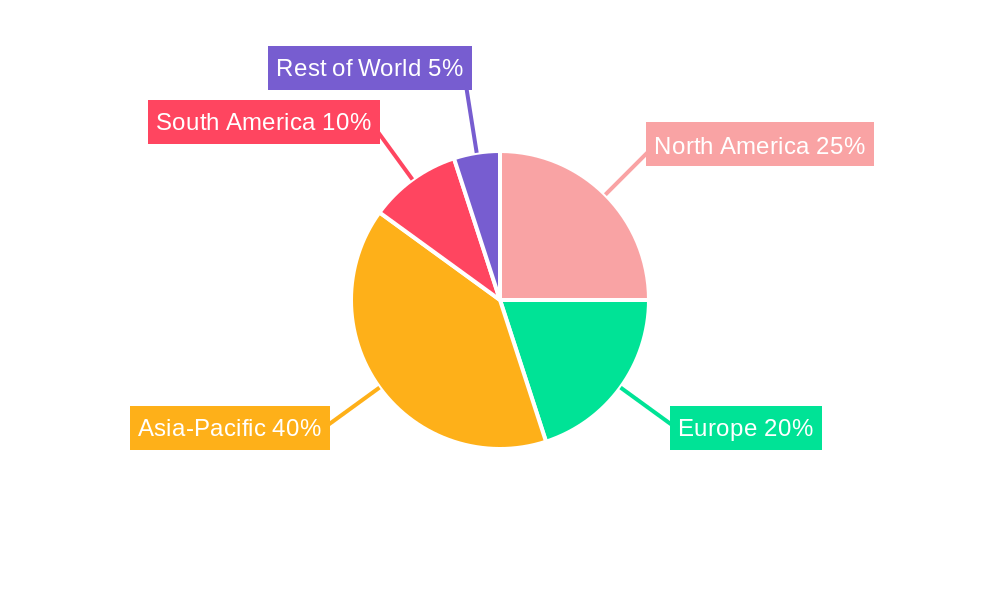
Geographically, the Asia-Pacific and North America regions are expected to lead market growth, driven by their extensive and rapidly developing aquaculture industries. Europe also represents a substantial market, supported by its mature aquaculture sector and consumer demand for sustainable seafood. Increasing emphasis on traceability and sustainable fishing certifications will likely foster market consolidation and elevate demand for premium, sustainably sourced semi-skimmed fish meal. Investment in R&D to boost feed efficiency and mitigate reliance on wild fish stocks is essential for the long-term viability of the semi-skimmed fish meal market. Technological advancements and a heightened awareness of sustainable practices will significantly influence the industry's trajectory over the next decade.
Semi-Skimmed Fish Meal Company Market Share
Semi-Skimmed Fish Meal Market Report: 2019-2033
This comprehensive report provides a detailed analysis of the global semi-skimmed fish meal market, covering market dynamics, growth trends, regional segmentation, product landscape, key players, and future outlook. The study period spans from 2019 to 2033, with 2025 serving as the base and estimated year. The forecast period extends from 2025 to 2033, while the historical period encompasses 2019-2024. This report is a crucial resource for industry professionals, investors, and stakeholders seeking to understand and capitalize on opportunities within this dynamic market. Parent market: Animal Feed; Child Market: Fish Feed.
Semi-Skimmed Fish Meal Market Dynamics & Structure
The semi-skimmed fish meal market is characterized by moderate concentration, with a few major players dominating the supply chain. Technological innovations, primarily focused on improving extraction processes and enhancing product quality, are driving market growth. Stringent regulatory frameworks concerning sustainability and food safety significantly impact market operations. Competitive pressure from alternative protein sources, such as plant-based meals, poses a considerable challenge. The end-user demographics are heavily concentrated in the aquaculture sector, particularly in the production of salmon and other high-value fish species. M&A activity has been relatively low in recent years, with xx million USD in deal volume during 2019-2024.
- Market Concentration: Moderately concentrated, with top 5 players holding approximately xx% market share in 2024.
- Technological Innovation: Focus on improving extraction efficiency and reducing environmental impact.
- Regulatory Framework: Stringent regulations on sustainability and food safety are driving market standardization.
- Competitive Substitutes: Plant-based protein alternatives pose a growing threat.
- End-User Demographics: Primarily aquaculture, particularly salmon farming.
- M&A Trends: Relatively low activity, with xx million USD in deal volume during 2019-2024. Increased consolidation expected in the forecast period.
Semi-Skimmed Fish Meal Growth Trends & Insights
The global semi-skimmed fish meal market experienced steady growth during the historical period (2019-2024), driven by the expanding aquaculture industry and increasing demand for high-quality protein sources in animal feed. The market size reached xx million units in 2024, exhibiting a CAGR of xx% during this period. Technological advancements in fish meal production, including improved extraction techniques and the development of more sustainable processing methods, have further contributed to market expansion. Consumer demand for sustainably sourced fishmeal is increasing, putting pressure on producers to adopt responsible practices. The market penetration rate in the key aquaculture segments is around xx% in 2024, indicating significant growth potential. Adoption of new technologies, like improved rendering processes and precision farming techniques is leading to increased efficiency and lower production costs. These trends point towards continued market growth, with a projected CAGR of xx% from 2025 to 2033. The market is expected to reach xx million units by 2033.
Dominant Regions, Countries, or Segments in Semi-Skimmed Fish Meal
The Asia-Pacific region dominates the global semi-skimmed fish meal market, fueled by rapid growth in aquaculture, particularly in countries like China and Vietnam. This dominance stems from several factors: high demand for seafood, government support for aquaculture development, and increasing investments in fish farming infrastructure. These factors collectively contribute to a substantial market share and significant growth potential for this region.
- Key Drivers in Asia-Pacific:
- Rapid expansion of aquaculture industry.
- Increasing per capita consumption of seafood.
- Government initiatives promoting sustainable aquaculture practices.
- High investment in aquaculture infrastructure.
- Market Share & Growth Potential: Asia-Pacific holds approximately xx% of the global market share in 2024, projected to reach xx% by 2033. The region is expected to maintain its dominance due to sustained growth in aquaculture and rising seafood consumption. Other regions such as Europe and North America also show steady growth, but at a slower pace compared to Asia-Pacific.
Semi-Skimmed Fish Meal Product Landscape
Semi-skimmed fish meal is primarily characterized by its protein content and fat levels, making it a versatile ingredient in animal feed formulations. Recent product innovations have focused on enhancing the nutritional profile through targeted processing techniques. This ensures consistent quality and optimized performance in aquaculture diets, contributing to higher yield and improved fish health. The growing demand for sustainable sourcing has prompted the development of fish meal derived from responsible fishing practices, creating a premium segment within the market.
Key Drivers, Barriers & Challenges in Semi-Skimmed Fish Meal
Key Drivers: The expanding global aquaculture industry, coupled with the rising demand for animal protein, is a primary driver. Technological advancements in sustainable and efficient production methods further boost growth. Favorable government policies supporting aquaculture development in various regions also play a significant role.
Challenges: Fluctuations in raw material prices, particularly fish catches, represent a substantial challenge. Stricter environmental regulations and concerns about overfishing necessitate the adoption of sustainable sourcing practices, increasing operational costs. Intense competition from alternative protein sources, such as soy meal and insect meal, adds another layer of complexity. Supply chain disruptions, like those caused by global pandemics, can significantly affect production and distribution.
Emerging Opportunities in Semi-Skimmed Fish Meal
Emerging opportunities lie in exploring new applications of semi-skimmed fish meal beyond aquaculture, such as in pet food and other animal feed segments. Further market expansion can be achieved by developing innovative products with enhanced nutritional profiles and functionalities, catering to specific dietary needs. Focusing on sustainable and traceable sourcing practices to meet growing consumer demand for environmentally responsible products will also open up significant market opportunities.
Growth Accelerators in the Semi-Skimmed Fish Meal Industry
Technological breakthroughs in processing and extraction techniques are crucial growth catalysts. Strategic partnerships between producers, aquaculture farms, and feed manufacturers optimize supply chains and ensure product quality. Expanding into new markets and developing tailored products for specific aquaculture species will further accelerate market growth.
Key Players Shaping the Semi-Skimmed Fish Meal Market
- Archer Daniels Midland
- Bluestar Adisseo
- Cargill
- TASA
- Diamante
- Austevoll Seafood ASA
- Copeinca
- Corpesca SA
- Omega Protein
- Coomarpes
- KT Group
- Cermaq
- FF Skagen
- Austral
- Kodiak Fishmeal
- Havsbrun
- Hayduk
- Exalmar
- Strel Nikova
- Nissui
- Iceland Pelagic
- Daybrook
- Rongcheng Blue Ocean Marine Bio
- Hisheng Feeds
- Chishan Group
- Dalian Longyuan Fishmeal
- Fengyu Halobios
- Hainan Fish Oil & Fish Meal
Notable Milestones in Semi-Skimmed Fish Meal Sector
- 2020: Increased focus on sustainable sourcing practices by major players.
- 2022: Introduction of new technologies for improved fishmeal extraction.
- 2023: Several mergers and acquisitions aimed at consolidating market share.
- 2024: Launch of several new fishmeal products with enhanced nutritional profiles.
In-Depth Semi-Skimmed Fish Meal Market Outlook
The semi-skimmed fish meal market is poised for sustained growth over the forecast period (2025-2033), driven by technological advancements, increasing demand from aquaculture, and a growing focus on sustainable production practices. Strategic partnerships and expansion into new markets will further enhance market potential. Opportunities exist in developing specialized products catering to specific aquaculture needs and in exploring new applications beyond traditional markets.
Semi-Skimmed Fish Meal Segmentation
-
1. Application
- 1.1. Aquaculture Feed
- 1.2. Poultry Feed
- 1.3. Pig Feed
- 1.4. Ruminant Feed
- 1.5. Pet Food
- 1.6. Other
-
2. Types
- 2.1. Flame Dried (FD) Fish Meal
- 2.2. Steam Dried (SD) Fish Meal
Semi-Skimmed Fish Meal Segmentation By Geography
-
1. North America
- 1.1. United States
- 1.2. Canada
- 1.3. Mexico
-
2. South America
- 2.1. Brazil
- 2.2. Argentina
- 2.3. Rest of South America
-
3. Europe
- 3.1. United Kingdom
- 3.2. Germany
- 3.3. France
- 3.4. Italy
- 3.5. Spain
- 3.6. Russia
- 3.7. Benelux
- 3.8. Nordics
- 3.9. Rest of Europe
-
4. Middle East & Africa
- 4.1. Turkey
- 4.2. Israel
- 4.3. GCC
- 4.4. North Africa
- 4.5. South Africa
- 4.6. Rest of Middle East & Africa
-
5. Asia Pacific
- 5.1. China
- 5.2. India
- 5.3. Japan
- 5.4. South Korea
- 5.5. ASEAN
- 5.6. Oceania
- 5.7. Rest of Asia Pacific
Semi-Skimmed Fish Meal Regional Market Share
Geographic Coverage of Semi-Skimmed Fish Meal
Semi-Skimmed Fish Meal REPORT HIGHLIGHTS
| Aspects | Details |
|---|---|
| Study Period | 2020-2034 |
| Base Year | 2025 |
| Estimated Year | 2026 |
| Forecast Period | 2026-2034 |
| Historical Period | 2020-2025 |
| Growth Rate | CAGR of 3.4% from 2020-2034 |
| Segmentation |
|
Table of Contents
- 1. Introduction
- 1.1. Research Scope
- 1.2. Market Segmentation
- 1.3. Research Methodology
- 1.4. Definitions and Assumptions
- 2. Executive Summary
- 2.1. Introduction
- 3. Market Dynamics
- 3.1. Introduction
- 3.2. Market Drivers
- 3.3. Market Restrains
- 3.4. Market Trends
- 4. Market Factor Analysis
- 4.1. Porters Five Forces
- 4.2. Supply/Value Chain
- 4.3. PESTEL analysis
- 4.4. Market Entropy
- 4.5. Patent/Trademark Analysis
- 5. Global Semi-Skimmed Fish Meal Analysis, Insights and Forecast, 2020-2032
- 5.1. Market Analysis, Insights and Forecast - by Application
- 5.1.1. Aquaculture Feed
- 5.1.2. Poultry Feed
- 5.1.3. Pig Feed
- 5.1.4. Ruminant Feed
- 5.1.5. Pet Food
- 5.1.6. Other
- 5.2. Market Analysis, Insights and Forecast - by Types
- 5.2.1. Flame Dried (FD) Fish Meal
- 5.2.2. Steam Dried (SD) Fish Meal
- 5.3. Market Analysis, Insights and Forecast - by Region
- 5.3.1. North America
- 5.3.2. South America
- 5.3.3. Europe
- 5.3.4. Middle East & Africa
- 5.3.5. Asia Pacific
- 5.1. Market Analysis, Insights and Forecast - by Application
- 6. North America Semi-Skimmed Fish Meal Analysis, Insights and Forecast, 2020-2032
- 6.1. Market Analysis, Insights and Forecast - by Application
- 6.1.1. Aquaculture Feed
- 6.1.2. Poultry Feed
- 6.1.3. Pig Feed
- 6.1.4. Ruminant Feed
- 6.1.5. Pet Food
- 6.1.6. Other
- 6.2. Market Analysis, Insights and Forecast - by Types
- 6.2.1. Flame Dried (FD) Fish Meal
- 6.2.2. Steam Dried (SD) Fish Meal
- 6.1. Market Analysis, Insights and Forecast - by Application
- 7. South America Semi-Skimmed Fish Meal Analysis, Insights and Forecast, 2020-2032
- 7.1. Market Analysis, Insights and Forecast - by Application
- 7.1.1. Aquaculture Feed
- 7.1.2. Poultry Feed
- 7.1.3. Pig Feed
- 7.1.4. Ruminant Feed
- 7.1.5. Pet Food
- 7.1.6. Other
- 7.2. Market Analysis, Insights and Forecast - by Types
- 7.2.1. Flame Dried (FD) Fish Meal
- 7.2.2. Steam Dried (SD) Fish Meal
- 7.1. Market Analysis, Insights and Forecast - by Application
- 8. Europe Semi-Skimmed Fish Meal Analysis, Insights and Forecast, 2020-2032
- 8.1. Market Analysis, Insights and Forecast - by Application
- 8.1.1. Aquaculture Feed
- 8.1.2. Poultry Feed
- 8.1.3. Pig Feed
- 8.1.4. Ruminant Feed
- 8.1.5. Pet Food
- 8.1.6. Other
- 8.2. Market Analysis, Insights and Forecast - by Types
- 8.2.1. Flame Dried (FD) Fish Meal
- 8.2.2. Steam Dried (SD) Fish Meal
- 8.1. Market Analysis, Insights and Forecast - by Application
- 9. Middle East & Africa Semi-Skimmed Fish Meal Analysis, Insights and Forecast, 2020-2032
- 9.1. Market Analysis, Insights and Forecast - by Application
- 9.1.1. Aquaculture Feed
- 9.1.2. Poultry Feed
- 9.1.3. Pig Feed
- 9.1.4. Ruminant Feed
- 9.1.5. Pet Food
- 9.1.6. Other
- 9.2. Market Analysis, Insights and Forecast - by Types
- 9.2.1. Flame Dried (FD) Fish Meal
- 9.2.2. Steam Dried (SD) Fish Meal
- 9.1. Market Analysis, Insights and Forecast - by Application
- 10. Asia Pacific Semi-Skimmed Fish Meal Analysis, Insights and Forecast, 2020-2032
- 10.1. Market Analysis, Insights and Forecast - by Application
- 10.1.1. Aquaculture Feed
- 10.1.2. Poultry Feed
- 10.1.3. Pig Feed
- 10.1.4. Ruminant Feed
- 10.1.5. Pet Food
- 10.1.6. Other
- 10.2. Market Analysis, Insights and Forecast - by Types
- 10.2.1. Flame Dried (FD) Fish Meal
- 10.2.2. Steam Dried (SD) Fish Meal
- 10.1. Market Analysis, Insights and Forecast - by Application
- 11. Competitive Analysis
- 11.1. Global Market Share Analysis 2025
- 11.2. Company Profiles
- 11.2.1 Archer Daniels Midland
- 11.2.1.1. Overview
- 11.2.1.2. Products
- 11.2.1.3. SWOT Analysis
- 11.2.1.4. Recent Developments
- 11.2.1.5. Financials (Based on Availability)
- 11.2.2 Bluestar Adisseo
- 11.2.2.1. Overview
- 11.2.2.2. Products
- 11.2.2.3. SWOT Analysis
- 11.2.2.4. Recent Developments
- 11.2.2.5. Financials (Based on Availability)
- 11.2.3 Cargill
- 11.2.3.1. Overview
- 11.2.3.2. Products
- 11.2.3.3. SWOT Analysis
- 11.2.3.4. Recent Developments
- 11.2.3.5. Financials (Based on Availability)
- 11.2.4 TASA
- 11.2.4.1. Overview
- 11.2.4.2. Products
- 11.2.4.3. SWOT Analysis
- 11.2.4.4. Recent Developments
- 11.2.4.5. Financials (Based on Availability)
- 11.2.5 Diamante
- 11.2.5.1. Overview
- 11.2.5.2. Products
- 11.2.5.3. SWOT Analysis
- 11.2.5.4. Recent Developments
- 11.2.5.5. Financials (Based on Availability)
- 11.2.6 Austevoll Seafood ASA
- 11.2.6.1. Overview
- 11.2.6.2. Products
- 11.2.6.3. SWOT Analysis
- 11.2.6.4. Recent Developments
- 11.2.6.5. Financials (Based on Availability)
- 11.2.7 Copeinca
- 11.2.7.1. Overview
- 11.2.7.2. Products
- 11.2.7.3. SWOT Analysis
- 11.2.7.4. Recent Developments
- 11.2.7.5. Financials (Based on Availability)
- 11.2.8 Corpesca SA
- 11.2.8.1. Overview
- 11.2.8.2. Products
- 11.2.8.3. SWOT Analysis
- 11.2.8.4. Recent Developments
- 11.2.8.5. Financials (Based on Availability)
- 11.2.9 Omega Protein
- 11.2.9.1. Overview
- 11.2.9.2. Products
- 11.2.9.3. SWOT Analysis
- 11.2.9.4. Recent Developments
- 11.2.9.5. Financials (Based on Availability)
- 11.2.10 Coomarpes
- 11.2.10.1. Overview
- 11.2.10.2. Products
- 11.2.10.3. SWOT Analysis
- 11.2.10.4. Recent Developments
- 11.2.10.5. Financials (Based on Availability)
- 11.2.11 KT Group
- 11.2.11.1. Overview
- 11.2.11.2. Products
- 11.2.11.3. SWOT Analysis
- 11.2.11.4. Recent Developments
- 11.2.11.5. Financials (Based on Availability)
- 11.2.12 Cermaq
- 11.2.12.1. Overview
- 11.2.12.2. Products
- 11.2.12.3. SWOT Analysis
- 11.2.12.4. Recent Developments
- 11.2.12.5. Financials (Based on Availability)
- 11.2.13 FF Skagen
- 11.2.13.1. Overview
- 11.2.13.2. Products
- 11.2.13.3. SWOT Analysis
- 11.2.13.4. Recent Developments
- 11.2.13.5. Financials (Based on Availability)
- 11.2.14 Austral
- 11.2.14.1. Overview
- 11.2.14.2. Products
- 11.2.14.3. SWOT Analysis
- 11.2.14.4. Recent Developments
- 11.2.14.5. Financials (Based on Availability)
- 11.2.15 Kodiak Fishmeal
- 11.2.15.1. Overview
- 11.2.15.2. Products
- 11.2.15.3. SWOT Analysis
- 11.2.15.4. Recent Developments
- 11.2.15.5. Financials (Based on Availability)
- 11.2.16 Havsbrun
- 11.2.16.1. Overview
- 11.2.16.2. Products
- 11.2.16.3. SWOT Analysis
- 11.2.16.4. Recent Developments
- 11.2.16.5. Financials (Based on Availability)
- 11.2.17 Hayduk
- 11.2.17.1. Overview
- 11.2.17.2. Products
- 11.2.17.3. SWOT Analysis
- 11.2.17.4. Recent Developments
- 11.2.17.5. Financials (Based on Availability)
- 11.2.18 Exalmar
- 11.2.18.1. Overview
- 11.2.18.2. Products
- 11.2.18.3. SWOT Analysis
- 11.2.18.4. Recent Developments
- 11.2.18.5. Financials (Based on Availability)
- 11.2.19 Strel Nikova
- 11.2.19.1. Overview
- 11.2.19.2. Products
- 11.2.19.3. SWOT Analysis
- 11.2.19.4. Recent Developments
- 11.2.19.5. Financials (Based on Availability)
- 11.2.20 Nissui
- 11.2.20.1. Overview
- 11.2.20.2. Products
- 11.2.20.3. SWOT Analysis
- 11.2.20.4. Recent Developments
- 11.2.20.5. Financials (Based on Availability)
- 11.2.21 Iceland Pelagic
- 11.2.21.1. Overview
- 11.2.21.2. Products
- 11.2.21.3. SWOT Analysis
- 11.2.21.4. Recent Developments
- 11.2.21.5. Financials (Based on Availability)
- 11.2.22 Daybrook
- 11.2.22.1. Overview
- 11.2.22.2. Products
- 11.2.22.3. SWOT Analysis
- 11.2.22.4. Recent Developments
- 11.2.22.5. Financials (Based on Availability)
- 11.2.23 Rongcheng Blue Ocean Marine Bio
- 11.2.23.1. Overview
- 11.2.23.2. Products
- 11.2.23.3. SWOT Analysis
- 11.2.23.4. Recent Developments
- 11.2.23.5. Financials (Based on Availability)
- 11.2.24 Hisheng Feeds
- 11.2.24.1. Overview
- 11.2.24.2. Products
- 11.2.24.3. SWOT Analysis
- 11.2.24.4. Recent Developments
- 11.2.24.5. Financials (Based on Availability)
- 11.2.25 Chishan Group
- 11.2.25.1. Overview
- 11.2.25.2. Products
- 11.2.25.3. SWOT Analysis
- 11.2.25.4. Recent Developments
- 11.2.25.5. Financials (Based on Availability)
- 11.2.26 Dalian Longyuan Fishmeal
- 11.2.26.1. Overview
- 11.2.26.2. Products
- 11.2.26.3. SWOT Analysis
- 11.2.26.4. Recent Developments
- 11.2.26.5. Financials (Based on Availability)
- 11.2.27 Fengyu Halobios
- 11.2.27.1. Overview
- 11.2.27.2. Products
- 11.2.27.3. SWOT Analysis
- 11.2.27.4. Recent Developments
- 11.2.27.5. Financials (Based on Availability)
- 11.2.28 Hainan Fish Oil & Fish Meal
- 11.2.28.1. Overview
- 11.2.28.2. Products
- 11.2.28.3. SWOT Analysis
- 11.2.28.4. Recent Developments
- 11.2.28.5. Financials (Based on Availability)
- 11.2.1 Archer Daniels Midland
List of Figures
- Figure 1: Global Semi-Skimmed Fish Meal Revenue Breakdown (million, %) by Region 2025 & 2033
- Figure 2: North America Semi-Skimmed Fish Meal Revenue (million), by Application 2025 & 2033
- Figure 3: North America Semi-Skimmed Fish Meal Revenue Share (%), by Application 2025 & 2033
- Figure 4: North America Semi-Skimmed Fish Meal Revenue (million), by Types 2025 & 2033
- Figure 5: North America Semi-Skimmed Fish Meal Revenue Share (%), by Types 2025 & 2033
- Figure 6: North America Semi-Skimmed Fish Meal Revenue (million), by Country 2025 & 2033
- Figure 7: North America Semi-Skimmed Fish Meal Revenue Share (%), by Country 2025 & 2033
- Figure 8: South America Semi-Skimmed Fish Meal Revenue (million), by Application 2025 & 2033
- Figure 9: South America Semi-Skimmed Fish Meal Revenue Share (%), by Application 2025 & 2033
- Figure 10: South America Semi-Skimmed Fish Meal Revenue (million), by Types 2025 & 2033
- Figure 11: South America Semi-Skimmed Fish Meal Revenue Share (%), by Types 2025 & 2033
- Figure 12: South America Semi-Skimmed Fish Meal Revenue (million), by Country 2025 & 2033
- Figure 13: South America Semi-Skimmed Fish Meal Revenue Share (%), by Country 2025 & 2033
- Figure 14: Europe Semi-Skimmed Fish Meal Revenue (million), by Application 2025 & 2033
- Figure 15: Europe Semi-Skimmed Fish Meal Revenue Share (%), by Application 2025 & 2033
- Figure 16: Europe Semi-Skimmed Fish Meal Revenue (million), by Types 2025 & 2033
- Figure 17: Europe Semi-Skimmed Fish Meal Revenue Share (%), by Types 2025 & 2033
- Figure 18: Europe Semi-Skimmed Fish Meal Revenue (million), by Country 2025 & 2033
- Figure 19: Europe Semi-Skimmed Fish Meal Revenue Share (%), by Country 2025 & 2033
- Figure 20: Middle East & Africa Semi-Skimmed Fish Meal Revenue (million), by Application 2025 & 2033
- Figure 21: Middle East & Africa Semi-Skimmed Fish Meal Revenue Share (%), by Application 2025 & 2033
- Figure 22: Middle East & Africa Semi-Skimmed Fish Meal Revenue (million), by Types 2025 & 2033
- Figure 23: Middle East & Africa Semi-Skimmed Fish Meal Revenue Share (%), by Types 2025 & 2033
- Figure 24: Middle East & Africa Semi-Skimmed Fish Meal Revenue (million), by Country 2025 & 2033
- Figure 25: Middle East & Africa Semi-Skimmed Fish Meal Revenue Share (%), by Country 2025 & 2033
- Figure 26: Asia Pacific Semi-Skimmed Fish Meal Revenue (million), by Application 2025 & 2033
- Figure 27: Asia Pacific Semi-Skimmed Fish Meal Revenue Share (%), by Application 2025 & 2033
- Figure 28: Asia Pacific Semi-Skimmed Fish Meal Revenue (million), by Types 2025 & 2033
- Figure 29: Asia Pacific Semi-Skimmed Fish Meal Revenue Share (%), by Types 2025 & 2033
- Figure 30: Asia Pacific Semi-Skimmed Fish Meal Revenue (million), by Country 2025 & 2033
- Figure 31: Asia Pacific Semi-Skimmed Fish Meal Revenue Share (%), by Country 2025 & 2033
List of Tables
- Table 1: Global Semi-Skimmed Fish Meal Revenue million Forecast, by Application 2020 & 2033
- Table 2: Global Semi-Skimmed Fish Meal Revenue million Forecast, by Types 2020 & 2033
- Table 3: Global Semi-Skimmed Fish Meal Revenue million Forecast, by Region 2020 & 2033
- Table 4: Global Semi-Skimmed Fish Meal Revenue million Forecast, by Application 2020 & 2033
- Table 5: Global Semi-Skimmed Fish Meal Revenue million Forecast, by Types 2020 & 2033
- Table 6: Global Semi-Skimmed Fish Meal Revenue million Forecast, by Country 2020 & 2033
- Table 7: United States Semi-Skimmed Fish Meal Revenue (million) Forecast, by Application 2020 & 2033
- Table 8: Canada Semi-Skimmed Fish Meal Revenue (million) Forecast, by Application 2020 & 2033
- Table 9: Mexico Semi-Skimmed Fish Meal Revenue (million) Forecast, by Application 2020 & 2033
- Table 10: Global Semi-Skimmed Fish Meal Revenue million Forecast, by Application 2020 & 2033
- Table 11: Global Semi-Skimmed Fish Meal Revenue million Forecast, by Types 2020 & 2033
- Table 12: Global Semi-Skimmed Fish Meal Revenue million Forecast, by Country 2020 & 2033
- Table 13: Brazil Semi-Skimmed Fish Meal Revenue (million) Forecast, by Application 2020 & 2033
- Table 14: Argentina Semi-Skimmed Fish Meal Revenue (million) Forecast, by Application 2020 & 2033
- Table 15: Rest of South America Semi-Skimmed Fish Meal Revenue (million) Forecast, by Application 2020 & 2033
- Table 16: Global Semi-Skimmed Fish Meal Revenue million Forecast, by Application 2020 & 2033
- Table 17: Global Semi-Skimmed Fish Meal Revenue million Forecast, by Types 2020 & 2033
- Table 18: Global Semi-Skimmed Fish Meal Revenue million Forecast, by Country 2020 & 2033
- Table 19: United Kingdom Semi-Skimmed Fish Meal Revenue (million) Forecast, by Application 2020 & 2033
- Table 20: Germany Semi-Skimmed Fish Meal Revenue (million) Forecast, by Application 2020 & 2033
- Table 21: France Semi-Skimmed Fish Meal Revenue (million) Forecast, by Application 2020 & 2033
- Table 22: Italy Semi-Skimmed Fish Meal Revenue (million) Forecast, by Application 2020 & 2033
- Table 23: Spain Semi-Skimmed Fish Meal Revenue (million) Forecast, by Application 2020 & 2033
- Table 24: Russia Semi-Skimmed Fish Meal Revenue (million) Forecast, by Application 2020 & 2033
- Table 25: Benelux Semi-Skimmed Fish Meal Revenue (million) Forecast, by Application 2020 & 2033
- Table 26: Nordics Semi-Skimmed Fish Meal Revenue (million) Forecast, by Application 2020 & 2033
- Table 27: Rest of Europe Semi-Skimmed Fish Meal Revenue (million) Forecast, by Application 2020 & 2033
- Table 28: Global Semi-Skimmed Fish Meal Revenue million Forecast, by Application 2020 & 2033
- Table 29: Global Semi-Skimmed Fish Meal Revenue million Forecast, by Types 2020 & 2033
- Table 30: Global Semi-Skimmed Fish Meal Revenue million Forecast, by Country 2020 & 2033
- Table 31: Turkey Semi-Skimmed Fish Meal Revenue (million) Forecast, by Application 2020 & 2033
- Table 32: Israel Semi-Skimmed Fish Meal Revenue (million) Forecast, by Application 2020 & 2033
- Table 33: GCC Semi-Skimmed Fish Meal Revenue (million) Forecast, by Application 2020 & 2033
- Table 34: North Africa Semi-Skimmed Fish Meal Revenue (million) Forecast, by Application 2020 & 2033
- Table 35: South Africa Semi-Skimmed Fish Meal Revenue (million) Forecast, by Application 2020 & 2033
- Table 36: Rest of Middle East & Africa Semi-Skimmed Fish Meal Revenue (million) Forecast, by Application 2020 & 2033
- Table 37: Global Semi-Skimmed Fish Meal Revenue million Forecast, by Application 2020 & 2033
- Table 38: Global Semi-Skimmed Fish Meal Revenue million Forecast, by Types 2020 & 2033
- Table 39: Global Semi-Skimmed Fish Meal Revenue million Forecast, by Country 2020 & 2033
- Table 40: China Semi-Skimmed Fish Meal Revenue (million) Forecast, by Application 2020 & 2033
- Table 41: India Semi-Skimmed Fish Meal Revenue (million) Forecast, by Application 2020 & 2033
- Table 42: Japan Semi-Skimmed Fish Meal Revenue (million) Forecast, by Application 2020 & 2033
- Table 43: South Korea Semi-Skimmed Fish Meal Revenue (million) Forecast, by Application 2020 & 2033
- Table 44: ASEAN Semi-Skimmed Fish Meal Revenue (million) Forecast, by Application 2020 & 2033
- Table 45: Oceania Semi-Skimmed Fish Meal Revenue (million) Forecast, by Application 2020 & 2033
- Table 46: Rest of Asia Pacific Semi-Skimmed Fish Meal Revenue (million) Forecast, by Application 2020 & 2033
Frequently Asked Questions
1. What is the projected Compound Annual Growth Rate (CAGR) of the Semi-Skimmed Fish Meal?
The projected CAGR is approximately 3.4%.
2. Which companies are prominent players in the Semi-Skimmed Fish Meal?
Key companies in the market include Archer Daniels Midland, Bluestar Adisseo, Cargill, TASA, Diamante, Austevoll Seafood ASA, Copeinca, Corpesca SA, Omega Protein, Coomarpes, KT Group, Cermaq, FF Skagen, Austral, Kodiak Fishmeal, Havsbrun, Hayduk, Exalmar, Strel Nikova, Nissui, Iceland Pelagic, Daybrook, Rongcheng Blue Ocean Marine Bio, Hisheng Feeds, Chishan Group, Dalian Longyuan Fishmeal, Fengyu Halobios, Hainan Fish Oil & Fish Meal.
3. What are the main segments of the Semi-Skimmed Fish Meal?
The market segments include Application, Types.
4. Can you provide details about the market size?
The market size is estimated to be USD 5916 million as of 2022.
5. What are some drivers contributing to market growth?
N/A
6. What are the notable trends driving market growth?
N/A
7. Are there any restraints impacting market growth?
N/A
8. Can you provide examples of recent developments in the market?
N/A
9. What pricing options are available for accessing the report?
Pricing options include single-user, multi-user, and enterprise licenses priced at USD 5600.00, USD 8400.00, and USD 11200.00 respectively.
10. Is the market size provided in terms of value or volume?
The market size is provided in terms of value, measured in million.
11. Are there any specific market keywords associated with the report?
Yes, the market keyword associated with the report is "Semi-Skimmed Fish Meal," which aids in identifying and referencing the specific market segment covered.
12. How do I determine which pricing option suits my needs best?
The pricing options vary based on user requirements and access needs. Individual users may opt for single-user licenses, while businesses requiring broader access may choose multi-user or enterprise licenses for cost-effective access to the report.
13. Are there any additional resources or data provided in the Semi-Skimmed Fish Meal report?
While the report offers comprehensive insights, it's advisable to review the specific contents or supplementary materials provided to ascertain if additional resources or data are available.
14. How can I stay updated on further developments or reports in the Semi-Skimmed Fish Meal?
To stay informed about further developments, trends, and reports in the Semi-Skimmed Fish Meal, consider subscribing to industry newsletters, following relevant companies and organizations, or regularly checking reputable industry news sources and publications.
Methodology
Step 1 - Identification of Relevant Samples Size from Population Database


Step 2 - Approaches for Defining Global Market Size (Value, Volume* & Price*)

Note*: In applicable scenarios
Step 3 - Data Sources
Primary Research
- Web Analytics
- Survey Reports
- Research Institute
- Latest Research Reports
- Opinion Leaders
Secondary Research
- Annual Reports
- White Paper
- Latest Press Release
- Industry Association
- Paid Database
- Investor Presentations

Step 4 - Data Triangulation
Involves using different sources of information in order to increase the validity of a study
These sources are likely to be stakeholders in a program - participants, other researchers, program staff, other community members, and so on.
Then we put all data in single framework & apply various statistical tools to find out the dynamic on the market.
During the analysis stage, feedback from the stakeholder groups would be compared to determine areas of agreement as well as areas of divergence