

Key Insights
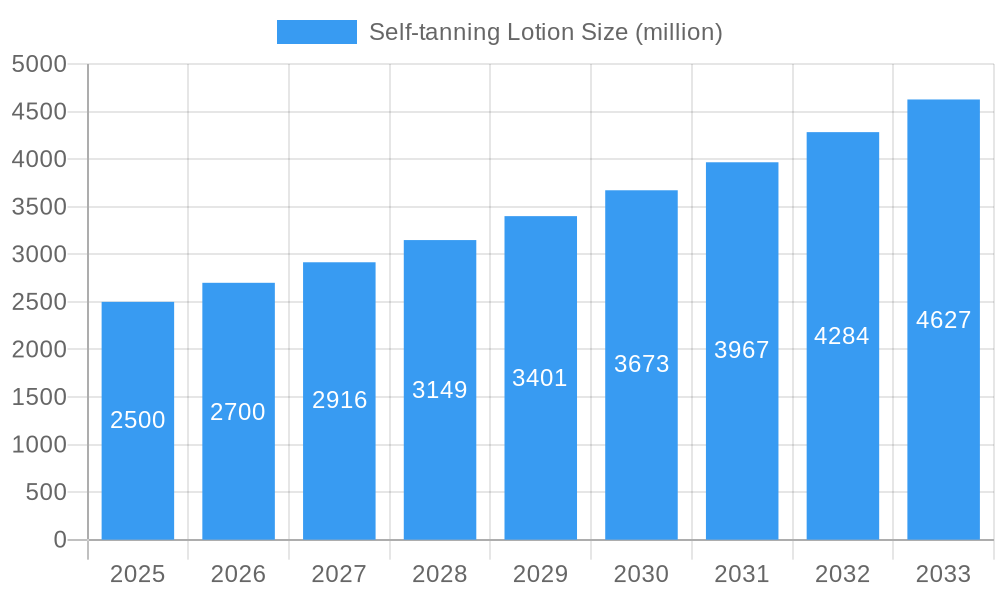
The global Self-tanning Lotion market is experiencing robust growth, projected to reach an estimated USD 2,500 million by 2025, with a Compound Annual Growth Rate (CAGR) of approximately 8% during the forecast period of 2025-2033. This expansion is fueled by a growing consumer desire for a sun-kissed glow without the risks associated with UV exposure, driven by increasing awareness of skin cancer and premature aging. The market is also benefiting from advancements in product formulations, offering more natural-looking results, longer-lasting effects, and improved ease of application. Gradual tanning lotions are gaining traction due to their ability to provide a subtle, buildable color, while instant tanning lotions cater to consumers seeking immediate cosmetic benefits. The rising influence of social media and beauty influencers further amplifies demand, showcasing the aesthetic appeal of self-tanned skin across diverse demographics.
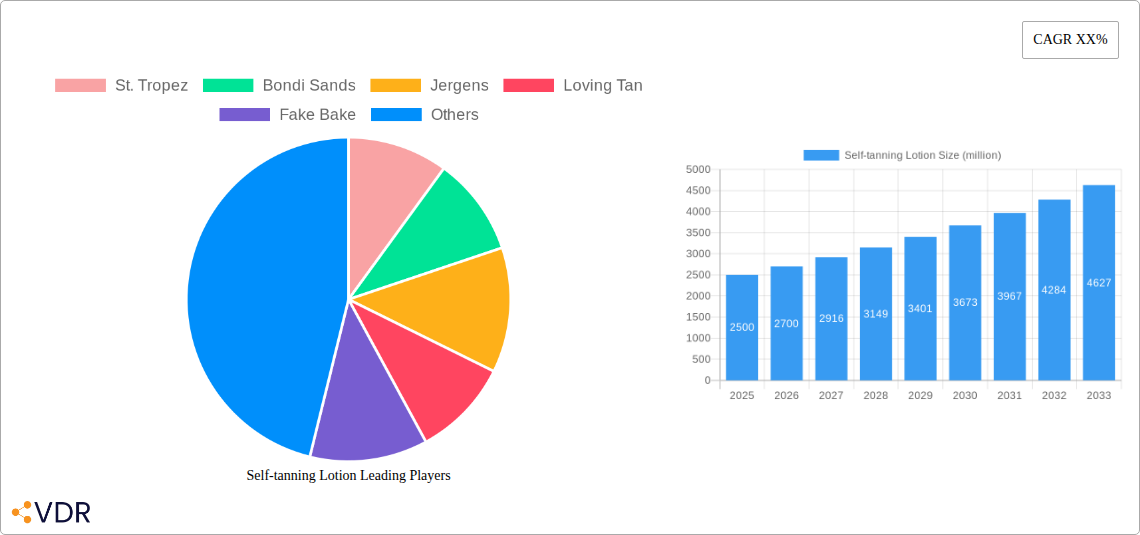
Self-tanning Lotion Market Size (In Billion)
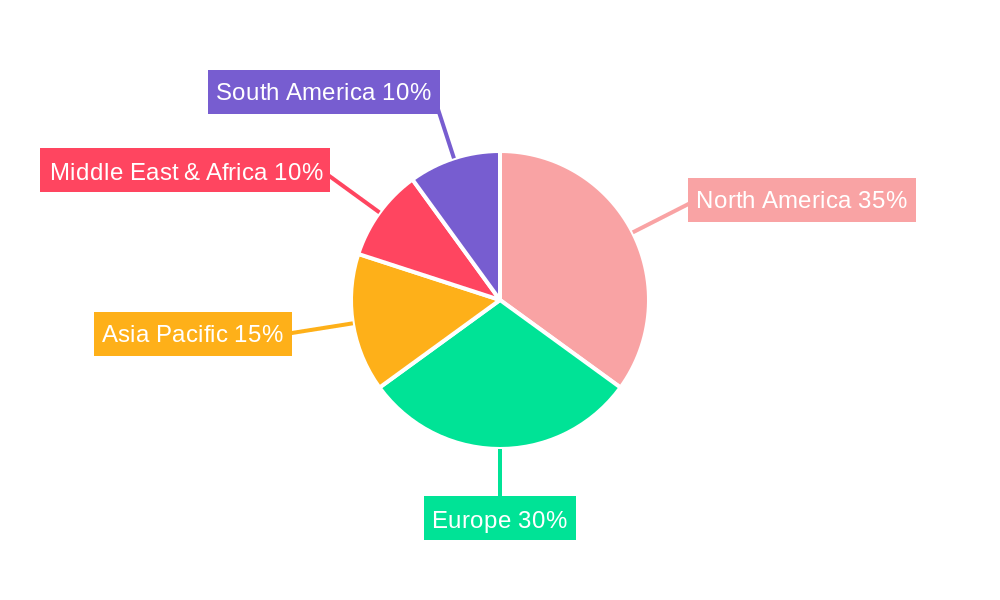
The market's expansion is further supported by evolving consumer preferences towards convenience and accessibility. Online sales channels are playing a pivotal role, allowing consumers to easily purchase a wide array of self-tanning products from leading brands like St. Tropez, Bondi Sands, and Jergens, anytime and anywhere. Specialty stores and supermarkets also contribute significantly to market penetration, offering impulse purchase opportunities. Regionally, North America and Europe currently dominate the market, driven by high disposable incomes and a strong beauty consciousness. However, the Asia Pacific region is emerging as a high-growth area, with increasing adoption of beauty and personal care products, coupled with a rising middle class. Restraints include potential concerns regarding streaking, odor, and the availability of more affordable alternatives, but ongoing product innovation and consumer education are effectively mitigating these challenges, ensuring a positive trajectory for the self-tanning lotion industry.
Self-tanning Lotion Company Market Share
Self-tanning Lotion Market Report: Comprehensive Analysis & Future Outlook (2019-2033)
Unlock the expansive potential of the global self-tanning lotion market with this in-depth report. Designed for industry professionals, manufacturers, and investors, this analysis provides critical insights into market dynamics, growth trends, regional dominance, product innovations, and key players shaping the future of sunless tanning. Our research leverages high-traffic keywords and a detailed breakdown of parent and child markets to deliver unparalleled SEO visibility and actionable intelligence.
Self-tanning Lotion Market Dynamics & Structure
The self-tanning lotion market is characterized by a moderately concentrated structure, with a blend of established global brands and emerging niche players. Technological innovation remains a primary driver, fueled by advancements in formulation science leading to more natural-looking, longer-lasting, and skin-nourishing products. Regulatory frameworks, primarily focused on ingredient safety and labeling, influence product development and market entry. Competitive product substitutes, including spray tans and tanning beds, present ongoing challenges, though convenience and home-based application continue to favor lotions. End-user demographics are broadening, with increasing adoption among younger consumers and a growing male demographic seeking cosmetic enhancements. Mergers and acquisitions (M&A) activity, though not at its peak, is strategic, often aimed at acquiring innovative technologies or expanding market reach. The barrier to innovation is relatively low, but achieving significant market differentiation in a crowded space requires substantial marketing investment and unique product propositions. Estimated market share for top players currently hovers around 10-15%, with numerous smaller players capturing the remaining share. M&A deal volumes are projected to increase by approximately 8% in the coming years as consolidation opportunities arise.
- Market Concentration: Moderately concentrated, with a balance of large corporations and specialized brands.
- Technological Innovation: Driven by advancements in DHA encapsulation, color development, and skincare integration.
- Regulatory Frameworks: Focused on consumer safety, ingredient transparency, and environmental impact.
- Competitive Substitutes: Includes spray tans, tanning beds, and bronzing lotions; market share of substitutes estimated at 20 million units annually.
- End-User Demographics: Expanding to include millennials, Gen Z, and an increasing male consumer base.
- M&A Trends: Strategic acquisitions targeting innovative formulations and expanded distribution channels.
- Innovation Barriers: Achieving brand differentiation and cost-effective marketing in a competitive landscape.
- Market Share of Top Players: Estimated at 10-15% each for leading brands.
- Projected M&A Increase: Approximately 8% in the next 3-5 years.
Self-tanning Lotion Growth Trends & Insights
The global self-tanning lotion market is poised for robust growth, projected to expand at a Compound Annual Growth Rate (CAGR) of approximately 7.5% during the forecast period of 2025–2033. This growth trajectory is underpinned by evolving consumer preferences, a heightened focus on aesthetic appeal, and the increasing accessibility of sunless tanning solutions. The market size, estimated at $3,800 million in 2025, is expected to reach $6,500 million by 2033. Adoption rates are steadily increasing, driven by the desire for a healthy-looking tan without the harmful effects of UV radiation. Technological disruptions, such as the development of streak-free formulas, customizable shades, and integrated skincare benefits, are significantly enhancing product appeal. Consumer behavior shifts are evident, with a growing segment of consumers prioritizing at-home beauty treatments and embracing self-care rituals. Market penetration, currently around 40% of the target demographic, is expected to climb to over 60% by the end of the forecast period. The convenience of self-tanning lotions, coupled with widespread marketing efforts highlighting their safety and efficacy, is contributing to this accelerated adoption. Furthermore, the influence of social media and beauty influencers has played a pivotal role in normalizing and promoting self-tanning products, particularly among younger demographics. The increasing availability of gradual tanning lotions and instant tanning lotions caters to a wider range of user preferences and desired outcomes.
- Projected Market Size (2025): $3,800 million units.
- Projected Market Size (2033): $6,500 million units.
- CAGR (2025–2033): Approximately 7.5%.
- Adoption Rate Growth: Steady increase driven by safety concerns and aesthetic trends.
- Technological Disruptions: Streak-free formulas, customizable shades, skincare benefits.
- Consumer Behavior Shifts: Preference for at-home treatments and self-care.
- Market Penetration (2025): Approximately 40%.
- Market Penetration (2033): Over 60%.
- Influences: Social media, beauty influencers, convenience of application.
Dominant Regions, Countries, or Segments in Self-tanning Lotion
North America, particularly the United States, is anticipated to remain the dominant region in the global self-tanning lotion market throughout the forecast period. This dominance is attributed to a confluence of factors including a high disposable income, a strong beauty and personal care market, and a deeply ingrained culture of aesthetic consciousness. Within North America, the Online Sales segment is projected to be the fastest-growing application channel, driven by the convenience of e-commerce and the vast product selection available. Online sales are expected to capture a significant market share, estimated at 45% of the total market by 2033. This growth is fueled by major e-commerce platforms and direct-to-consumer (DTC) strategies employed by brands. Specialty Stores also hold a substantial share, offering curated selections and expert advice, estimated at 30% of the market. Supermarkets continue to be a significant channel, providing accessibility and competitive pricing, accounting for approximately 20% of the market. The "Other" category, encompassing salons and professional use, contributes the remaining 5%.
In terms of product types, Gradual Tanning Lotions are expected to lead the market, projected to account for 65% of sales by 2033. Their appeal lies in their user-friendly nature, offering a natural-looking tan that builds over time, minimizing the risk of streaks and errors, and catering to consumers new to self-tanning. Instant Tanning Lotions, while offering immediate results, are anticipated to hold a 35% share, primarily catering to consumers seeking quick cosmetic touch-ups or event-specific tans. Key drivers for dominance in North America include robust economic policies supporting consumer spending on beauty products, advanced retail infrastructure facilitating widespread distribution, and an increasing awareness of the health risks associated with UV tanning. The high market share of online sales is supported by widespread internet penetration and a consumer preference for digital shopping experiences. The growing acceptance of self-tanning as a regular beauty routine, rather than an occasional luxury, further solidifies the dominance of these segments and regions.
- Dominant Region: North America (particularly the United States).
- Leading Application Segment: Online Sales (projected 45% by 2033).
- Specialty Stores Share: Approximately 30% of the market.
- Supermarkets Share: Approximately 20% of the market.
- Other Applications Share: Approximately 5% of the market.
- Dominant Product Type: Gradual Tanning Lotions (projected 65% by 2033).
- Instant Tanning Lotions Share: Approximately 35% of the market.
- Key Drivers in North America: High disposable income, strong beauty market, aesthetic consciousness, economic policies, retail infrastructure, internet penetration.
Self-tanning Lotion Product Landscape
The self-tanning lotion product landscape is continually evolving with a focus on enhanced user experience and skin benefits. Innovations include advanced DHA (dihydroxyacetone) delivery systems for more even color development and reduced odor, as well as the incorporation of skincare ingredients like hyaluronic acid and vitamins for hydration and anti-aging properties. Products are increasingly offering a wider spectrum of shades to cater to diverse skin tones, from fair to deep. Unique selling propositions revolve around natural-looking finishes, streak-free application, quick drying times, and long-lasting color. Technological advancements are also seen in the development of mood-boosting or aromatherapy-infused self-tanners, adding a sensorial dimension to the application process. The market also sees a surge in 'clean beauty' formulations, free from parabens, sulfates, and synthetic fragrances, aligning with growing consumer demand for natural and sustainable products.
Key Drivers, Barriers & Challenges in Self-tanning Lotion
Key Drivers: The self-tanning lotion market is propelled by a strong desire for a tanned appearance without the detrimental effects of UV exposure, driven by increased awareness of skin cancer risks. The growing emphasis on personal grooming and aesthetic appeal across all age groups and genders is a significant catalyst. Technological advancements in formulation, leading to more natural and user-friendly products, further fuel growth. The convenience of at-home application and the expanding accessibility through online sales channels also contribute substantially to market expansion.
Key Barriers & Challenges: Despite its growth, the market faces challenges such as the persistent perception of self-tanners as artificial or streaky, requiring continuous education and product improvement. Supply chain disruptions and the fluctuating cost of key raw materials can impact profitability. Stringent regulatory requirements in different regions regarding ingredient safety and labeling can create compliance hurdles. Intense competition from established brands and the emergence of new entrants, coupled with the need for significant marketing investment to build brand awareness, present ongoing competitive pressures. The forecasted impact of supply chain issues is a potential 5-7% increase in production costs.
Emerging Opportunities in Self-tanning Lotion
Emerging opportunities in the self-tanning lotion market lie in the development of personalized tanning solutions and the expansion into underserved demographics. The growing demand for "clean" and "vegan" beauty products presents a significant avenue for brands focusing on sustainable and ethical formulations, with an estimated 15% of new product development budget allocated to these aspects. Innovations in microencapsulation technology for controlled release of tanning agents and integrated skincare benefits, such as SPF protection or anti-aging compounds, offer unique selling propositions. Furthermore, the untapped potential within male-specific grooming products and the increasing acceptance of men using self-tanners represent a substantial growth segment. Exploring niche markets, such as travel-sized or specific-occasion tanners, also presents promising avenues.
Growth Accelerators in the Self-tanning Lotion Industry
Long-term growth in the self-tanning lotion industry is being significantly accelerated by ongoing technological breakthroughs in ingredient science, leading to superior product performance and consumer satisfaction. The increasing adoption of direct-to-consumer (DTC) sales models allows brands to build direct relationships with customers, gather valuable feedback, and personalize marketing efforts, contributing an estimated 10% increase in customer retention. Strategic partnerships between self-tanning brands and complementary beauty or wellness companies can unlock new distribution channels and customer bases. Furthermore, the continuous expansion of product lines to include a wider range of shades, formulations (e.g., mousses, sprays, drops), and skincare benefits caters to an ever-growing and diverse consumer demand, pushing market penetration further.
Key Players Shaping the Self-tanning Lotion Market
- St. Tropez
- Bondi Sands
- Jergens
- Loving Tan
- Fake Bake
- Tan-Luxe
- Vita Liberata
- Isle of Paradise
- Maui Babe
- Australian Gold
Notable Milestones in Self-tanning Lotion Sector
- 2019: Launch of innovative streak-free formulas by multiple key players, significantly improving user experience.
- 2020: Increased focus on "clean beauty" and natural ingredients as consumer demand surged, with a 25% rise in product launches adhering to these standards.
- 2021: Expansion of shade ranges to cater to a wider spectrum of skin tones, addressing inclusivity in the beauty market.
- 2022: Introduction of subscription-based models and personalized tanning routines by DTC brands, enhancing customer loyalty.
- 2023: Integration of skincare benefits, such as hyaluronic acid and vitamin E, into self-tanning lotions becoming a standard offering.
- 2024: Notable increase in the adoption of instant tanning drops and concentrates, offering highly customizable tanning solutions.
In-Depth Self-tanning Lotion Market Outlook
The self-tanning lotion market's future outlook remains exceptionally bright, driven by sustained innovation and evolving consumer priorities. Growth accelerators, including the relentless pursuit of natural-looking finishes, the incorporation of advanced skincare ingredients, and the expansion of product diversity, will continue to attract new users and retain existing ones. The increasing acceptance of self-tanning as a mainstream beauty practice, coupled with the ongoing shift towards at-home beauty solutions, provides a fertile ground for market expansion. Strategic marketing initiatives focusing on education, inclusivity, and the health benefits of sunless tanning will further solidify its position. The market is projected to witness continued growth, with opportunities for brands that prioritize sustainability, personalization, and superior product performance.
Self-tanning Lotion Segmentation
-
1. Application
- 1.1. Supermarket
- 1.2. Specialty Store
- 1.3. Online Sales
- 1.4. Other
-
2. Types
- 2.1. Gradual Tanning Lotion
- 2.2. Instant Tanning Lotion
Self-tanning Lotion Segmentation By Geography
-
1. North America
- 1.1. United States
- 1.2. Canada
- 1.3. Mexico
-
2. South America
- 2.1. Brazil
- 2.2. Argentina
- 2.3. Rest of South America
-
3. Europe
- 3.1. United Kingdom
- 3.2. Germany
- 3.3. France
- 3.4. Italy
- 3.5. Spain
- 3.6. Russia
- 3.7. Benelux
- 3.8. Nordics
- 3.9. Rest of Europe
-
4. Middle East & Africa
- 4.1. Turkey
- 4.2. Israel
- 4.3. GCC
- 4.4. North Africa
- 4.5. South Africa
- 4.6. Rest of Middle East & Africa
-
5. Asia Pacific
- 5.1. China
- 5.2. India
- 5.3. Japan
- 5.4. South Korea
- 5.5. ASEAN
- 5.6. Oceania
- 5.7. Rest of Asia Pacific
Self-tanning Lotion Regional Market Share
Geographic Coverage of Self-tanning Lotion
Self-tanning Lotion REPORT HIGHLIGHTS
| Aspects | Details |
|---|---|
| Study Period | 2020-2034 |
| Base Year | 2025 |
| Estimated Year | 2026 |
| Forecast Period | 2026-2034 |
| Historical Period | 2020-2025 |
| Growth Rate | CAGR of XX% from 2020-2034 |
| Segmentation |
|
Table of Contents
- 1. Introduction
- 1.1. Research Scope
- 1.2. Market Segmentation
- 1.3. Research Methodology
- 1.4. Definitions and Assumptions
- 2. Executive Summary
- 2.1. Introduction
- 3. Market Dynamics
- 3.1. Introduction
- 3.2. Market Drivers
- 3.3. Market Restrains
- 3.4. Market Trends
- 4. Market Factor Analysis
- 4.1. Porters Five Forces
- 4.2. Supply/Value Chain
- 4.3. PESTEL analysis
- 4.4. Market Entropy
- 4.5. Patent/Trademark Analysis
- 5. Global Self-tanning Lotion Analysis, Insights and Forecast, 2020-2032
- 5.1. Market Analysis, Insights and Forecast - by Application
- 5.1.1. Supermarket
- 5.1.2. Specialty Store
- 5.1.3. Online Sales
- 5.1.4. Other
- 5.2. Market Analysis, Insights and Forecast - by Types
- 5.2.1. Gradual Tanning Lotion
- 5.2.2. Instant Tanning Lotion
- 5.3. Market Analysis, Insights and Forecast - by Region
- 5.3.1. North America
- 5.3.2. South America
- 5.3.3. Europe
- 5.3.4. Middle East & Africa
- 5.3.5. Asia Pacific
- 5.1. Market Analysis, Insights and Forecast - by Application
- 6. North America Self-tanning Lotion Analysis, Insights and Forecast, 2020-2032
- 6.1. Market Analysis, Insights and Forecast - by Application
- 6.1.1. Supermarket
- 6.1.2. Specialty Store
- 6.1.3. Online Sales
- 6.1.4. Other
- 6.2. Market Analysis, Insights and Forecast - by Types
- 6.2.1. Gradual Tanning Lotion
- 6.2.2. Instant Tanning Lotion
- 6.1. Market Analysis, Insights and Forecast - by Application
- 7. South America Self-tanning Lotion Analysis, Insights and Forecast, 2020-2032
- 7.1. Market Analysis, Insights and Forecast - by Application
- 7.1.1. Supermarket
- 7.1.2. Specialty Store
- 7.1.3. Online Sales
- 7.1.4. Other
- 7.2. Market Analysis, Insights and Forecast - by Types
- 7.2.1. Gradual Tanning Lotion
- 7.2.2. Instant Tanning Lotion
- 7.1. Market Analysis, Insights and Forecast - by Application
- 8. Europe Self-tanning Lotion Analysis, Insights and Forecast, 2020-2032
- 8.1. Market Analysis, Insights and Forecast - by Application
- 8.1.1. Supermarket
- 8.1.2. Specialty Store
- 8.1.3. Online Sales
- 8.1.4. Other
- 8.2. Market Analysis, Insights and Forecast - by Types
- 8.2.1. Gradual Tanning Lotion
- 8.2.2. Instant Tanning Lotion
- 8.1. Market Analysis, Insights and Forecast - by Application
- 9. Middle East & Africa Self-tanning Lotion Analysis, Insights and Forecast, 2020-2032
- 9.1. Market Analysis, Insights and Forecast - by Application
- 9.1.1. Supermarket
- 9.1.2. Specialty Store
- 9.1.3. Online Sales
- 9.1.4. Other
- 9.2. Market Analysis, Insights and Forecast - by Types
- 9.2.1. Gradual Tanning Lotion
- 9.2.2. Instant Tanning Lotion
- 9.1. Market Analysis, Insights and Forecast - by Application
- 10. Asia Pacific Self-tanning Lotion Analysis, Insights and Forecast, 2020-2032
- 10.1. Market Analysis, Insights and Forecast - by Application
- 10.1.1. Supermarket
- 10.1.2. Specialty Store
- 10.1.3. Online Sales
- 10.1.4. Other
- 10.2. Market Analysis, Insights and Forecast - by Types
- 10.2.1. Gradual Tanning Lotion
- 10.2.2. Instant Tanning Lotion
- 10.1. Market Analysis, Insights and Forecast - by Application
- 11. Competitive Analysis
- 11.1. Global Market Share Analysis 2025
- 11.2. Company Profiles
- 11.2.1 St. Tropez
- 11.2.1.1. Overview
- 11.2.1.2. Products
- 11.2.1.3. SWOT Analysis
- 11.2.1.4. Recent Developments
- 11.2.1.5. Financials (Based on Availability)
- 11.2.2 Bondi Sands
- 11.2.2.1. Overview
- 11.2.2.2. Products
- 11.2.2.3. SWOT Analysis
- 11.2.2.4. Recent Developments
- 11.2.2.5. Financials (Based on Availability)
- 11.2.3 Jergens
- 11.2.3.1. Overview
- 11.2.3.2. Products
- 11.2.3.3. SWOT Analysis
- 11.2.3.4. Recent Developments
- 11.2.3.5. Financials (Based on Availability)
- 11.2.4 Loving Tan
- 11.2.4.1. Overview
- 11.2.4.2. Products
- 11.2.4.3. SWOT Analysis
- 11.2.4.4. Recent Developments
- 11.2.4.5. Financials (Based on Availability)
- 11.2.5 Fake Bake
- 11.2.5.1. Overview
- 11.2.5.2. Products
- 11.2.5.3. SWOT Analysis
- 11.2.5.4. Recent Developments
- 11.2.5.5. Financials (Based on Availability)
- 11.2.6 Tan-Luxe
- 11.2.6.1. Overview
- 11.2.6.2. Products
- 11.2.6.3. SWOT Analysis
- 11.2.6.4. Recent Developments
- 11.2.6.5. Financials (Based on Availability)
- 11.2.7 Vita Liberata
- 11.2.7.1. Overview
- 11.2.7.2. Products
- 11.2.7.3. SWOT Analysis
- 11.2.7.4. Recent Developments
- 11.2.7.5. Financials (Based on Availability)
- 11.2.8 Isle of Paradise
- 11.2.8.1. Overview
- 11.2.8.2. Products
- 11.2.8.3. SWOT Analysis
- 11.2.8.4. Recent Developments
- 11.2.8.5. Financials (Based on Availability)
- 11.2.9 Maui Babe
- 11.2.9.1. Overview
- 11.2.9.2. Products
- 11.2.9.3. SWOT Analysis
- 11.2.9.4. Recent Developments
- 11.2.9.5. Financials (Based on Availability)
- 11.2.10 Australian Gold
- 11.2.10.1. Overview
- 11.2.10.2. Products
- 11.2.10.3. SWOT Analysis
- 11.2.10.4. Recent Developments
- 11.2.10.5. Financials (Based on Availability)
- 11.2.1 St. Tropez
List of Figures
- Figure 1: Global Self-tanning Lotion Revenue Breakdown (million, %) by Region 2025 & 2033
- Figure 2: Global Self-tanning Lotion Volume Breakdown (K, %) by Region 2025 & 2033
- Figure 3: North America Self-tanning Lotion Revenue (million), by Application 2025 & 2033
- Figure 4: North America Self-tanning Lotion Volume (K), by Application 2025 & 2033
- Figure 5: North America Self-tanning Lotion Revenue Share (%), by Application 2025 & 2033
- Figure 6: North America Self-tanning Lotion Volume Share (%), by Application 2025 & 2033
- Figure 7: North America Self-tanning Lotion Revenue (million), by Types 2025 & 2033
- Figure 8: North America Self-tanning Lotion Volume (K), by Types 2025 & 2033
- Figure 9: North America Self-tanning Lotion Revenue Share (%), by Types 2025 & 2033
- Figure 10: North America Self-tanning Lotion Volume Share (%), by Types 2025 & 2033
- Figure 11: North America Self-tanning Lotion Revenue (million), by Country 2025 & 2033
- Figure 12: North America Self-tanning Lotion Volume (K), by Country 2025 & 2033
- Figure 13: North America Self-tanning Lotion Revenue Share (%), by Country 2025 & 2033
- Figure 14: North America Self-tanning Lotion Volume Share (%), by Country 2025 & 2033
- Figure 15: South America Self-tanning Lotion Revenue (million), by Application 2025 & 2033
- Figure 16: South America Self-tanning Lotion Volume (K), by Application 2025 & 2033
- Figure 17: South America Self-tanning Lotion Revenue Share (%), by Application 2025 & 2033
- Figure 18: South America Self-tanning Lotion Volume Share (%), by Application 2025 & 2033
- Figure 19: South America Self-tanning Lotion Revenue (million), by Types 2025 & 2033
- Figure 20: South America Self-tanning Lotion Volume (K), by Types 2025 & 2033
- Figure 21: South America Self-tanning Lotion Revenue Share (%), by Types 2025 & 2033
- Figure 22: South America Self-tanning Lotion Volume Share (%), by Types 2025 & 2033
- Figure 23: South America Self-tanning Lotion Revenue (million), by Country 2025 & 2033
- Figure 24: South America Self-tanning Lotion Volume (K), by Country 2025 & 2033
- Figure 25: South America Self-tanning Lotion Revenue Share (%), by Country 2025 & 2033
- Figure 26: South America Self-tanning Lotion Volume Share (%), by Country 2025 & 2033
- Figure 27: Europe Self-tanning Lotion Revenue (million), by Application 2025 & 2033
- Figure 28: Europe Self-tanning Lotion Volume (K), by Application 2025 & 2033
- Figure 29: Europe Self-tanning Lotion Revenue Share (%), by Application 2025 & 2033
- Figure 30: Europe Self-tanning Lotion Volume Share (%), by Application 2025 & 2033
- Figure 31: Europe Self-tanning Lotion Revenue (million), by Types 2025 & 2033
- Figure 32: Europe Self-tanning Lotion Volume (K), by Types 2025 & 2033
- Figure 33: Europe Self-tanning Lotion Revenue Share (%), by Types 2025 & 2033
- Figure 34: Europe Self-tanning Lotion Volume Share (%), by Types 2025 & 2033
- Figure 35: Europe Self-tanning Lotion Revenue (million), by Country 2025 & 2033
- Figure 36: Europe Self-tanning Lotion Volume (K), by Country 2025 & 2033
- Figure 37: Europe Self-tanning Lotion Revenue Share (%), by Country 2025 & 2033
- Figure 38: Europe Self-tanning Lotion Volume Share (%), by Country 2025 & 2033
- Figure 39: Middle East & Africa Self-tanning Lotion Revenue (million), by Application 2025 & 2033
- Figure 40: Middle East & Africa Self-tanning Lotion Volume (K), by Application 2025 & 2033
- Figure 41: Middle East & Africa Self-tanning Lotion Revenue Share (%), by Application 2025 & 2033
- Figure 42: Middle East & Africa Self-tanning Lotion Volume Share (%), by Application 2025 & 2033
- Figure 43: Middle East & Africa Self-tanning Lotion Revenue (million), by Types 2025 & 2033
- Figure 44: Middle East & Africa Self-tanning Lotion Volume (K), by Types 2025 & 2033
- Figure 45: Middle East & Africa Self-tanning Lotion Revenue Share (%), by Types 2025 & 2033
- Figure 46: Middle East & Africa Self-tanning Lotion Volume Share (%), by Types 2025 & 2033
- Figure 47: Middle East & Africa Self-tanning Lotion Revenue (million), by Country 2025 & 2033
- Figure 48: Middle East & Africa Self-tanning Lotion Volume (K), by Country 2025 & 2033
- Figure 49: Middle East & Africa Self-tanning Lotion Revenue Share (%), by Country 2025 & 2033
- Figure 50: Middle East & Africa Self-tanning Lotion Volume Share (%), by Country 2025 & 2033
- Figure 51: Asia Pacific Self-tanning Lotion Revenue (million), by Application 2025 & 2033
- Figure 52: Asia Pacific Self-tanning Lotion Volume (K), by Application 2025 & 2033
- Figure 53: Asia Pacific Self-tanning Lotion Revenue Share (%), by Application 2025 & 2033
- Figure 54: Asia Pacific Self-tanning Lotion Volume Share (%), by Application 2025 & 2033
- Figure 55: Asia Pacific Self-tanning Lotion Revenue (million), by Types 2025 & 2033
- Figure 56: Asia Pacific Self-tanning Lotion Volume (K), by Types 2025 & 2033
- Figure 57: Asia Pacific Self-tanning Lotion Revenue Share (%), by Types 2025 & 2033
- Figure 58: Asia Pacific Self-tanning Lotion Volume Share (%), by Types 2025 & 2033
- Figure 59: Asia Pacific Self-tanning Lotion Revenue (million), by Country 2025 & 2033
- Figure 60: Asia Pacific Self-tanning Lotion Volume (K), by Country 2025 & 2033
- Figure 61: Asia Pacific Self-tanning Lotion Revenue Share (%), by Country 2025 & 2033
- Figure 62: Asia Pacific Self-tanning Lotion Volume Share (%), by Country 2025 & 2033
List of Tables
- Table 1: Global Self-tanning Lotion Revenue million Forecast, by Application 2020 & 2033
- Table 2: Global Self-tanning Lotion Volume K Forecast, by Application 2020 & 2033
- Table 3: Global Self-tanning Lotion Revenue million Forecast, by Types 2020 & 2033
- Table 4: Global Self-tanning Lotion Volume K Forecast, by Types 2020 & 2033
- Table 5: Global Self-tanning Lotion Revenue million Forecast, by Region 2020 & 2033
- Table 6: Global Self-tanning Lotion Volume K Forecast, by Region 2020 & 2033
- Table 7: Global Self-tanning Lotion Revenue million Forecast, by Application 2020 & 2033
- Table 8: Global Self-tanning Lotion Volume K Forecast, by Application 2020 & 2033
- Table 9: Global Self-tanning Lotion Revenue million Forecast, by Types 2020 & 2033
- Table 10: Global Self-tanning Lotion Volume K Forecast, by Types 2020 & 2033
- Table 11: Global Self-tanning Lotion Revenue million Forecast, by Country 2020 & 2033
- Table 12: Global Self-tanning Lotion Volume K Forecast, by Country 2020 & 2033
- Table 13: United States Self-tanning Lotion Revenue (million) Forecast, by Application 2020 & 2033
- Table 14: United States Self-tanning Lotion Volume (K) Forecast, by Application 2020 & 2033
- Table 15: Canada Self-tanning Lotion Revenue (million) Forecast, by Application 2020 & 2033
- Table 16: Canada Self-tanning Lotion Volume (K) Forecast, by Application 2020 & 2033
- Table 17: Mexico Self-tanning Lotion Revenue (million) Forecast, by Application 2020 & 2033
- Table 18: Mexico Self-tanning Lotion Volume (K) Forecast, by Application 2020 & 2033
- Table 19: Global Self-tanning Lotion Revenue million Forecast, by Application 2020 & 2033
- Table 20: Global Self-tanning Lotion Volume K Forecast, by Application 2020 & 2033
- Table 21: Global Self-tanning Lotion Revenue million Forecast, by Types 2020 & 2033
- Table 22: Global Self-tanning Lotion Volume K Forecast, by Types 2020 & 2033
- Table 23: Global Self-tanning Lotion Revenue million Forecast, by Country 2020 & 2033
- Table 24: Global Self-tanning Lotion Volume K Forecast, by Country 2020 & 2033
- Table 25: Brazil Self-tanning Lotion Revenue (million) Forecast, by Application 2020 & 2033
- Table 26: Brazil Self-tanning Lotion Volume (K) Forecast, by Application 2020 & 2033
- Table 27: Argentina Self-tanning Lotion Revenue (million) Forecast, by Application 2020 & 2033
- Table 28: Argentina Self-tanning Lotion Volume (K) Forecast, by Application 2020 & 2033
- Table 29: Rest of South America Self-tanning Lotion Revenue (million) Forecast, by Application 2020 & 2033
- Table 30: Rest of South America Self-tanning Lotion Volume (K) Forecast, by Application 2020 & 2033
- Table 31: Global Self-tanning Lotion Revenue million Forecast, by Application 2020 & 2033
- Table 32: Global Self-tanning Lotion Volume K Forecast, by Application 2020 & 2033
- Table 33: Global Self-tanning Lotion Revenue million Forecast, by Types 2020 & 2033
- Table 34: Global Self-tanning Lotion Volume K Forecast, by Types 2020 & 2033
- Table 35: Global Self-tanning Lotion Revenue million Forecast, by Country 2020 & 2033
- Table 36: Global Self-tanning Lotion Volume K Forecast, by Country 2020 & 2033
- Table 37: United Kingdom Self-tanning Lotion Revenue (million) Forecast, by Application 2020 & 2033
- Table 38: United Kingdom Self-tanning Lotion Volume (K) Forecast, by Application 2020 & 2033
- Table 39: Germany Self-tanning Lotion Revenue (million) Forecast, by Application 2020 & 2033
- Table 40: Germany Self-tanning Lotion Volume (K) Forecast, by Application 2020 & 2033
- Table 41: France Self-tanning Lotion Revenue (million) Forecast, by Application 2020 & 2033
- Table 42: France Self-tanning Lotion Volume (K) Forecast, by Application 2020 & 2033
- Table 43: Italy Self-tanning Lotion Revenue (million) Forecast, by Application 2020 & 2033
- Table 44: Italy Self-tanning Lotion Volume (K) Forecast, by Application 2020 & 2033
- Table 45: Spain Self-tanning Lotion Revenue (million) Forecast, by Application 2020 & 2033
- Table 46: Spain Self-tanning Lotion Volume (K) Forecast, by Application 2020 & 2033
- Table 47: Russia Self-tanning Lotion Revenue (million) Forecast, by Application 2020 & 2033
- Table 48: Russia Self-tanning Lotion Volume (K) Forecast, by Application 2020 & 2033
- Table 49: Benelux Self-tanning Lotion Revenue (million) Forecast, by Application 2020 & 2033
- Table 50: Benelux Self-tanning Lotion Volume (K) Forecast, by Application 2020 & 2033
- Table 51: Nordics Self-tanning Lotion Revenue (million) Forecast, by Application 2020 & 2033
- Table 52: Nordics Self-tanning Lotion Volume (K) Forecast, by Application 2020 & 2033
- Table 53: Rest of Europe Self-tanning Lotion Revenue (million) Forecast, by Application 2020 & 2033
- Table 54: Rest of Europe Self-tanning Lotion Volume (K) Forecast, by Application 2020 & 2033
- Table 55: Global Self-tanning Lotion Revenue million Forecast, by Application 2020 & 2033
- Table 56: Global Self-tanning Lotion Volume K Forecast, by Application 2020 & 2033
- Table 57: Global Self-tanning Lotion Revenue million Forecast, by Types 2020 & 2033
- Table 58: Global Self-tanning Lotion Volume K Forecast, by Types 2020 & 2033
- Table 59: Global Self-tanning Lotion Revenue million Forecast, by Country 2020 & 2033
- Table 60: Global Self-tanning Lotion Volume K Forecast, by Country 2020 & 2033
- Table 61: Turkey Self-tanning Lotion Revenue (million) Forecast, by Application 2020 & 2033
- Table 62: Turkey Self-tanning Lotion Volume (K) Forecast, by Application 2020 & 2033
- Table 63: Israel Self-tanning Lotion Revenue (million) Forecast, by Application 2020 & 2033
- Table 64: Israel Self-tanning Lotion Volume (K) Forecast, by Application 2020 & 2033
- Table 65: GCC Self-tanning Lotion Revenue (million) Forecast, by Application 2020 & 2033
- Table 66: GCC Self-tanning Lotion Volume (K) Forecast, by Application 2020 & 2033
- Table 67: North Africa Self-tanning Lotion Revenue (million) Forecast, by Application 2020 & 2033
- Table 68: North Africa Self-tanning Lotion Volume (K) Forecast, by Application 2020 & 2033
- Table 69: South Africa Self-tanning Lotion Revenue (million) Forecast, by Application 2020 & 2033
- Table 70: South Africa Self-tanning Lotion Volume (K) Forecast, by Application 2020 & 2033
- Table 71: Rest of Middle East & Africa Self-tanning Lotion Revenue (million) Forecast, by Application 2020 & 2033
- Table 72: Rest of Middle East & Africa Self-tanning Lotion Volume (K) Forecast, by Application 2020 & 2033
- Table 73: Global Self-tanning Lotion Revenue million Forecast, by Application 2020 & 2033
- Table 74: Global Self-tanning Lotion Volume K Forecast, by Application 2020 & 2033
- Table 75: Global Self-tanning Lotion Revenue million Forecast, by Types 2020 & 2033
- Table 76: Global Self-tanning Lotion Volume K Forecast, by Types 2020 & 2033
- Table 77: Global Self-tanning Lotion Revenue million Forecast, by Country 2020 & 2033
- Table 78: Global Self-tanning Lotion Volume K Forecast, by Country 2020 & 2033
- Table 79: China Self-tanning Lotion Revenue (million) Forecast, by Application 2020 & 2033
- Table 80: China Self-tanning Lotion Volume (K) Forecast, by Application 2020 & 2033
- Table 81: India Self-tanning Lotion Revenue (million) Forecast, by Application 2020 & 2033
- Table 82: India Self-tanning Lotion Volume (K) Forecast, by Application 2020 & 2033
- Table 83: Japan Self-tanning Lotion Revenue (million) Forecast, by Application 2020 & 2033
- Table 84: Japan Self-tanning Lotion Volume (K) Forecast, by Application 2020 & 2033
- Table 85: South Korea Self-tanning Lotion Revenue (million) Forecast, by Application 2020 & 2033
- Table 86: South Korea Self-tanning Lotion Volume (K) Forecast, by Application 2020 & 2033
- Table 87: ASEAN Self-tanning Lotion Revenue (million) Forecast, by Application 2020 & 2033
- Table 88: ASEAN Self-tanning Lotion Volume (K) Forecast, by Application 2020 & 2033
- Table 89: Oceania Self-tanning Lotion Revenue (million) Forecast, by Application 2020 & 2033
- Table 90: Oceania Self-tanning Lotion Volume (K) Forecast, by Application 2020 & 2033
- Table 91: Rest of Asia Pacific Self-tanning Lotion Revenue (million) Forecast, by Application 2020 & 2033
- Table 92: Rest of Asia Pacific Self-tanning Lotion Volume (K) Forecast, by Application 2020 & 2033
Frequently Asked Questions
1. What is the projected Compound Annual Growth Rate (CAGR) of the Self-tanning Lotion?
The projected CAGR is approximately XX%.
2. Which companies are prominent players in the Self-tanning Lotion?
Key companies in the market include St. Tropez, Bondi Sands, Jergens, Loving Tan, Fake Bake, Tan-Luxe, Vita Liberata, Isle of Paradise, Maui Babe, Australian Gold.
3. What are the main segments of the Self-tanning Lotion?
The market segments include Application, Types.
4. Can you provide details about the market size?
The market size is estimated to be USD XXX million as of 2022.
5. What are some drivers contributing to market growth?
N/A
6. What are the notable trends driving market growth?
N/A
7. Are there any restraints impacting market growth?
N/A
8. Can you provide examples of recent developments in the market?
N/A
9. What pricing options are available for accessing the report?
Pricing options include single-user, multi-user, and enterprise licenses priced at USD 3350.00, USD 5025.00, and USD 6700.00 respectively.
10. Is the market size provided in terms of value or volume?
The market size is provided in terms of value, measured in million and volume, measured in K.
11. Are there any specific market keywords associated with the report?
Yes, the market keyword associated with the report is "Self-tanning Lotion," which aids in identifying and referencing the specific market segment covered.
12. How do I determine which pricing option suits my needs best?
The pricing options vary based on user requirements and access needs. Individual users may opt for single-user licenses, while businesses requiring broader access may choose multi-user or enterprise licenses for cost-effective access to the report.
13. Are there any additional resources or data provided in the Self-tanning Lotion report?
While the report offers comprehensive insights, it's advisable to review the specific contents or supplementary materials provided to ascertain if additional resources or data are available.
14. How can I stay updated on further developments or reports in the Self-tanning Lotion?
To stay informed about further developments, trends, and reports in the Self-tanning Lotion, consider subscribing to industry newsletters, following relevant companies and organizations, or regularly checking reputable industry news sources and publications.
Methodology
Step 1 - Identification of Relevant Samples Size from Population Database


Step 2 - Approaches for Defining Global Market Size (Value, Volume* & Price*)

Note*: In applicable scenarios
Step 3 - Data Sources
Primary Research
- Web Analytics
- Survey Reports
- Research Institute
- Latest Research Reports
- Opinion Leaders
Secondary Research
- Annual Reports
- White Paper
- Latest Press Release
- Industry Association
- Paid Database
- Investor Presentations

Step 4 - Data Triangulation
Involves using different sources of information in order to increase the validity of a study
These sources are likely to be stakeholders in a program - participants, other researchers, program staff, other community members, and so on.
Then we put all data in single framework & apply various statistical tools to find out the dynamic on the market.
During the analysis stage, feedback from the stakeholder groups would be compared to determine areas of agreement as well as areas of divergence