

Key Insights
The Security Policy Management Solutions market is poised for significant expansion, projected to reach $8.63 billion in 2025. This robust growth is underpinned by a compelling Compound Annual Growth Rate (CAGR) of 9.6%, indicating a sustained upward trajectory expected to continue through 2033. The primary drivers propelling this market include the escalating complexity of modern IT infrastructures, the pervasive threat landscape characterized by increasingly sophisticated cyberattacks, and the stringent regulatory compliance mandates across various industries. Organizations are recognizing that effective security policy management is no longer a discretionary expense but a critical component of their overall risk mitigation strategy. This is particularly evident in sectors like Transportation, Retail, and Telecom & IT, where digital transformation initiatives and the proliferation of connected devices create larger attack surfaces. The increasing adoption of cloud-based solutions further fuels this growth, offering scalability, flexibility, and cost-efficiency compared to traditional on-premise deployments. Key industry players like Google, Amazon, and Cisco are at the forefront, innovating and offering comprehensive solutions to address these evolving needs.
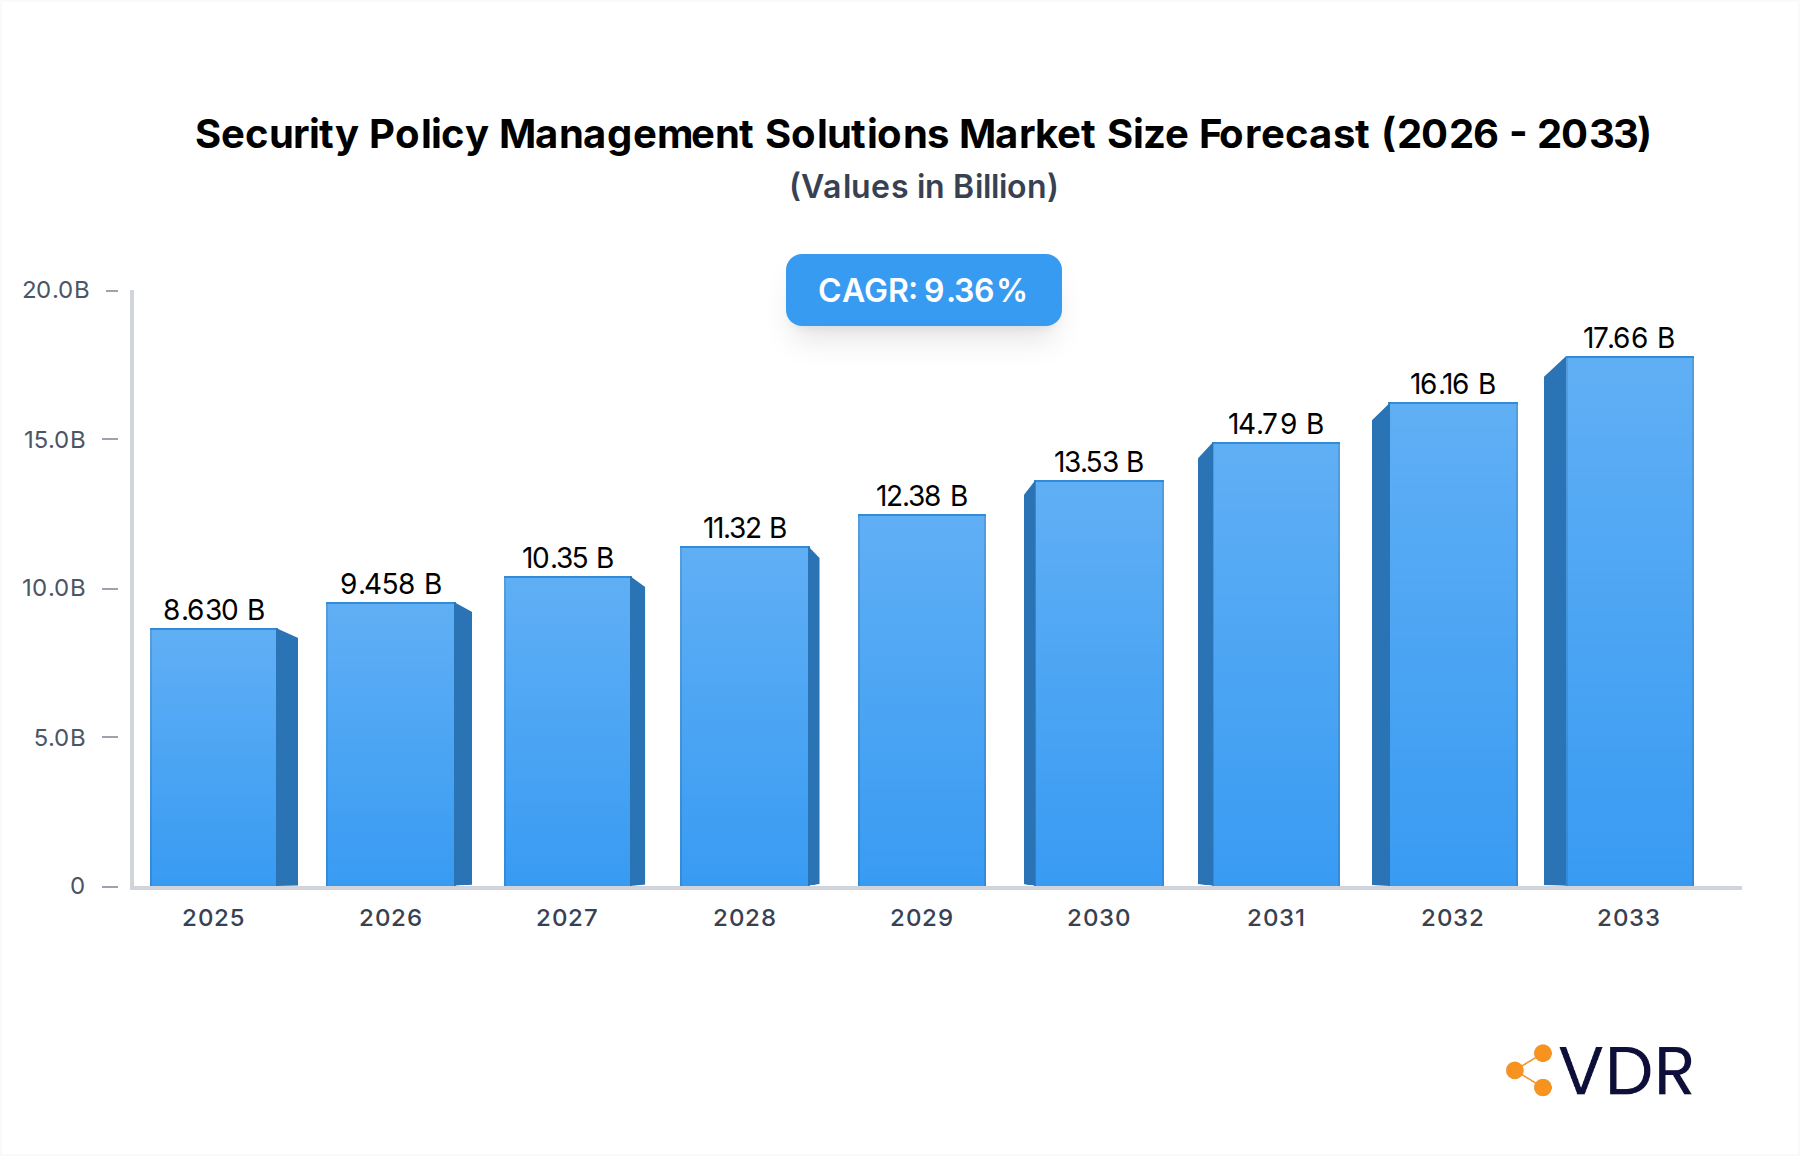
Security Policy Management Solutions Market Size (In Billion)
The market is also influenced by several key trends. The shift towards automated policy orchestration and continuous compliance monitoring is gaining momentum, driven by the need for real-time threat detection and response. Furthermore, the integration of Security Policy Management with broader Security Operations (SecOps) platforms is becoming a standard practice, enabling a more holistic and unified approach to cybersecurity. However, the market faces certain restraints. The significant upfront investment required for comprehensive policy management systems, coupled with the scarcity of skilled cybersecurity professionals to manage these complex solutions, can pose challenges for some organizations, particularly small and medium-sized businesses. Despite these challenges, the overarching imperative for robust data protection and regulatory adherence ensures a strong demand for advanced Security Policy Management solutions globally, with North America and Europe currently leading adoption due to mature cybersecurity ecosystems and stringent data privacy laws.

Security Policy Management Solutions Company Market Share
Security Policy Management Solutions Market Dynamics & Structure
The global Security Policy Management Solutions market is characterized by a moderately concentrated landscape, driven by escalating cybersecurity threats and the imperative for robust compliance. Major players like Google, Amazon, Cisco, and Check Point command significant market share, fostering innovation through substantial R&D investments. The primary driver for technological innovation lies in the increasing sophistication of cyberattacks, necessitating advanced, automated policy enforcement. Regulatory frameworks, such as GDPR and CCPA, are also pivotal, compelling organizations to adopt comprehensive security policy management to ensure data privacy and mitigate compliance risks. Competitive product substitutes are emerging, including integrated security platforms and managed security services, but dedicated security policy management solutions offer specialized functionalities crucial for complex IT environments. End-user demographics span across large enterprises in highly regulated sectors like Finance and Healthcare, as well as burgeoning small and medium-sized businesses (SMBs) seeking scalable and cost-effective solutions. Mergers and acquisitions (M&A) are a significant trend, with larger vendors acquiring specialized firms to broaden their product portfolios and expand their market reach. For instance, the acquisition of smaller policy orchestration startups by established security giants has been observed, aiming to integrate advanced automation capabilities.
- Market Concentration: Dominated by a few key players, with increasing fragmentation as specialized vendors emerge.
- Technological Innovation Drivers: Rising cyber threats, AI/ML integration for threat detection, and automation of policy enforcement.
- Regulatory Frameworks: GDPR, CCPA, HIPAA, and industry-specific regulations are major adoption drivers.
- Competitive Product Substitutes: Integrated security platforms, XDR solutions, and managed security service providers (MSSPs).
- End-User Demographics: Large enterprises in Finance, Healthcare, Government, and SMBs across all sectors.
- M&A Trends: Strategic acquisitions to enhance product offerings and market presence are prevalent.
Security Policy Management Solutions Growth Trends & Insights
The Security Policy Management Solutions market is poised for substantial growth, projected to reach a valuation of $18.5 billion by 2025 and expand to an impressive $35.2 billion by 2033. This upward trajectory is fueled by an estimated Compound Annual Growth Rate (CAGR) of 6.7% during the forecast period of 2025–2033. The historical period from 2019–2024 witnessed steady adoption, with the market size evolving from $11.2 billion to $16.8 billion, laying a strong foundation for future expansion. Adoption rates are accelerating as organizations recognize the critical role of centralized policy management in navigating complex compliance landscapes and defending against evolving cyber threats. Technological disruptions, such as the integration of artificial intelligence (AI) and machine learning (ML) for automated policy optimization and anomaly detection, are reshaping the market. Cloud-based solutions are experiencing particularly rapid growth, driven by their scalability, flexibility, and cost-effectiveness, a trend that is significantly influencing consumer behavior towards subscription-based security models. The increasing prevalence of remote work and hybrid environments further necessitates dynamic and adaptable security policies, pushing demand for advanced management solutions. As businesses grapple with expanding attack surfaces and the ever-present risk of data breaches, the proactive and systematic approach offered by security policy management solutions is becoming indispensable for maintaining operational continuity and protecting sensitive information. The growing sophistication of cyber warfare and state-sponsored attacks also compels organizations to bolster their defenses through meticulously managed security policies, ensuring alignment with evolving threat intelligence.
Dominant Regions, Countries, or Segments in Security Policy Management Solutions
North America currently leads the global Security Policy Management Solutions market, driven by a mature cybersecurity ecosystem, stringent regulatory mandates like HIPAA and PCI DSS, and a high concentration of enterprises across critical sectors such as Finance, Healthcare, and Technology. The United States, in particular, represents a significant portion of this dominance, with a substantial market share estimated at 38.7% of the global market in 2025. The region's robust adoption of advanced technologies and a proactive stance on cybersecurity compliance are key growth accelerators. Cloud-based security policy management solutions are experiencing remarkable traction in North America, accounting for approximately 72% of the market revenue in this region, a trend further amplified by the widespread adoption of cloud infrastructure by businesses of all sizes.
The Asia Pacific region is emerging as the fastest-growing market, with a projected CAGR of 7.9% for the forecast period. Rapid digital transformation, increasing cybersecurity awareness, and the growing number of SMBs in countries like India and China are fueling this expansion. The Telecom & IT sector is a major contributor to market growth globally, driven by the sector's inherent need for secure and resilient networks. In 2025, the Telecom & IT segment is anticipated to hold a market share of 27.5%. The Retail sector, while facing significant data security challenges due to customer data handling, is also a key segment, projected to account for 18.2% of the market. The Transportation sector, with its increasing reliance on connected systems and IoT devices, presents a growing opportunity, expected to contribute 11.8%.
The shift towards cloud-based solutions is a universal trend, but its impact is particularly pronounced in regions with rapidly expanding IT infrastructure and a strong demand for scalable and agile security solutions. While on-premise solutions continue to cater to specific legacy requirements and highly sensitive environments, the market share of cloud-based solutions is expected to surpass 65% by 2027, driven by their inherent advantages in deployment flexibility, continuous updates, and cost-efficiency. The 'Others' segment, encompassing diverse industries like Manufacturing, Energy, and Education, is also demonstrating significant growth, highlighting the pervasive need for robust security policy management across the entire economic spectrum.
Security Policy Management Solutions Product Landscape
The product landscape for Security Policy Management Solutions is defined by continuous innovation focused on automation, intelligence, and integration. Solutions are increasingly incorporating AI and ML to enable proactive threat detection, automated policy remediation, and intelligent risk assessment. Key product advancements include sophisticated dashboards for centralized policy visibility, real-time compliance monitoring, and granular control over network access. Performance metrics are centered on reducing policy violation rates, minimizing the attack surface, and ensuring seamless compliance with evolving regulatory standards. Unique selling propositions often lie in the ability to integrate with a wide array of existing security tools and infrastructure, providing a unified view and consistent policy enforcement across diverse environments, from on-premise data centers to multi-cloud deployments.
Key Drivers, Barriers & Challenges in Security Policy Management Solutions
Key Drivers:
- Escalating Cybersecurity Threats: The increasing volume and sophistication of cyberattacks necessitate robust and adaptable security policies.
- Stringent Regulatory Compliance: Growing mandates like GDPR, CCPA, and industry-specific regulations compel organizations to implement comprehensive policy management.
- Digital Transformation & Cloud Adoption: The migration of data and applications to cloud environments creates complex security policy management challenges.
- IoT and Remote Work Expansion: The proliferation of connected devices and remote workforces expands the attack surface, requiring dynamic policy enforcement.
- Need for Automation: The demand for automated policy creation, deployment, and enforcement to reduce human error and improve efficiency.
Barriers & Challenges:
- Complexity of Existing Infrastructure: Integrating new solutions with legacy systems and diverse security tools can be challenging.
- Skill Gap: A shortage of skilled cybersecurity professionals capable of effectively managing and implementing advanced policy solutions.
- Cost of Implementation and Maintenance: Initial investment and ongoing operational costs can be a deterrent for smaller organizations.
- Vendor Lock-in Concerns: Organizations may be wary of becoming overly dependent on a single vendor's solutions.
- Resistance to Change: Organizational inertia and resistance to adopting new security practices and technologies.
Emerging Opportunities in Security Policy Management Solutions
Emerging opportunities in the Security Policy Management Solutions market are centered on the growing demand for AI-driven policy automation, enhanced threat intelligence integration, and specialized solutions for emerging technologies. The increasing adoption of DevSecOps practices presents a significant avenue for integrating policy management earlier in the development lifecycle. Furthermore, the need for granular policy enforcement in complex multi-cloud and hybrid cloud environments offers substantial growth potential. Untapped markets in developing economies, coupled with the evolution of IoT security requirements, also represent key areas for innovation and expansion. The development of self-healing security policies, capable of automatically adapting to new threats and vulnerabilities, is another exciting frontier.
Growth Accelerators in the Security Policy Management Solutions Industry
Several catalysts are accelerating growth in the Security Policy Management Solutions industry. Technological breakthroughs, particularly in AI and machine learning, are enabling more intelligent and automated policy management. Strategic partnerships between security vendors and cloud providers are streamlining integration and expanding market reach. Furthermore, a growing awareness among businesses about the direct correlation between effective policy management and reduced breach costs is driving proactive investment. The increasing emphasis on proactive security postures and continuous compliance monitoring, rather than reactive incident response, is also a significant growth accelerator. The development of industry-specific policy frameworks tailored to the unique regulatory and threat landscapes of sectors like finance and healthcare is also a key driver.
Key Players Shaping the Security Policy Management Solutions Market
- Amazon
- Cisco
- Check Point
- FireMon
- ForcePoint
- HPE
- SolarWinds
- Juniper Networks
Notable Milestones in Security Policy Management Solutions Sector
- 2019: Increased adoption of cloud-native policy management solutions.
- 2020: Rise of AI and ML integration for automated policy optimization.
- 2021: Intensified focus on compliance automation for GDPR and CCPA.
- 2022: Significant M&A activity as larger players acquire specialized policy management capabilities.
- 2023: Expansion of Security Policy Management Solutions to address IoT and OT security needs.
- 2024: Growing demand for unified policy management across hybrid and multi-cloud environments.
In-Depth Security Policy Management Solutions Market Outlook
The Security Policy Management Solutions market is set for continued robust expansion, driven by an unwavering demand for advanced cybersecurity and regulatory compliance. Future growth will be significantly fueled by the pervasive integration of AI and ML, enabling more sophisticated automation, predictive analytics, and self-adapting policies. The increasing complexity of IT infrastructures, characterized by hybrid, multi-cloud, and edge computing environments, will necessitate more unified and agile policy management frameworks. Strategic partnerships and ecosystem development will play a crucial role in delivering integrated solutions that address the end-to-end security lifecycle. Emerging opportunities in niche sectors and the continued evolution of threat landscapes will ensure sustained innovation and market expansion, positioning Security Policy Management Solutions as an indispensable component of modern enterprise security.
Security Policy Management Solutions Segmentation
-
1. Application
- 1.1. Transportation
- 1.2. Retail
- 1.3. Telecom & IT
- 1.4. Others
-
2. Types
- 2.1. On-premise
- 2.2. Cloud-based
Security Policy Management Solutions Segmentation By Geography
-
1. North America
- 1.1. United States
- 1.2. Canada
- 1.3. Mexico
-
2. South America
- 2.1. Brazil
- 2.2. Argentina
- 2.3. Rest of South America
-
3. Europe
- 3.1. United Kingdom
- 3.2. Germany
- 3.3. France
- 3.4. Italy
- 3.5. Spain
- 3.6. Russia
- 3.7. Benelux
- 3.8. Nordics
- 3.9. Rest of Europe
-
4. Middle East & Africa
- 4.1. Turkey
- 4.2. Israel
- 4.3. GCC
- 4.4. North Africa
- 4.5. South Africa
- 4.6. Rest of Middle East & Africa
-
5. Asia Pacific
- 5.1. China
- 5.2. India
- 5.3. Japan
- 5.4. South Korea
- 5.5. ASEAN
- 5.6. Oceania
- 5.7. Rest of Asia Pacific

Security Policy Management Solutions Regional Market Share
Geographic Coverage of Security Policy Management Solutions
Security Policy Management Solutions REPORT HIGHLIGHTS
| Aspects | Details |
|---|---|
| Study Period | 2020-2034 |
| Base Year | 2025 |
| Estimated Year | 2026 |
| Forecast Period | 2026-2034 |
| Historical Period | 2020-2025 |
| Growth Rate | CAGR of 9.6% from 2020-2034 |
| Segmentation |
|
Table of Contents
- 1. Introduction
- 1.1. Research Scope
- 1.2. Market Segmentation
- 1.3. Research Methodology
- 1.4. Definitions and Assumptions
- 2. Executive Summary
- 2.1. Introduction
- 3. Market Dynamics
- 3.1. Introduction
- 3.2. Market Drivers
- 3.3. Market Restrains
- 3.4. Market Trends
- 4. Market Factor Analysis
- 4.1. Porters Five Forces
- 4.2. Supply/Value Chain
- 4.3. PESTEL analysis
- 4.4. Market Entropy
- 4.5. Patent/Trademark Analysis
- 5. Global Security Policy Management Solutions Analysis, Insights and Forecast, 2020-2032
- 5.1. Market Analysis, Insights and Forecast - by Application
- 5.1.1. Transportation
- 5.1.2. Retail
- 5.1.3. Telecom & IT
- 5.1.4. Others
- 5.2. Market Analysis, Insights and Forecast - by Types
- 5.2.1. On-premise
- 5.2.2. Cloud-based
- 5.3. Market Analysis, Insights and Forecast - by Region
- 5.3.1. North America
- 5.3.2. South America
- 5.3.3. Europe
- 5.3.4. Middle East & Africa
- 5.3.5. Asia Pacific
- 5.1. Market Analysis, Insights and Forecast - by Application
- 6. North America Security Policy Management Solutions Analysis, Insights and Forecast, 2020-2032
- 6.1. Market Analysis, Insights and Forecast - by Application
- 6.1.1. Transportation
- 6.1.2. Retail
- 6.1.3. Telecom & IT
- 6.1.4. Others
- 6.2. Market Analysis, Insights and Forecast - by Types
- 6.2.1. On-premise
- 6.2.2. Cloud-based
- 6.1. Market Analysis, Insights and Forecast - by Application
- 7. South America Security Policy Management Solutions Analysis, Insights and Forecast, 2020-2032
- 7.1. Market Analysis, Insights and Forecast - by Application
- 7.1.1. Transportation
- 7.1.2. Retail
- 7.1.3. Telecom & IT
- 7.1.4. Others
- 7.2. Market Analysis, Insights and Forecast - by Types
- 7.2.1. On-premise
- 7.2.2. Cloud-based
- 7.1. Market Analysis, Insights and Forecast - by Application
- 8. Europe Security Policy Management Solutions Analysis, Insights and Forecast, 2020-2032
- 8.1. Market Analysis, Insights and Forecast - by Application
- 8.1.1. Transportation
- 8.1.2. Retail
- 8.1.3. Telecom & IT
- 8.1.4. Others
- 8.2. Market Analysis, Insights and Forecast - by Types
- 8.2.1. On-premise
- 8.2.2. Cloud-based
- 8.1. Market Analysis, Insights and Forecast - by Application
- 9. Middle East & Africa Security Policy Management Solutions Analysis, Insights and Forecast, 2020-2032
- 9.1. Market Analysis, Insights and Forecast - by Application
- 9.1.1. Transportation
- 9.1.2. Retail
- 9.1.3. Telecom & IT
- 9.1.4. Others
- 9.2. Market Analysis, Insights and Forecast - by Types
- 9.2.1. On-premise
- 9.2.2. Cloud-based
- 9.1. Market Analysis, Insights and Forecast - by Application
- 10. Asia Pacific Security Policy Management Solutions Analysis, Insights and Forecast, 2020-2032
- 10.1. Market Analysis, Insights and Forecast - by Application
- 10.1.1. Transportation
- 10.1.2. Retail
- 10.1.3. Telecom & IT
- 10.1.4. Others
- 10.2. Market Analysis, Insights and Forecast - by Types
- 10.2.1. On-premise
- 10.2.2. Cloud-based
- 10.1. Market Analysis, Insights and Forecast - by Application
- 11. Competitive Analysis
- 11.1. Global Market Share Analysis 2025
- 11.2. Company Profiles
- 11.2.1 Google
- 11.2.1.1. Overview
- 11.2.1.2. Products
- 11.2.1.3. SWOT Analysis
- 11.2.1.4. Recent Developments
- 11.2.1.5. Financials (Based on Availability)
- 11.2.2 Amazon
- 11.2.2.1. Overview
- 11.2.2.2. Products
- 11.2.2.3. SWOT Analysis
- 11.2.2.4. Recent Developments
- 11.2.2.5. Financials (Based on Availability)
- 11.2.3 Cisco
- 11.2.3.1. Overview
- 11.2.3.2. Products
- 11.2.3.3. SWOT Analysis
- 11.2.3.4. Recent Developments
- 11.2.3.5. Financials (Based on Availability)
- 11.2.4 Check Point
- 11.2.4.1. Overview
- 11.2.4.2. Products
- 11.2.4.3. SWOT Analysis
- 11.2.4.4. Recent Developments
- 11.2.4.5. Financials (Based on Availability)
- 11.2.5 FireMon
- 11.2.5.1. Overview
- 11.2.5.2. Products
- 11.2.5.3. SWOT Analysis
- 11.2.5.4. Recent Developments
- 11.2.5.5. Financials (Based on Availability)
- 11.2.6 ForcePoint
- 11.2.6.1. Overview
- 11.2.6.2. Products
- 11.2.6.3. SWOT Analysis
- 11.2.6.4. Recent Developments
- 11.2.6.5. Financials (Based on Availability)
- 11.2.7 HPE
- 11.2.7.1. Overview
- 11.2.7.2. Products
- 11.2.7.3. SWOT Analysis
- 11.2.7.4. Recent Developments
- 11.2.7.5. Financials (Based on Availability)
- 11.2.8 Cisco
- 11.2.8.1. Overview
- 11.2.8.2. Products
- 11.2.8.3. SWOT Analysis
- 11.2.8.4. Recent Developments
- 11.2.8.5. Financials (Based on Availability)
- 11.2.9 Solarwinds
- 11.2.9.1. Overview
- 11.2.9.2. Products
- 11.2.9.3. SWOT Analysis
- 11.2.9.4. Recent Developments
- 11.2.9.5. Financials (Based on Availability)
- 11.2.10 Juniper Nerworks
- 11.2.10.1. Overview
- 11.2.10.2. Products
- 11.2.10.3. SWOT Analysis
- 11.2.10.4. Recent Developments
- 11.2.10.5. Financials (Based on Availability)
- 11.2.1 Google
List of Figures
- Figure 1: Global Security Policy Management Solutions Revenue Breakdown (undefined, %) by Region 2025 & 2033
- Figure 2: North America Security Policy Management Solutions Revenue (undefined), by Application 2025 & 2033
- Figure 3: North America Security Policy Management Solutions Revenue Share (%), by Application 2025 & 2033
- Figure 4: North America Security Policy Management Solutions Revenue (undefined), by Types 2025 & 2033
- Figure 5: North America Security Policy Management Solutions Revenue Share (%), by Types 2025 & 2033
- Figure 6: North America Security Policy Management Solutions Revenue (undefined), by Country 2025 & 2033
- Figure 7: North America Security Policy Management Solutions Revenue Share (%), by Country 2025 & 2033
- Figure 8: South America Security Policy Management Solutions Revenue (undefined), by Application 2025 & 2033
- Figure 9: South America Security Policy Management Solutions Revenue Share (%), by Application 2025 & 2033
- Figure 10: South America Security Policy Management Solutions Revenue (undefined), by Types 2025 & 2033
- Figure 11: South America Security Policy Management Solutions Revenue Share (%), by Types 2025 & 2033
- Figure 12: South America Security Policy Management Solutions Revenue (undefined), by Country 2025 & 2033
- Figure 13: South America Security Policy Management Solutions Revenue Share (%), by Country 2025 & 2033
- Figure 14: Europe Security Policy Management Solutions Revenue (undefined), by Application 2025 & 2033
- Figure 15: Europe Security Policy Management Solutions Revenue Share (%), by Application 2025 & 2033
- Figure 16: Europe Security Policy Management Solutions Revenue (undefined), by Types 2025 & 2033
- Figure 17: Europe Security Policy Management Solutions Revenue Share (%), by Types 2025 & 2033
- Figure 18: Europe Security Policy Management Solutions Revenue (undefined), by Country 2025 & 2033
- Figure 19: Europe Security Policy Management Solutions Revenue Share (%), by Country 2025 & 2033
- Figure 20: Middle East & Africa Security Policy Management Solutions Revenue (undefined), by Application 2025 & 2033
- Figure 21: Middle East & Africa Security Policy Management Solutions Revenue Share (%), by Application 2025 & 2033
- Figure 22: Middle East & Africa Security Policy Management Solutions Revenue (undefined), by Types 2025 & 2033
- Figure 23: Middle East & Africa Security Policy Management Solutions Revenue Share (%), by Types 2025 & 2033
- Figure 24: Middle East & Africa Security Policy Management Solutions Revenue (undefined), by Country 2025 & 2033
- Figure 25: Middle East & Africa Security Policy Management Solutions Revenue Share (%), by Country 2025 & 2033
- Figure 26: Asia Pacific Security Policy Management Solutions Revenue (undefined), by Application 2025 & 2033
- Figure 27: Asia Pacific Security Policy Management Solutions Revenue Share (%), by Application 2025 & 2033
- Figure 28: Asia Pacific Security Policy Management Solutions Revenue (undefined), by Types 2025 & 2033
- Figure 29: Asia Pacific Security Policy Management Solutions Revenue Share (%), by Types 2025 & 2033
- Figure 30: Asia Pacific Security Policy Management Solutions Revenue (undefined), by Country 2025 & 2033
- Figure 31: Asia Pacific Security Policy Management Solutions Revenue Share (%), by Country 2025 & 2033
List of Tables
- Table 1: Global Security Policy Management Solutions Revenue undefined Forecast, by Application 2020 & 2033
- Table 2: Global Security Policy Management Solutions Revenue undefined Forecast, by Types 2020 & 2033
- Table 3: Global Security Policy Management Solutions Revenue undefined Forecast, by Region 2020 & 2033
- Table 4: Global Security Policy Management Solutions Revenue undefined Forecast, by Application 2020 & 2033
- Table 5: Global Security Policy Management Solutions Revenue undefined Forecast, by Types 2020 & 2033
- Table 6: Global Security Policy Management Solutions Revenue undefined Forecast, by Country 2020 & 2033
- Table 7: United States Security Policy Management Solutions Revenue (undefined) Forecast, by Application 2020 & 2033
- Table 8: Canada Security Policy Management Solutions Revenue (undefined) Forecast, by Application 2020 & 2033
- Table 9: Mexico Security Policy Management Solutions Revenue (undefined) Forecast, by Application 2020 & 2033
- Table 10: Global Security Policy Management Solutions Revenue undefined Forecast, by Application 2020 & 2033
- Table 11: Global Security Policy Management Solutions Revenue undefined Forecast, by Types 2020 & 2033
- Table 12: Global Security Policy Management Solutions Revenue undefined Forecast, by Country 2020 & 2033
- Table 13: Brazil Security Policy Management Solutions Revenue (undefined) Forecast, by Application 2020 & 2033
- Table 14: Argentina Security Policy Management Solutions Revenue (undefined) Forecast, by Application 2020 & 2033
- Table 15: Rest of South America Security Policy Management Solutions Revenue (undefined) Forecast, by Application 2020 & 2033
- Table 16: Global Security Policy Management Solutions Revenue undefined Forecast, by Application 2020 & 2033
- Table 17: Global Security Policy Management Solutions Revenue undefined Forecast, by Types 2020 & 2033
- Table 18: Global Security Policy Management Solutions Revenue undefined Forecast, by Country 2020 & 2033
- Table 19: United Kingdom Security Policy Management Solutions Revenue (undefined) Forecast, by Application 2020 & 2033
- Table 20: Germany Security Policy Management Solutions Revenue (undefined) Forecast, by Application 2020 & 2033
- Table 21: France Security Policy Management Solutions Revenue (undefined) Forecast, by Application 2020 & 2033
- Table 22: Italy Security Policy Management Solutions Revenue (undefined) Forecast, by Application 2020 & 2033
- Table 23: Spain Security Policy Management Solutions Revenue (undefined) Forecast, by Application 2020 & 2033
- Table 24: Russia Security Policy Management Solutions Revenue (undefined) Forecast, by Application 2020 & 2033
- Table 25: Benelux Security Policy Management Solutions Revenue (undefined) Forecast, by Application 2020 & 2033
- Table 26: Nordics Security Policy Management Solutions Revenue (undefined) Forecast, by Application 2020 & 2033
- Table 27: Rest of Europe Security Policy Management Solutions Revenue (undefined) Forecast, by Application 2020 & 2033
- Table 28: Global Security Policy Management Solutions Revenue undefined Forecast, by Application 2020 & 2033
- Table 29: Global Security Policy Management Solutions Revenue undefined Forecast, by Types 2020 & 2033
- Table 30: Global Security Policy Management Solutions Revenue undefined Forecast, by Country 2020 & 2033
- Table 31: Turkey Security Policy Management Solutions Revenue (undefined) Forecast, by Application 2020 & 2033
- Table 32: Israel Security Policy Management Solutions Revenue (undefined) Forecast, by Application 2020 & 2033
- Table 33: GCC Security Policy Management Solutions Revenue (undefined) Forecast, by Application 2020 & 2033
- Table 34: North Africa Security Policy Management Solutions Revenue (undefined) Forecast, by Application 2020 & 2033
- Table 35: South Africa Security Policy Management Solutions Revenue (undefined) Forecast, by Application 2020 & 2033
- Table 36: Rest of Middle East & Africa Security Policy Management Solutions Revenue (undefined) Forecast, by Application 2020 & 2033
- Table 37: Global Security Policy Management Solutions Revenue undefined Forecast, by Application 2020 & 2033
- Table 38: Global Security Policy Management Solutions Revenue undefined Forecast, by Types 2020 & 2033
- Table 39: Global Security Policy Management Solutions Revenue undefined Forecast, by Country 2020 & 2033
- Table 40: China Security Policy Management Solutions Revenue (undefined) Forecast, by Application 2020 & 2033
- Table 41: India Security Policy Management Solutions Revenue (undefined) Forecast, by Application 2020 & 2033
- Table 42: Japan Security Policy Management Solutions Revenue (undefined) Forecast, by Application 2020 & 2033
- Table 43: South Korea Security Policy Management Solutions Revenue (undefined) Forecast, by Application 2020 & 2033
- Table 44: ASEAN Security Policy Management Solutions Revenue (undefined) Forecast, by Application 2020 & 2033
- Table 45: Oceania Security Policy Management Solutions Revenue (undefined) Forecast, by Application 2020 & 2033
- Table 46: Rest of Asia Pacific Security Policy Management Solutions Revenue (undefined) Forecast, by Application 2020 & 2033
Frequently Asked Questions
1. What is the projected Compound Annual Growth Rate (CAGR) of the Security Policy Management Solutions?
The projected CAGR is approximately 9.6%.
2. Which companies are prominent players in the Security Policy Management Solutions?
Key companies in the market include Google, Amazon, Cisco, Check Point, FireMon, ForcePoint, HPE, Cisco, Solarwinds, Juniper Nerworks.
3. What are the main segments of the Security Policy Management Solutions?
The market segments include Application, Types.
4. Can you provide details about the market size?
The market size is estimated to be USD XXX N/A as of 2022.
5. What are some drivers contributing to market growth?
N/A
6. What are the notable trends driving market growth?
N/A
7. Are there any restraints impacting market growth?
N/A
8. Can you provide examples of recent developments in the market?
N/A
9. What pricing options are available for accessing the report?
Pricing options include single-user, multi-user, and enterprise licenses priced at USD 4900.00, USD 7350.00, and USD 9800.00 respectively.
10. Is the market size provided in terms of value or volume?
The market size is provided in terms of value, measured in N/A.
11. Are there any specific market keywords associated with the report?
Yes, the market keyword associated with the report is "Security Policy Management Solutions," which aids in identifying and referencing the specific market segment covered.
12. How do I determine which pricing option suits my needs best?
The pricing options vary based on user requirements and access needs. Individual users may opt for single-user licenses, while businesses requiring broader access may choose multi-user or enterprise licenses for cost-effective access to the report.
13. Are there any additional resources or data provided in the Security Policy Management Solutions report?
While the report offers comprehensive insights, it's advisable to review the specific contents or supplementary materials provided to ascertain if additional resources or data are available.
14. How can I stay updated on further developments or reports in the Security Policy Management Solutions?
To stay informed about further developments, trends, and reports in the Security Policy Management Solutions, consider subscribing to industry newsletters, following relevant companies and organizations, or regularly checking reputable industry news sources and publications.
Methodology
Step 1 - Identification of Relevant Samples Size from Population Database


Step 2 - Approaches for Defining Global Market Size (Value, Volume* & Price*)

Note*: In applicable scenarios
Step 3 - Data Sources
Primary Research
- Web Analytics
- Survey Reports
- Research Institute
- Latest Research Reports
- Opinion Leaders
Secondary Research
- Annual Reports
- White Paper
- Latest Press Release
- Industry Association
- Paid Database
- Investor Presentations

Step 4 - Data Triangulation
Involves using different sources of information in order to increase the validity of a study
These sources are likely to be stakeholders in a program - participants, other researchers, program staff, other community members, and so on.
Then we put all data in single framework & apply various statistical tools to find out the dynamic on the market.
During the analysis stage, feedback from the stakeholder groups would be compared to determine areas of agreement as well as areas of divergence