
Key Insights
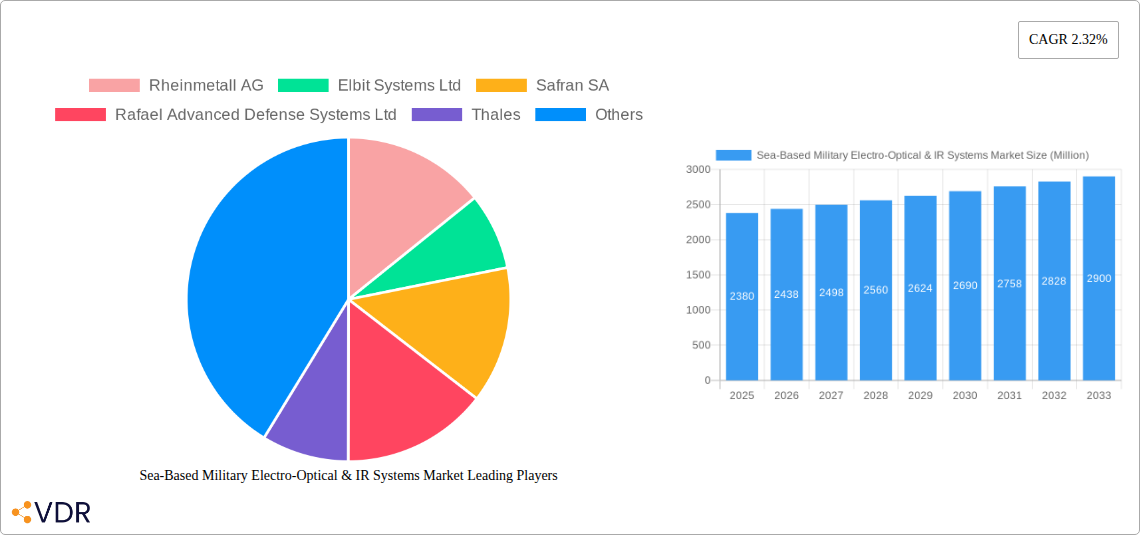
The global Sea-Based Military Electro-Optical & IR Systems market, valued at $2.38 billion in 2025, is projected to experience steady growth, driven by increasing naval modernization efforts worldwide and the rising demand for enhanced surveillance and targeting capabilities. A Compound Annual Growth Rate (CAGR) of 2.32% from 2025 to 2033 indicates a continuous, albeit moderate, expansion. Key drivers include the escalating need for improved situational awareness in maritime environments, particularly in anti-submarine warfare (ASW) and coastal defense. Technological advancements in imaging technology, specifically multispectral and hyperspectral sensors, are enabling superior target identification and tracking in diverse weather conditions and challenging sea states. The market is segmented by imaging technology, with multispectral and hyperspectral systems representing significant portions, reflecting the trend towards more sophisticated and detailed data acquisition. Growth is further fueled by the integration of these systems into unmanned aerial vehicles (UAVs) and other autonomous platforms, expanding operational reach and flexibility. However, factors such as the high initial investment costs associated with these advanced systems and the complexities of integrating them into existing naval infrastructure pose challenges to market growth.
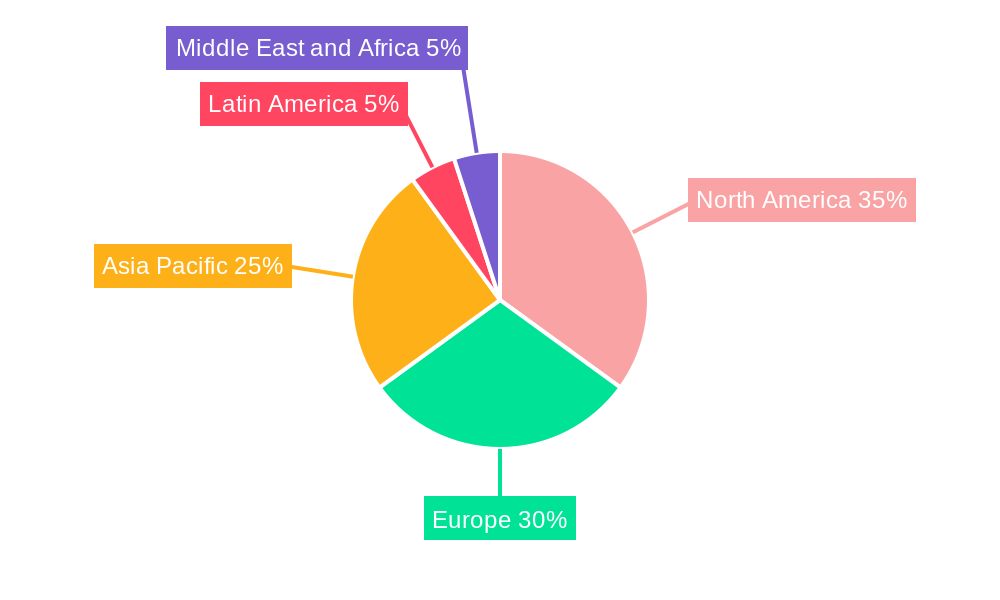
The regional distribution of the market reflects global naval power dynamics. North America and Europe are anticipated to hold substantial market shares, driven by significant defense budgets and robust naval capabilities. The Asia-Pacific region is expected to witness notable growth, fueled by expanding navies in countries such as China and India, which are investing heavily in modernization and technological upgrades. Leading companies, including Rheinmetall AG, Elbit Systems Ltd, Safran SA, and others, are actively developing and supplying advanced electro-optical and IR systems, fostering competition and innovation within the market. The forecast period (2025-2033) suggests a continuous rise in market value, driven by sustained demand from both established and emerging naval powers, alongside continuous technological refinements. This growth trajectory underscores the critical role of sea-based EO/IR systems in maintaining maritime security and projecting naval power.
Sea-Based Military Electro-Optical & IR Systems Market: A Comprehensive Report (2019-2033)
This in-depth report provides a comprehensive analysis of the Sea-Based Military Electro-Optical & IR Systems market, encompassing market dynamics, growth trends, regional insights, product landscapes, and key players. The study period covers 2019-2033, with 2025 serving as the base and estimated year. This report is essential for industry professionals, investors, and strategic decision-makers seeking to understand and capitalize on the opportunities within this rapidly evolving market segment of the larger Military Electro-Optical & IR Systems market. The market is estimated at xx Million in 2025 and is projected to reach xx Million by 2033, exhibiting a CAGR of xx%.
Sea-Based Military Electro-Optical & IR Systems Market Dynamics & Structure
The sea-based military electro-optical and IR systems market is characterized by a moderately concentrated structure, with a few major players holding significant market share. The market is driven by continuous technological innovation, particularly in areas such as high-resolution imaging, advanced sensor fusion, and AI-powered target recognition. Stringent regulatory frameworks governing military technology development and deployment influence market dynamics. Competitive pressure from alternative technologies, such as radar and sonar, also plays a role. The end-user demographic primarily comprises navies and coast guards globally, with demand driven by modernization efforts and the increasing need for enhanced maritime surveillance and defense capabilities. The market has witnessed a moderate number of M&A activities in recent years, primarily focused on strengthening technological capabilities and expanding market reach.
- Market Concentration: Moderately concentrated, with top 5 players holding approximately xx% market share in 2025.
- Technological Innovation: Key drivers include advancements in sensor technology, AI integration, and improved data processing.
- Regulatory Framework: Stringent export controls and security regulations influence market growth.
- Competitive Substitutes: Radar and sonar systems pose competitive threats.
- End-User Demographics: Primarily navies and coast guards globally.
- M&A Activity: Moderate level of mergers and acquisitions, xx deals in the past 5 years.
Sea-Based Military Electro-Optical & IR Systems Market Growth Trends & Insights
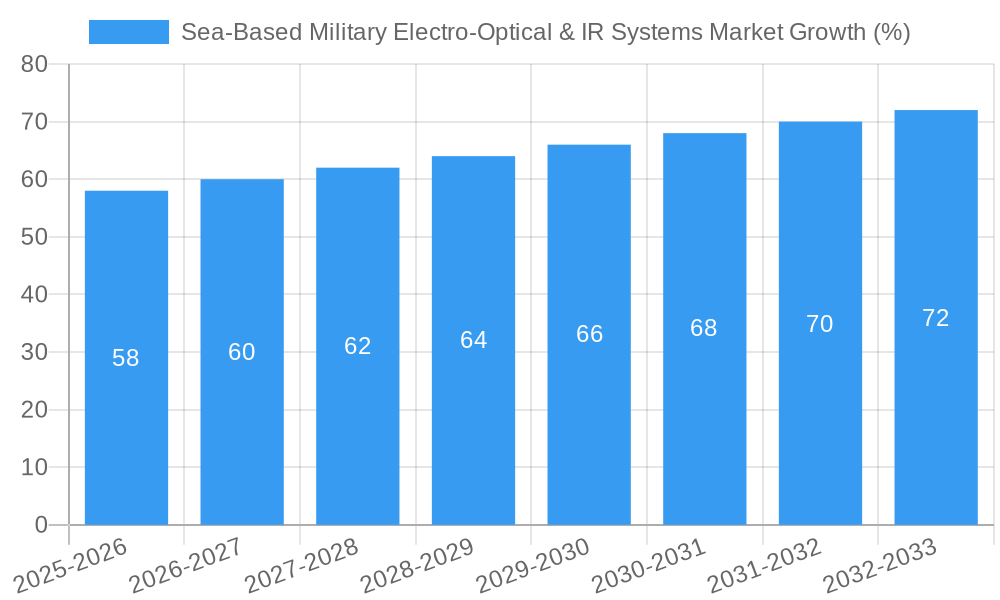
The sea-based military electro-optical and IR systems market has witnessed robust growth in recent years, fueled by increasing geopolitical instability, rising defense budgets, and the growing demand for advanced surveillance and targeting capabilities. Market size has expanded steadily, with a significant upswing observed during the historical period (2019-2024). Adoption rates of advanced EO/IR systems are increasing across various naval platforms, including ships, submarines, and unmanned underwater vehicles (UUVs). Technological disruptions, such as the development of miniaturized sensors and improved image processing algorithms, are driving market growth and enhancing system performance. Consumer behavior, in this context, refers to the evolving needs and preferences of naval forces, which are increasingly demanding higher levels of situational awareness, improved accuracy, and greater operational flexibility. The market is expected to continue its growth trajectory throughout the forecast period (2025-2033), driven by the ongoing modernization of naval forces globally.
Dominant Regions, Countries, or Segments in Sea-Based Military Electro-Optical & IR Systems Market
The North American region currently holds the largest market share in sea-based military electro-optical and IR systems, driven by substantial defense spending and a strong technological base. Within this region, the United States is the dominant country, owing to its significant naval presence and consistent investment in advanced defense technologies. Among the imaging technologies, the multispectral segment currently enjoys higher adoption rates due to its cost-effectiveness and versatility across a range of applications. However, the hyperspectral segment is poised for strong growth in the coming years, given its potential for improved target identification and discrimination.
- Key Drivers (North America): High defense spending, robust technological infrastructure, advanced R&D capabilities.
- Multispectral Segment Drivers: Cost-effectiveness, versatility, wide range of applications.
- Hyperspectral Segment Growth Potential: Enhanced target identification, superior discrimination capabilities.
- Market Share: North America holds xx% of the global market share in 2025, with the US accounting for xx% of the regional share.
- Growth Potential: Hyperspectral segment is projected to have the highest CAGR during the forecast period.
Sea-Based Military Electro-Optical & IR Systems Market Product Landscape
The market features a diverse range of electro-optical and infrared systems, including advanced stabilized camera systems, targeting pods, long-range surveillance systems, and laser rangefinders. These systems are integrated onto various naval platforms, enhancing their operational capabilities in diverse environments. Recent innovations focus on improving image quality, enhancing sensor fusion capabilities, and incorporating artificial intelligence for autonomous target identification and tracking. This results in systems with improved accuracy, faster response times, and greater operational efficiency. Unique selling propositions often center on superior image resolution, extended range capabilities, ruggedized design for harsh maritime environments, and advanced data processing algorithms.
Key Drivers, Barriers & Challenges in Sea-Based Military Electro-Optical & IR Systems Market
Key Drivers: Increasing defense budgets worldwide, modernization of naval fleets, growing demand for enhanced maritime security, technological advancements in sensor fusion and AI. The need for improved situational awareness and precision targeting further accelerates market growth.
Challenges & Restraints: High initial investment costs, dependence on complex supply chains susceptible to disruptions, stringent regulatory approvals and export controls, intense competition from established and emerging players, and the potential impact of technological obsolescence. These factors can pose significant barriers to market entry and expansion. Supply chain issues, for example, could delay project timelines and increase costs by xx%.
Emerging Opportunities in Sea-Based Military Electro-Optical & IR Systems Market
Emerging opportunities lie in the development of smaller, lighter, and more energy-efficient systems for integration into unmanned platforms, including UUVs and drones. The increasing integration of artificial intelligence and machine learning offers significant potential for enhancing system autonomy and improving target recognition accuracy. Furthermore, the growing demand for network-centric warfare capabilities presents opportunities for the development of interoperable and integrated sensor systems. Expansion into emerging markets with increasing naval modernization programs also represents a significant opportunity.
Growth Accelerators in the Sea-Based Military Electro-Optical & IR Systems Market Industry
Long-term growth is being accelerated by significant investments in R&D by leading players, fostering continuous technological advancements. Strategic partnerships and collaborations between defense contractors and technology companies are driving innovation. Government initiatives to promote domestic defense industries are also driving market expansion, along with the focus on developing next-generation systems for improved capabilities and operational effectiveness.
Key Players Shaping the Sea-Based Military Electro-Optical & IR Systems Market Market
- Rheinmetall AG
- Elbit Systems Ltd
- Safran SA
- Rafael Advanced Defense Systems Ltd
- Thales
- BAE Systems PLC
- Northrop Grumman Corporation
- Saab AB
- HENSOLDT A
- Teledyne FLIR LLC
Notable Milestones in Sea-Based Military Electro-Optical & IR Systems Market Sector
- 2022-Q4: Launch of a new generation of stabilized multispectral camera system by [Company Name], enhancing situational awareness.
- 2021-Q2: Strategic partnership between [Company Name 1] and [Company Name 2] to develop advanced hyperspectral imaging technology for naval applications.
- 2020-Q1: Successful deployment of a new AI-powered target recognition system by [Company Name] on a naval vessel.
In-Depth Sea-Based Military Electro-Optical & IR Systems Market Market Outlook
The future of the sea-based military electro-optical and IR systems market appears bright, driven by sustained demand for improved maritime security and the continuous integration of advanced technologies. Strategic opportunities exist for companies focusing on developing smaller, more energy-efficient systems for unmanned platforms. The development and implementation of AI-powered systems will play a key role in enhancing situational awareness and improving operational effectiveness for naval forces globally. The market is poised for robust growth, and strategic investments in R&D and partnerships will be key factors driving success in this dynamic sector.
Sea-Based Military Electro-Optical & IR Systems Market Segmentation
-
1. Imaging Technology
- 1.1. Multispectral
- 1.2. Hyperspectral
Sea-Based Military Electro-Optical & IR Systems Market Segmentation By Geography
-
1. North America
- 1.1. United States
- 1.2. Canada
-
2. Europe
- 2.1. Germany
- 2.2. United Kingdom
- 2.3. France
- 2.4. Russia
- 2.5. Rest of Europe
-
3. Asia Pacific
- 3.1. India
- 3.2. China
- 3.3. Japan
- 3.4. South Korea
- 3.5. Australia
- 3.6. Rest of Asia Pacific
-
4. Latin America
- 4.1. Brazil
- 4.2. Rest of Latin America
-
5. Middle East and Africa
- 5.1. Saudi Arabia
- 5.2. Egypt
- 5.3. Israel
- 5.4. Rest of Middle East and Africa
Sea-Based Military Electro-Optical & IR Systems Market REPORT HIGHLIGHTS
| Aspects | Details |
|---|---|
| Study Period | 2019-2033 |
| Base Year | 2024 |
| Estimated Year | 2025 |
| Forecast Period | 2025-2033 |
| Historical Period | 2019-2024 |
| Growth Rate | CAGR of 2.32% from 2019-2033 |
| Segmentation |
|
Table of Contents
- 1. Introduction
- 1.1. Research Scope
- 1.2. Market Segmentation
- 1.3. Research Methodology
- 1.4. Definitions and Assumptions
- 2. Executive Summary
- 2.1. Introduction
- 3. Market Dynamics
- 3.1. Introduction
- 3.2. Market Drivers
- 3.3. Market Restrains
- 3.4. Market Trends
- 3.4.1. Hyperspectral Segment is Projected to Showcase Highest Growth during the Forecast Period
- 4. Market Factor Analysis
- 4.1. Porters Five Forces
- 4.2. Supply/Value Chain
- 4.3. PESTEL analysis
- 4.4. Market Entropy
- 4.5. Patent/Trademark Analysis
- 5. Global Sea-Based Military Electro-Optical & IR Systems Market Analysis, Insights and Forecast, 2019-2031
- 5.1. Market Analysis, Insights and Forecast - by Imaging Technology
- 5.1.1. Multispectral
- 5.1.2. Hyperspectral
- 5.2. Market Analysis, Insights and Forecast - by Region
- 5.2.1. North America
- 5.2.2. Europe
- 5.2.3. Asia Pacific
- 5.2.4. Latin America
- 5.2.5. Middle East and Africa
- 5.1. Market Analysis, Insights and Forecast - by Imaging Technology
- 6. North America Sea-Based Military Electro-Optical & IR Systems Market Analysis, Insights and Forecast, 2019-2031
- 6.1. Market Analysis, Insights and Forecast - by Imaging Technology
- 6.1.1. Multispectral
- 6.1.2. Hyperspectral
- 6.1. Market Analysis, Insights and Forecast - by Imaging Technology
- 7. Europe Sea-Based Military Electro-Optical & IR Systems Market Analysis, Insights and Forecast, 2019-2031
- 7.1. Market Analysis, Insights and Forecast - by Imaging Technology
- 7.1.1. Multispectral
- 7.1.2. Hyperspectral
- 7.1. Market Analysis, Insights and Forecast - by Imaging Technology
- 8. Asia Pacific Sea-Based Military Electro-Optical & IR Systems Market Analysis, Insights and Forecast, 2019-2031
- 8.1. Market Analysis, Insights and Forecast - by Imaging Technology
- 8.1.1. Multispectral
- 8.1.2. Hyperspectral
- 8.1. Market Analysis, Insights and Forecast - by Imaging Technology
- 9. Latin America Sea-Based Military Electro-Optical & IR Systems Market Analysis, Insights and Forecast, 2019-2031
- 9.1. Market Analysis, Insights and Forecast - by Imaging Technology
- 9.1.1. Multispectral
- 9.1.2. Hyperspectral
- 9.1. Market Analysis, Insights and Forecast - by Imaging Technology
- 10. Middle East and Africa Sea-Based Military Electro-Optical & IR Systems Market Analysis, Insights and Forecast, 2019-2031
- 10.1. Market Analysis, Insights and Forecast - by Imaging Technology
- 10.1.1. Multispectral
- 10.1.2. Hyperspectral
- 10.1. Market Analysis, Insights and Forecast - by Imaging Technology
- 11. North America Sea-Based Military Electro-Optical & IR Systems Market Analysis, Insights and Forecast, 2019-2031
- 11.1. Market Analysis, Insights and Forecast - By Country/Sub-region
- 11.1.1 United States
- 11.1.2 Canada
- 12. Europe Sea-Based Military Electro-Optical & IR Systems Market Analysis, Insights and Forecast, 2019-2031
- 12.1. Market Analysis, Insights and Forecast - By Country/Sub-region
- 12.1.1 Germany
- 12.1.2 United Kingdom
- 12.1.3 France
- 12.1.4 Russia
- 12.1.5 Rest of Europe
- 13. Asia Pacific Sea-Based Military Electro-Optical & IR Systems Market Analysis, Insights and Forecast, 2019-2031
- 13.1. Market Analysis, Insights and Forecast - By Country/Sub-region
- 13.1.1 India
- 13.1.2 China
- 13.1.3 Japan
- 13.1.4 South Korea
- 13.1.5 Australia
- 13.1.6 Rest of Asia Pacific
- 14. Latin America Sea-Based Military Electro-Optical & IR Systems Market Analysis, Insights and Forecast, 2019-2031
- 14.1. Market Analysis, Insights and Forecast - By Country/Sub-region
- 14.1.1 Brazil
- 14.1.2 Rest of Latin America
- 15. Middle East and Africa Sea-Based Military Electro-Optical & IR Systems Market Analysis, Insights and Forecast, 2019-2031
- 15.1. Market Analysis, Insights and Forecast - By Country/Sub-region
- 15.1.1 Saudi Arabia
- 15.1.2 Egypt
- 15.1.3 Israel
- 15.1.4 Rest of Middle East and Africa
- 16. Competitive Analysis
- 16.1. Global Market Share Analysis 2024
- 16.2. Company Profiles
- 16.2.1 Rheinmetall AG
- 16.2.1.1. Overview
- 16.2.1.2. Products
- 16.2.1.3. SWOT Analysis
- 16.2.1.4. Recent Developments
- 16.2.1.5. Financials (Based on Availability)
- 16.2.2 Elbit Systems Ltd
- 16.2.2.1. Overview
- 16.2.2.2. Products
- 16.2.2.3. SWOT Analysis
- 16.2.2.4. Recent Developments
- 16.2.2.5. Financials (Based on Availability)
- 16.2.3 Safran SA
- 16.2.3.1. Overview
- 16.2.3.2. Products
- 16.2.3.3. SWOT Analysis
- 16.2.3.4. Recent Developments
- 16.2.3.5. Financials (Based on Availability)
- 16.2.4 Rafael Advanced Defense Systems Ltd
- 16.2.4.1. Overview
- 16.2.4.2. Products
- 16.2.4.3. SWOT Analysis
- 16.2.4.4. Recent Developments
- 16.2.4.5. Financials (Based on Availability)
- 16.2.5 Thales
- 16.2.5.1. Overview
- 16.2.5.2. Products
- 16.2.5.3. SWOT Analysis
- 16.2.5.4. Recent Developments
- 16.2.5.5. Financials (Based on Availability)
- 16.2.6 BAE Systems PLC
- 16.2.6.1. Overview
- 16.2.6.2. Products
- 16.2.6.3. SWOT Analysis
- 16.2.6.4. Recent Developments
- 16.2.6.5. Financials (Based on Availability)
- 16.2.7 Northrop Grumman Corporation
- 16.2.7.1. Overview
- 16.2.7.2. Products
- 16.2.7.3. SWOT Analysis
- 16.2.7.4. Recent Developments
- 16.2.7.5. Financials (Based on Availability)
- 16.2.8 Saab AB
- 16.2.8.1. Overview
- 16.2.8.2. Products
- 16.2.8.3. SWOT Analysis
- 16.2.8.4. Recent Developments
- 16.2.8.5. Financials (Based on Availability)
- 16.2.9 HENSOLDT A
- 16.2.9.1. Overview
- 16.2.9.2. Products
- 16.2.9.3. SWOT Analysis
- 16.2.9.4. Recent Developments
- 16.2.9.5. Financials (Based on Availability)
- 16.2.10 Teledyne FLIR LLC
- 16.2.10.1. Overview
- 16.2.10.2. Products
- 16.2.10.3. SWOT Analysis
- 16.2.10.4. Recent Developments
- 16.2.10.5. Financials (Based on Availability)
- 16.2.1 Rheinmetall AG
List of Figures
- Figure 1: Global Sea-Based Military Electro-Optical & IR Systems Market Revenue Breakdown (Million, %) by Region 2024 & 2032
- Figure 2: North America Sea-Based Military Electro-Optical & IR Systems Market Revenue (Million), by Country 2024 & 2032
- Figure 3: North America Sea-Based Military Electro-Optical & IR Systems Market Revenue Share (%), by Country 2024 & 2032
- Figure 4: Europe Sea-Based Military Electro-Optical & IR Systems Market Revenue (Million), by Country 2024 & 2032
- Figure 5: Europe Sea-Based Military Electro-Optical & IR Systems Market Revenue Share (%), by Country 2024 & 2032
- Figure 6: Asia Pacific Sea-Based Military Electro-Optical & IR Systems Market Revenue (Million), by Country 2024 & 2032
- Figure 7: Asia Pacific Sea-Based Military Electro-Optical & IR Systems Market Revenue Share (%), by Country 2024 & 2032
- Figure 8: Latin America Sea-Based Military Electro-Optical & IR Systems Market Revenue (Million), by Country 2024 & 2032
- Figure 9: Latin America Sea-Based Military Electro-Optical & IR Systems Market Revenue Share (%), by Country 2024 & 2032
- Figure 10: Middle East and Africa Sea-Based Military Electro-Optical & IR Systems Market Revenue (Million), by Country 2024 & 2032
- Figure 11: Middle East and Africa Sea-Based Military Electro-Optical & IR Systems Market Revenue Share (%), by Country 2024 & 2032
- Figure 12: North America Sea-Based Military Electro-Optical & IR Systems Market Revenue (Million), by Imaging Technology 2024 & 2032
- Figure 13: North America Sea-Based Military Electro-Optical & IR Systems Market Revenue Share (%), by Imaging Technology 2024 & 2032
- Figure 14: North America Sea-Based Military Electro-Optical & IR Systems Market Revenue (Million), by Country 2024 & 2032
- Figure 15: North America Sea-Based Military Electro-Optical & IR Systems Market Revenue Share (%), by Country 2024 & 2032
- Figure 16: Europe Sea-Based Military Electro-Optical & IR Systems Market Revenue (Million), by Imaging Technology 2024 & 2032
- Figure 17: Europe Sea-Based Military Electro-Optical & IR Systems Market Revenue Share (%), by Imaging Technology 2024 & 2032
- Figure 18: Europe Sea-Based Military Electro-Optical & IR Systems Market Revenue (Million), by Country 2024 & 2032
- Figure 19: Europe Sea-Based Military Electro-Optical & IR Systems Market Revenue Share (%), by Country 2024 & 2032
- Figure 20: Asia Pacific Sea-Based Military Electro-Optical & IR Systems Market Revenue (Million), by Imaging Technology 2024 & 2032
- Figure 21: Asia Pacific Sea-Based Military Electro-Optical & IR Systems Market Revenue Share (%), by Imaging Technology 2024 & 2032
- Figure 22: Asia Pacific Sea-Based Military Electro-Optical & IR Systems Market Revenue (Million), by Country 2024 & 2032
- Figure 23: Asia Pacific Sea-Based Military Electro-Optical & IR Systems Market Revenue Share (%), by Country 2024 & 2032
- Figure 24: Latin America Sea-Based Military Electro-Optical & IR Systems Market Revenue (Million), by Imaging Technology 2024 & 2032
- Figure 25: Latin America Sea-Based Military Electro-Optical & IR Systems Market Revenue Share (%), by Imaging Technology 2024 & 2032
- Figure 26: Latin America Sea-Based Military Electro-Optical & IR Systems Market Revenue (Million), by Country 2024 & 2032
- Figure 27: Latin America Sea-Based Military Electro-Optical & IR Systems Market Revenue Share (%), by Country 2024 & 2032
- Figure 28: Middle East and Africa Sea-Based Military Electro-Optical & IR Systems Market Revenue (Million), by Imaging Technology 2024 & 2032
- Figure 29: Middle East and Africa Sea-Based Military Electro-Optical & IR Systems Market Revenue Share (%), by Imaging Technology 2024 & 2032
- Figure 30: Middle East and Africa Sea-Based Military Electro-Optical & IR Systems Market Revenue (Million), by Country 2024 & 2032
- Figure 31: Middle East and Africa Sea-Based Military Electro-Optical & IR Systems Market Revenue Share (%), by Country 2024 & 2032
List of Tables
- Table 1: Global Sea-Based Military Electro-Optical & IR Systems Market Revenue Million Forecast, by Region 2019 & 2032
- Table 2: Global Sea-Based Military Electro-Optical & IR Systems Market Revenue Million Forecast, by Imaging Technology 2019 & 2032
- Table 3: Global Sea-Based Military Electro-Optical & IR Systems Market Revenue Million Forecast, by Region 2019 & 2032
- Table 4: Global Sea-Based Military Electro-Optical & IR Systems Market Revenue Million Forecast, by Country 2019 & 2032
- Table 5: United States Sea-Based Military Electro-Optical & IR Systems Market Revenue (Million) Forecast, by Application 2019 & 2032
- Table 6: Canada Sea-Based Military Electro-Optical & IR Systems Market Revenue (Million) Forecast, by Application 2019 & 2032
- Table 7: Global Sea-Based Military Electro-Optical & IR Systems Market Revenue Million Forecast, by Country 2019 & 2032
- Table 8: Germany Sea-Based Military Electro-Optical & IR Systems Market Revenue (Million) Forecast, by Application 2019 & 2032
- Table 9: United Kingdom Sea-Based Military Electro-Optical & IR Systems Market Revenue (Million) Forecast, by Application 2019 & 2032
- Table 10: France Sea-Based Military Electro-Optical & IR Systems Market Revenue (Million) Forecast, by Application 2019 & 2032
- Table 11: Russia Sea-Based Military Electro-Optical & IR Systems Market Revenue (Million) Forecast, by Application 2019 & 2032
- Table 12: Rest of Europe Sea-Based Military Electro-Optical & IR Systems Market Revenue (Million) Forecast, by Application 2019 & 2032
- Table 13: Global Sea-Based Military Electro-Optical & IR Systems Market Revenue Million Forecast, by Country 2019 & 2032
- Table 14: India Sea-Based Military Electro-Optical & IR Systems Market Revenue (Million) Forecast, by Application 2019 & 2032
- Table 15: China Sea-Based Military Electro-Optical & IR Systems Market Revenue (Million) Forecast, by Application 2019 & 2032
- Table 16: Japan Sea-Based Military Electro-Optical & IR Systems Market Revenue (Million) Forecast, by Application 2019 & 2032
- Table 17: South Korea Sea-Based Military Electro-Optical & IR Systems Market Revenue (Million) Forecast, by Application 2019 & 2032
- Table 18: Australia Sea-Based Military Electro-Optical & IR Systems Market Revenue (Million) Forecast, by Application 2019 & 2032
- Table 19: Rest of Asia Pacific Sea-Based Military Electro-Optical & IR Systems Market Revenue (Million) Forecast, by Application 2019 & 2032
- Table 20: Global Sea-Based Military Electro-Optical & IR Systems Market Revenue Million Forecast, by Country 2019 & 2032
- Table 21: Brazil Sea-Based Military Electro-Optical & IR Systems Market Revenue (Million) Forecast, by Application 2019 & 2032
- Table 22: Rest of Latin America Sea-Based Military Electro-Optical & IR Systems Market Revenue (Million) Forecast, by Application 2019 & 2032
- Table 23: Global Sea-Based Military Electro-Optical & IR Systems Market Revenue Million Forecast, by Country 2019 & 2032
- Table 24: Saudi Arabia Sea-Based Military Electro-Optical & IR Systems Market Revenue (Million) Forecast, by Application 2019 & 2032
- Table 25: Egypt Sea-Based Military Electro-Optical & IR Systems Market Revenue (Million) Forecast, by Application 2019 & 2032
- Table 26: Israel Sea-Based Military Electro-Optical & IR Systems Market Revenue (Million) Forecast, by Application 2019 & 2032
- Table 27: Rest of Middle East and Africa Sea-Based Military Electro-Optical & IR Systems Market Revenue (Million) Forecast, by Application 2019 & 2032
- Table 28: Global Sea-Based Military Electro-Optical & IR Systems Market Revenue Million Forecast, by Imaging Technology 2019 & 2032
- Table 29: Global Sea-Based Military Electro-Optical & IR Systems Market Revenue Million Forecast, by Country 2019 & 2032
- Table 30: United States Sea-Based Military Electro-Optical & IR Systems Market Revenue (Million) Forecast, by Application 2019 & 2032
- Table 31: Canada Sea-Based Military Electro-Optical & IR Systems Market Revenue (Million) Forecast, by Application 2019 & 2032
- Table 32: Global Sea-Based Military Electro-Optical & IR Systems Market Revenue Million Forecast, by Imaging Technology 2019 & 2032
- Table 33: Global Sea-Based Military Electro-Optical & IR Systems Market Revenue Million Forecast, by Country 2019 & 2032
- Table 34: Germany Sea-Based Military Electro-Optical & IR Systems Market Revenue (Million) Forecast, by Application 2019 & 2032
- Table 35: United Kingdom Sea-Based Military Electro-Optical & IR Systems Market Revenue (Million) Forecast, by Application 2019 & 2032
- Table 36: France Sea-Based Military Electro-Optical & IR Systems Market Revenue (Million) Forecast, by Application 2019 & 2032
- Table 37: Russia Sea-Based Military Electro-Optical & IR Systems Market Revenue (Million) Forecast, by Application 2019 & 2032
- Table 38: Rest of Europe Sea-Based Military Electro-Optical & IR Systems Market Revenue (Million) Forecast, by Application 2019 & 2032
- Table 39: Global Sea-Based Military Electro-Optical & IR Systems Market Revenue Million Forecast, by Imaging Technology 2019 & 2032
- Table 40: Global Sea-Based Military Electro-Optical & IR Systems Market Revenue Million Forecast, by Country 2019 & 2032
- Table 41: India Sea-Based Military Electro-Optical & IR Systems Market Revenue (Million) Forecast, by Application 2019 & 2032
- Table 42: China Sea-Based Military Electro-Optical & IR Systems Market Revenue (Million) Forecast, by Application 2019 & 2032
- Table 43: Japan Sea-Based Military Electro-Optical & IR Systems Market Revenue (Million) Forecast, by Application 2019 & 2032
- Table 44: South Korea Sea-Based Military Electro-Optical & IR Systems Market Revenue (Million) Forecast, by Application 2019 & 2032
- Table 45: Australia Sea-Based Military Electro-Optical & IR Systems Market Revenue (Million) Forecast, by Application 2019 & 2032
- Table 46: Rest of Asia Pacific Sea-Based Military Electro-Optical & IR Systems Market Revenue (Million) Forecast, by Application 2019 & 2032
- Table 47: Global Sea-Based Military Electro-Optical & IR Systems Market Revenue Million Forecast, by Imaging Technology 2019 & 2032
- Table 48: Global Sea-Based Military Electro-Optical & IR Systems Market Revenue Million Forecast, by Country 2019 & 2032
- Table 49: Brazil Sea-Based Military Electro-Optical & IR Systems Market Revenue (Million) Forecast, by Application 2019 & 2032
- Table 50: Rest of Latin America Sea-Based Military Electro-Optical & IR Systems Market Revenue (Million) Forecast, by Application 2019 & 2032
- Table 51: Global Sea-Based Military Electro-Optical & IR Systems Market Revenue Million Forecast, by Imaging Technology 2019 & 2032
- Table 52: Global Sea-Based Military Electro-Optical & IR Systems Market Revenue Million Forecast, by Country 2019 & 2032
- Table 53: Saudi Arabia Sea-Based Military Electro-Optical & IR Systems Market Revenue (Million) Forecast, by Application 2019 & 2032
- Table 54: Egypt Sea-Based Military Electro-Optical & IR Systems Market Revenue (Million) Forecast, by Application 2019 & 2032
- Table 55: Israel Sea-Based Military Electro-Optical & IR Systems Market Revenue (Million) Forecast, by Application 2019 & 2032
- Table 56: Rest of Middle East and Africa Sea-Based Military Electro-Optical & IR Systems Market Revenue (Million) Forecast, by Application 2019 & 2032
Frequently Asked Questions
1. What is the projected Compound Annual Growth Rate (CAGR) of the Sea-Based Military Electro-Optical & IR Systems Market?
The projected CAGR is approximately 2.32%.
2. Which companies are prominent players in the Sea-Based Military Electro-Optical & IR Systems Market?
Key companies in the market include Rheinmetall AG, Elbit Systems Ltd, Safran SA, Rafael Advanced Defense Systems Ltd, Thales, BAE Systems PLC, Northrop Grumman Corporation, Saab AB, HENSOLDT A, Teledyne FLIR LLC.
3. What are the main segments of the Sea-Based Military Electro-Optical & IR Systems Market?
The market segments include Imaging Technology.
4. Can you provide details about the market size?
The market size is estimated to be USD 2.38 Million as of 2022.
5. What are some drivers contributing to market growth?
N/A
6. What are the notable trends driving market growth?
Hyperspectral Segment is Projected to Showcase Highest Growth during the Forecast Period.
7. Are there any restraints impacting market growth?
N/A
8. Can you provide examples of recent developments in the market?
N/A
9. What pricing options are available for accessing the report?
Pricing options include single-user, multi-user, and enterprise licenses priced at USD 4750, USD 5250, and USD 8750 respectively.
10. Is the market size provided in terms of value or volume?
The market size is provided in terms of value, measured in Million.
11. Are there any specific market keywords associated with the report?
Yes, the market keyword associated with the report is "Sea-Based Military Electro-Optical & IR Systems Market," which aids in identifying and referencing the specific market segment covered.
12. How do I determine which pricing option suits my needs best?
The pricing options vary based on user requirements and access needs. Individual users may opt for single-user licenses, while businesses requiring broader access may choose multi-user or enterprise licenses for cost-effective access to the report.
13. Are there any additional resources or data provided in the Sea-Based Military Electro-Optical & IR Systems Market report?
While the report offers comprehensive insights, it's advisable to review the specific contents or supplementary materials provided to ascertain if additional resources or data are available.
14. How can I stay updated on further developments or reports in the Sea-Based Military Electro-Optical & IR Systems Market?
To stay informed about further developments, trends, and reports in the Sea-Based Military Electro-Optical & IR Systems Market, consider subscribing to industry newsletters, following relevant companies and organizations, or regularly checking reputable industry news sources and publications.
Methodology
Step 1 - Identification of Relevant Samples Size from Population Database


Step 2 - Approaches for Defining Global Market Size (Value, Volume* & Price*)

Note*: In applicable scenarios
Step 3 - Data Sources
Primary Research
- Web Analytics
- Survey Reports
- Research Institute
- Latest Research Reports
- Opinion Leaders
Secondary Research
- Annual Reports
- White Paper
- Latest Press Release
- Industry Association
- Paid Database
- Investor Presentations

Step 4 - Data Triangulation
Involves using different sources of information in order to increase the validity of a study
These sources are likely to be stakeholders in a program - participants, other researchers, program staff, other community members, and so on.
Then we put all data in single framework & apply various statistical tools to find out the dynamic on the market.
During the analysis stage, feedback from the stakeholder groups would be compared to determine areas of agreement as well as areas of divergence


