Emerging Opportunities in Rubber Carbon Black Market Market

Rubber Carbon Black Market by Application (Tires, Hoses, Belts, Gaskets, Vibration Control, Footwear), by Asia Pacific (China, India, Japan, South Korea, Rest of Asia Pacific), by North America (United States, Canada, Mexico), by Europe (Germany, United Kingdom, Italy, Russia, France, Spain, Turkey, Rest of Europe), by South America (Brazil, Argentina, Rest of South America), by Middle East and Africa (Saudi Arabia, South Africa, Rest of Middle East and Africa) Forecast 2025-2033

Jun 29 2025
Base Year: 2024

180 Pages
Main Logo

Emerging Opportunities in Rubber Carbon Black Market Market


Home
Industries
Chemicals & Materials
sponsor image
sponsor image
sponsor image
sponsor image

Tailored for you

  • In-depth Analysis Tailored to Specified Regions or Segments
  • Company Profiles Customized to User Preferences
  • Comprehensive Insights Focused on Specific Segments or Regions
  • Customized Evaluation of Competitive Landscape to Meet Your Needs
  • Tailored Customization to Address Other Specific Requirements
Ask for customization


Key Insights

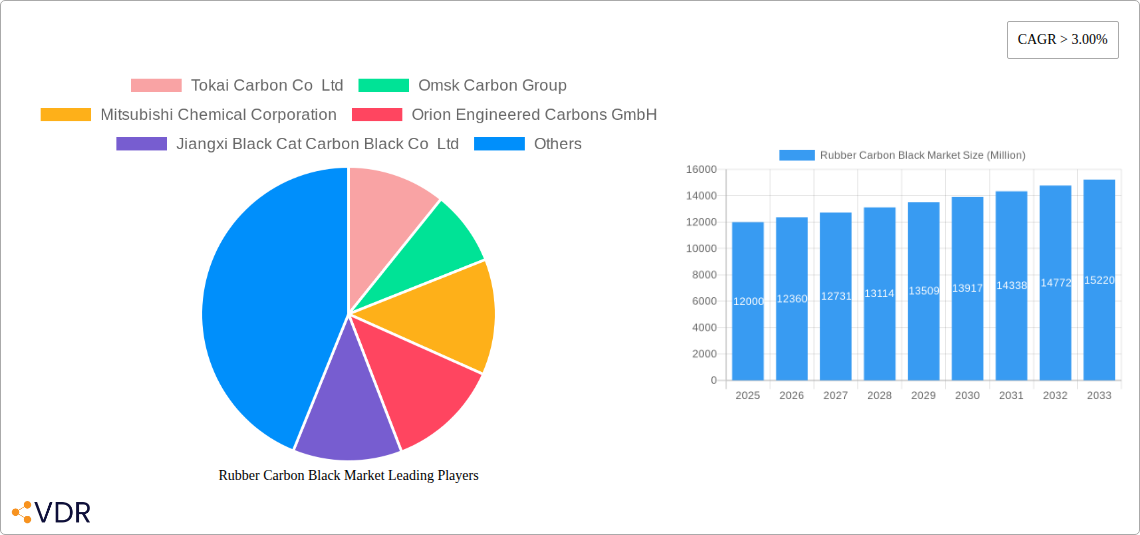
The global rubber carbon black market is experiencing robust growth, driven by the expanding tire industry, particularly in developing economies like India and China. The market's Compound Annual Growth Rate (CAGR) exceeding 3% indicates sustained demand, fueled by increasing vehicle production and infrastructure development globally. Key application segments such as tires, hoses, belts, and gaskets contribute significantly to this growth. Furthermore, the rising demand for high-performance tires and specialized rubber products requiring enhanced durability and resilience is boosting the market. Technological advancements in carbon black production, focusing on improved dispersion and enhanced properties, are further propelling market expansion. While raw material price fluctuations and environmental regulations pose some challenges, the overall market outlook remains positive, with significant growth potential in the Asia-Pacific region, which holds a substantial market share due to its large manufacturing base and rapidly growing automotive sector. Major players like Cabot Corporation, Birla Carbon, and Tokai Carbon are strategically investing in capacity expansion and technological upgrades to capitalize on this growth. The forecast period (2025-2033) promises continued expansion, driven by increasing consumer demand for automobiles, industrial machinery, and consumer goods incorporating rubber components. Competition within the market is intense, with companies focusing on product differentiation, cost optimization, and strategic partnerships to maintain their market position.
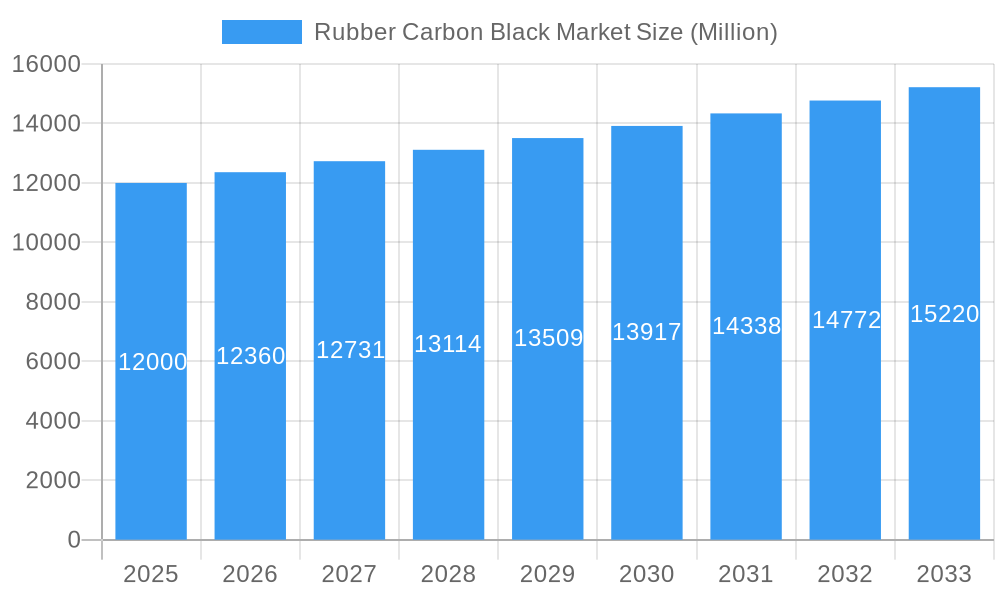
The market segmentation reveals that tires are the dominant application, followed by hoses, belts, and gaskets. Growth in the vibration control and footwear segments is also expected, though at a comparatively slower pace. Regional analysis indicates that Asia-Pacific holds the largest market share, driven by the rapid industrialization and economic growth in countries like China and India. North America and Europe follow, with significant but slower growth rates due to mature markets. However, the Middle East and Africa, along with South America, are showing promising growth potential fueled by rising infrastructure investments and increasing automobile production. Overall, the Rubber Carbon Black market demonstrates a compelling investment opportunity due to its steady growth trajectory, strong demand drivers, and the involvement of established industry players actively shaping its future.

Rubber Carbon Black Market Research Report - Market Size, Growth & Forecast

Rubber Carbon Black Market: A Comprehensive Market Report (2019-2033)

This comprehensive report provides an in-depth analysis of the Rubber Carbon Black market, encompassing market dynamics, growth trends, regional analysis, product landscape, key players, and future outlook. The study period spans from 2019 to 2033, with 2025 serving as the base and estimated year. This report is crucial for industry professionals, investors, and strategists seeking to navigate this dynamic market. The parent market is the broader Carbon Black market, and the child market is specifically Rubber Carbon Black applications.

Rubber Carbon Black Market Dynamics & Structure

This section analyzes the Rubber Carbon Black market's structure, encompassing market concentration, technological innovation, regulatory frameworks, competitive substitutes, end-user demographics, and mergers & acquisitions (M&A) activity. The market is moderately concentrated, with several key players holding significant market share. However, the presence of numerous smaller players indicates a competitive landscape.

  • Market Concentration: xx% market share held by the top 5 players in 2024. This concentration is expected to xx% by 2033.
  • Technological Innovation: Continuous innovation in carbon black production methods, focusing on enhancing performance characteristics like dispersion, abrasion resistance, and sustainability, are driving market growth. Challenges include high R&D costs and the need for specialized expertise.
  • Regulatory Framework: Stringent environmental regulations related to emissions and waste management are impacting the industry, pushing manufacturers towards sustainable production processes.
  • Competitive Substitutes: Alternative materials like silica are emerging as potential substitutes, posing a challenge to carbon black's market dominance. However, carbon black continues to hold a cost advantage in many applications.
  • End-User Demographics: The automotive industry, particularly tire manufacturing, remains the dominant end-user segment, although growth is also seen in other applications like hoses, belts, and footwear.
  • M&A Trends: The past five years have witnessed xx M&A deals in the rubber carbon black sector, primarily driven by expansion strategies and the consolidation of market share. This trend is predicted to continue with xx more deals anticipated by 2033.

Rubber Carbon Black Market Growth Trends & Insights

The Rubber Carbon Black market is experiencing robust growth, driven by the increasing demand from the automotive and industrial sectors. The market size is estimated at $xx million in 2025, projected to reach $xx million by 2033, exhibiting a CAGR of xx%. This growth is fueled by several key factors: rising vehicle production, the increasing use of carbon black in high-performance tires, and the expansion of industrial applications. The adoption rate of carbon black in various rubber products remains high, with market penetration expected to reach xx% by 2033. Technological advancements are enhancing the performance and sustainability of carbon black, contributing to its continued dominance in the market. However, shifts in consumer preferences towards eco-friendly materials and the emergence of alternative solutions present potential challenges.

Rubber Carbon Black Market Growth

Dominant Regions, Countries, or Segments in Rubber Carbon Black Market

Asia-Pacific dominates the Rubber Carbon Black market, driven by robust growth in automotive production and increasing industrialization. China, India, and Japan are key regional contributors.

  • Key Drivers:
    • Rapid industrialization and automotive sector expansion in Asia-Pacific.
    • Favorable government policies promoting infrastructure development.
    • Growing demand for high-performance tires.
  • Dominance Factors:
    • Large-scale production facilities, leading to cost advantages.
    • Strong presence of major carbon black manufacturers.
    • High consumption rates in developing economies.
  • Growth Potential: The Asia-Pacific market presents significant growth opportunities, particularly in emerging economies. Further expansion is projected within the tire segment, driven by increased vehicle ownership and infrastructure investments. The application segment of Tires remains the largest contributor, holding an estimated xx% market share, followed by Hoses (xx%), Belts (xx%), Gaskets (xx%), Vibration Control (xx%), and Footwear (xx%).

Rubber Carbon Black Market Product Landscape

Rubber carbon blacks are categorized by their surface area, structure, and particle size, which directly influence their performance properties in rubber compounds. Recent innovations focus on developing carbon blacks with improved dispersion, higher tensile strength, and enhanced abrasion resistance. The introduction of environmentally friendly production methods and the development of specialized grades for high-performance applications are further driving product differentiation. Unique selling propositions emphasize enhanced performance, sustainability, and cost-effectiveness.

Key Drivers, Barriers & Challenges in Rubber Carbon Black Market

Key Drivers: The global automotive industry's growth fuels demand for tires and other rubber products. Government initiatives supporting infrastructure development further boost consumption. Technological advancements lead to superior grades of carbon black with improved properties.

Challenges and Restraints: Fluctuations in raw material prices (crude oil) significantly impact profitability. Stringent environmental regulations increase production costs. Competition from alternative materials, like silica, creates market pressure. Supply chain disruptions caused by geopolitical instability or unexpected events, such as the COVID-19 pandemic, impact production and availability. The estimated impact of supply chain issues on production is a reduction of xx% in 2024.

Emerging Opportunities in Rubber Carbon Black Market

Emerging opportunities lie in the development of sustainable and eco-friendly carbon black production methods. The growth of electric vehicles presents new opportunities for specialized carbon black grades suited for high-performance tires and other components. Furthermore, expanding into niche applications, such as conductive inks and specialized sealants, offer significant potential.

Growth Accelerators in the Rubber Carbon Black Market Industry

Technological advancements in carbon black production are driving efficiency gains and the creation of superior products. Strategic partnerships between carbon black producers and rubber manufacturers lead to improved product design and supply chain integration. Market expansion into rapidly growing economies, such as those in Southeast Asia and Africa, presents significant opportunities for future growth.

Key Players Shaping the Rubber Carbon Black Market Market

  • Tokai Carbon Co Ltd
  • Omsk Carbon Group
  • Mitsubishi Chemical Corporation
  • Orion Engineered Carbons GmbH
  • Jiangxi Black Cat Carbon Black Co Ltd
  • NNPC
  • ASAHI CARBON Co Ltd
  • Cabot Corporation
  • Himadri Speciality Chemical Ltd
  • Longxing Chemical Stock Co Ltd
  • International CSRC Investment Holdings Co Ltd
  • PCBL
  • OCI Company Ltd
  • Birla Carbon (Aditya Birla Group)

Notable Milestones in Rubber Carbon Black Sector

  • June 2021: Orion Engineered Carbon launched ECORAX Nature, a plant-based carbon black for rubber applications.
  • August 2021: PCBL announced plans for a INR 1,300-1,400 crore investment in capacity expansion.
  • September 2021: Orion Engineered Carbon began construction of a new plant in Huaibei, China (65-70,000 tons capacity).
  • March 2022: Orion Engineered Carbon commenced commercial sales from its Ravenna, Italy, plant (25,000 tons capacity).

In-Depth Rubber Carbon Black Market Outlook

The Rubber Carbon Black market exhibits strong growth potential, driven by technological advancements, increasing demand from key sectors, and expansion into new markets. Strategic investments in R&D, sustainable production methods, and capacity expansion will be crucial for capturing market share and navigating competitive pressures. The long-term outlook is positive, with significant growth opportunities across various segments and geographies.

Rubber Carbon Black Market Segmentation

  • 1. Application
    • 1.1. Tires
    • 1.2. Hoses
    • 1.3. Belts
    • 1.4. Gaskets
    • 1.5. Vibration Control
    • 1.6. Footwear

Rubber Carbon Black Market Segmentation By Geography

  • 1. Asia Pacific
    • 1.1. China
    • 1.2. India
    • 1.3. Japan
    • 1.4. South Korea
    • 1.5. Rest of Asia Pacific
  • 2. North America
    • 2.1. United States
    • 2.2. Canada
    • 2.3. Mexico
  • 3. Europe
    • 3.1. Germany
    • 3.2. United Kingdom
    • 3.3. Italy
    • 3.4. Russia
    • 3.5. France
    • 3.6. Spain
    • 3.7. Turkey
    • 3.8. Rest of Europe
  • 4. South America
    • 4.1. Brazil
    • 4.2. Argentina
    • 4.3. Rest of South America
  • 5. Middle East and Africa
    • 5.1. Saudi Arabia
    • 5.2. South Africa
    • 5.3. Rest of Middle East and Africa
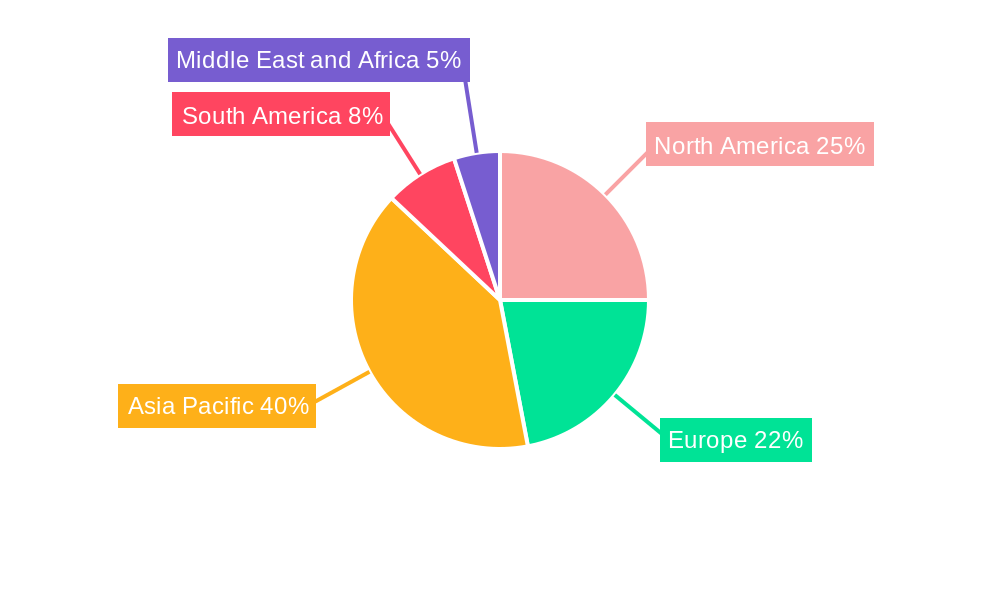
Rubber Carbon Black Market Regional Share


Rubber Carbon Black Market REPORT HIGHLIGHTS

AspectsDetails
Study Period 2019-2033
Base Year 2024
Estimated Year 2025
Forecast Period2025-2033
Historical Period2019-2024
Growth RateCAGR of > 3.00% from 2019-2033
Segmentation
    • By Application
      • Tires
      • Hoses
      • Belts
      • Gaskets
      • Vibration Control
      • Footwear
  • By Geography
    • Asia Pacific
      • China
      • India
      • Japan
      • South Korea
      • Rest of Asia Pacific
    • North America
      • United States
      • Canada
      • Mexico
    • Europe
      • Germany
      • United Kingdom
      • Italy
      • Russia
      • France
      • Spain
      • Turkey
      • Rest of Europe
    • South America
      • Brazil
      • Argentina
      • Rest of South America
    • Middle East and Africa
      • Saudi Arabia
      • South Africa
      • Rest of Middle East and Africa


Table of Contents

  1. 1. Introduction
    • 1.1. Research Scope
    • 1.2. Market Segmentation
    • 1.3. Research Methodology
    • 1.4. Definitions and Assumptions
  2. 2. Executive Summary
    • 2.1. Introduction
  3. 3. Market Dynamics
    • 3.1. Introduction
      • 3.2. Market Drivers
        • 3.2.1. Increasing Demand for Automotive Tires; Increasing Demand for Carbon Black in Industrial Rubber Applications
      • 3.3. Market Restrains
        • 3.3.1. Fluctuation In Prices of Oil Derived Feedstocks Used for Carbon Black Manufacturing; Increasing Use of Green Tires; Growing Environmental Concerns Regarding Emissions of Harmful Particulate Matter During The Production Of Carbon Black
      • 3.4. Market Trends
        • 3.4.1. Increasing Demand for Automotive Tires
  4. 4. Market Factor Analysis
    • 4.1. Porters Five Forces
    • 4.2. Supply/Value Chain
    • 4.3. PESTEL analysis
    • 4.4. Market Entropy
    • 4.5. Patent/Trademark Analysis
  5. 5. Global Rubber Carbon Black Market Analysis, Insights and Forecast, 2019-2031
    • 5.1. Market Analysis, Insights and Forecast - by Application
      • 5.1.1. Tires
      • 5.1.2. Hoses
      • 5.1.3. Belts
      • 5.1.4. Gaskets
      • 5.1.5. Vibration Control
      • 5.1.6. Footwear
    • 5.2. Market Analysis, Insights and Forecast - by Region
      • 5.2.1. Asia Pacific
      • 5.2.2. North America
      • 5.2.3. Europe
      • 5.2.4. South America
      • 5.2.5. Middle East and Africa
  6. 6. Asia Pacific Rubber Carbon Black Market Analysis, Insights and Forecast, 2019-2031
    • 6.1. Market Analysis, Insights and Forecast - by Application
      • 6.1.1. Tires
      • 6.1.2. Hoses
      • 6.1.3. Belts
      • 6.1.4. Gaskets
      • 6.1.5. Vibration Control
      • 6.1.6. Footwear
  7. 7. North America Rubber Carbon Black Market Analysis, Insights and Forecast, 2019-2031
    • 7.1. Market Analysis, Insights and Forecast - by Application
      • 7.1.1. Tires
      • 7.1.2. Hoses
      • 7.1.3. Belts
      • 7.1.4. Gaskets
      • 7.1.5. Vibration Control
      • 7.1.6. Footwear
  8. 8. Europe Rubber Carbon Black Market Analysis, Insights and Forecast, 2019-2031
    • 8.1. Market Analysis, Insights and Forecast - by Application
      • 8.1.1. Tires
      • 8.1.2. Hoses
      • 8.1.3. Belts
      • 8.1.4. Gaskets
      • 8.1.5. Vibration Control
      • 8.1.6. Footwear
  9. 9. South America Rubber Carbon Black Market Analysis, Insights and Forecast, 2019-2031
    • 9.1. Market Analysis, Insights and Forecast - by Application
      • 9.1.1. Tires
      • 9.1.2. Hoses
      • 9.1.3. Belts
      • 9.1.4. Gaskets
      • 9.1.5. Vibration Control
      • 9.1.6. Footwear
  10. 10. Middle East and Africa Rubber Carbon Black Market Analysis, Insights and Forecast, 2019-2031
    • 10.1. Market Analysis, Insights and Forecast - by Application
      • 10.1.1. Tires
      • 10.1.2. Hoses
      • 10.1.3. Belts
      • 10.1.4. Gaskets
      • 10.1.5. Vibration Control
      • 10.1.6. Footwear
  11. 11. Asia Pacific Rubber Carbon Black Market Analysis, Insights and Forecast, 2019-2031
      • 11.1. Market Analysis, Insights and Forecast - By Country/Sub-region
        • 11.1.1 China
        • 11.1.2 India
        • 11.1.3 Japan
        • 11.1.4 South Korea
        • 11.1.5 Rest of Asia Pacific
  12. 12. North America Rubber Carbon Black Market Analysis, Insights and Forecast, 2019-2031
      • 12.1. Market Analysis, Insights and Forecast - By Country/Sub-region
        • 12.1.1 United States
        • 12.1.2 Canada
        • 12.1.3 Mexico
  13. 13. Europe Rubber Carbon Black Market Analysis, Insights and Forecast, 2019-2031
      • 13.1. Market Analysis, Insights and Forecast - By Country/Sub-region
        • 13.1.1 Germany
        • 13.1.2 United Kingdom
        • 13.1.3 Italy
        • 13.1.4 Russia
        • 13.1.5 France
        • 13.1.6 Spain
        • 13.1.7 Turkey
        • 13.1.8 Rest of Europe
  14. 14. South America Rubber Carbon Black Market Analysis, Insights and Forecast, 2019-2031
      • 14.1. Market Analysis, Insights and Forecast - By Country/Sub-region
        • 14.1.1 Brazil
        • 14.1.2 Argentina
        • 14.1.3 Rest of South America
  15. 15. Middle East and Africa Rubber Carbon Black Market Analysis, Insights and Forecast, 2019-2031
      • 15.1. Market Analysis, Insights and Forecast - By Country/Sub-region
        • 15.1.1 Saudi Arabia
        • 15.1.2 South Africa
        • 15.1.3 Rest of Middle East and Africa
  16. 16. Competitive Analysis
    • 16.1. Global Market Share Analysis 2024
      • 16.2. Company Profiles
        • 16.2.1 Tokai Carbon Co Ltd
          • 16.2.1.1. Overview
          • 16.2.1.2. Products
          • 16.2.1.3. SWOT Analysis
          • 16.2.1.4. Recent Developments
          • 16.2.1.5. Financials (Based on Availability)
        • 16.2.2 Omsk Carbon Group
          • 16.2.2.1. Overview
          • 16.2.2.2. Products
          • 16.2.2.3. SWOT Analysis
          • 16.2.2.4. Recent Developments
          • 16.2.2.5. Financials (Based on Availability)
        • 16.2.3 Mitsubishi Chemical Corporation
          • 16.2.3.1. Overview
          • 16.2.3.2. Products
          • 16.2.3.3. SWOT Analysis
          • 16.2.3.4. Recent Developments
          • 16.2.3.5. Financials (Based on Availability)
        • 16.2.4 Orion Engineered Carbons GmbH
          • 16.2.4.1. Overview
          • 16.2.4.2. Products
          • 16.2.4.3. SWOT Analysis
          • 16.2.4.4. Recent Developments
          • 16.2.4.5. Financials (Based on Availability)
        • 16.2.5 Jiangxi Black Cat Carbon Black Co Ltd
          • 16.2.5.1. Overview
          • 16.2.5.2. Products
          • 16.2.5.3. SWOT Analysis
          • 16.2.5.4. Recent Developments
          • 16.2.5.5. Financials (Based on Availability)
        • 16.2.6 NNPC
          • 16.2.6.1. Overview
          • 16.2.6.2. Products
          • 16.2.6.3. SWOT Analysis
          • 16.2.6.4. Recent Developments
          • 16.2.6.5. Financials (Based on Availability)
        • 16.2.7 ASAHI CARBON Co Ltd
          • 16.2.7.1. Overview
          • 16.2.7.2. Products
          • 16.2.7.3. SWOT Analysis
          • 16.2.7.4. Recent Developments
          • 16.2.7.5. Financials (Based on Availability)
        • 16.2.8 Cabot Corporation
          • 16.2.8.1. Overview
          • 16.2.8.2. Products
          • 16.2.8.3. SWOT Analysis
          • 16.2.8.4. Recent Developments
          • 16.2.8.5. Financials (Based on Availability)
        • 16.2.9 Himadri Speciality Chemical Ltd
          • 16.2.9.1. Overview
          • 16.2.9.2. Products
          • 16.2.9.3. SWOT Analysis
          • 16.2.9.4. Recent Developments
          • 16.2.9.5. Financials (Based on Availability)
        • 16.2.10 Longxing Chemical Stock Co Ltd
          • 16.2.10.1. Overview
          • 16.2.10.2. Products
          • 16.2.10.3. SWOT Analysis
          • 16.2.10.4. Recent Developments
          • 16.2.10.5. Financials (Based on Availability)
        • 16.2.11 International CSRC Investment Holdings Co Ltd
          • 16.2.11.1. Overview
          • 16.2.11.2. Products
          • 16.2.11.3. SWOT Analysis
          • 16.2.11.4. Recent Developments
          • 16.2.11.5. Financials (Based on Availability)
        • 16.2.12 PCBL*List Not Exhaustive
          • 16.2.12.1. Overview
          • 16.2.12.2. Products
          • 16.2.12.3. SWOT Analysis
          • 16.2.12.4. Recent Developments
          • 16.2.12.5. Financials (Based on Availability)
        • 16.2.13 OCI Company Ltd
          • 16.2.13.1. Overview
          • 16.2.13.2. Products
          • 16.2.13.3. SWOT Analysis
          • 16.2.13.4. Recent Developments
          • 16.2.13.5. Financials (Based on Availability)
        • 16.2.14 Birla Carbon (Aditya Birla Group)
          • 16.2.14.1. Overview
          • 16.2.14.2. Products
          • 16.2.14.3. SWOT Analysis
          • 16.2.14.4. Recent Developments
          • 16.2.14.5. Financials (Based on Availability)

List of Figures

  1. Figure 1: Global Rubber Carbon Black Market Revenue Breakdown (Million, %) by Region 2024 & 2032
  2. Figure 2: Asia Pacific Rubber Carbon Black Market Revenue (Million), by Country 2024 & 2032
  3. Figure 3: Asia Pacific Rubber Carbon Black Market Revenue Share (%), by Country 2024 & 2032
  4. Figure 4: North America Rubber Carbon Black Market Revenue (Million), by Country 2024 & 2032
  5. Figure 5: North America Rubber Carbon Black Market Revenue Share (%), by Country 2024 & 2032
  6. Figure 6: Europe Rubber Carbon Black Market Revenue (Million), by Country 2024 & 2032
  7. Figure 7: Europe Rubber Carbon Black Market Revenue Share (%), by Country 2024 & 2032
  8. Figure 8: South America Rubber Carbon Black Market Revenue (Million), by Country 2024 & 2032
  9. Figure 9: South America Rubber Carbon Black Market Revenue Share (%), by Country 2024 & 2032
  10. Figure 10: Middle East and Africa Rubber Carbon Black Market Revenue (Million), by Country 2024 & 2032
  11. Figure 11: Middle East and Africa Rubber Carbon Black Market Revenue Share (%), by Country 2024 & 2032
  12. Figure 12: Asia Pacific Rubber Carbon Black Market Revenue (Million), by Application 2024 & 2032
  13. Figure 13: Asia Pacific Rubber Carbon Black Market Revenue Share (%), by Application 2024 & 2032
  14. Figure 14: Asia Pacific Rubber Carbon Black Market Revenue (Million), by Country 2024 & 2032
  15. Figure 15: Asia Pacific Rubber Carbon Black Market Revenue Share (%), by Country 2024 & 2032
  16. Figure 16: North America Rubber Carbon Black Market Revenue (Million), by Application 2024 & 2032
  17. Figure 17: North America Rubber Carbon Black Market Revenue Share (%), by Application 2024 & 2032
  18. Figure 18: North America Rubber Carbon Black Market Revenue (Million), by Country 2024 & 2032
  19. Figure 19: North America Rubber Carbon Black Market Revenue Share (%), by Country 2024 & 2032
  20. Figure 20: Europe Rubber Carbon Black Market Revenue (Million), by Application 2024 & 2032
  21. Figure 21: Europe Rubber Carbon Black Market Revenue Share (%), by Application 2024 & 2032
  22. Figure 22: Europe Rubber Carbon Black Market Revenue (Million), by Country 2024 & 2032
  23. Figure 23: Europe Rubber Carbon Black Market Revenue Share (%), by Country 2024 & 2032
  24. Figure 24: South America Rubber Carbon Black Market Revenue (Million), by Application 2024 & 2032
  25. Figure 25: South America Rubber Carbon Black Market Revenue Share (%), by Application 2024 & 2032
  26. Figure 26: South America Rubber Carbon Black Market Revenue (Million), by Country 2024 & 2032
  27. Figure 27: South America Rubber Carbon Black Market Revenue Share (%), by Country 2024 & 2032
  28. Figure 28: Middle East and Africa Rubber Carbon Black Market Revenue (Million), by Application 2024 & 2032
  29. Figure 29: Middle East and Africa Rubber Carbon Black Market Revenue Share (%), by Application 2024 & 2032
  30. Figure 30: Middle East and Africa Rubber Carbon Black Market Revenue (Million), by Country 2024 & 2032
  31. Figure 31: Middle East and Africa Rubber Carbon Black Market Revenue Share (%), by Country 2024 & 2032

List of Tables

  1. Table 1: Global Rubber Carbon Black Market Revenue Million Forecast, by Region 2019 & 2032
  2. Table 2: Global Rubber Carbon Black Market Revenue Million Forecast, by Application 2019 & 2032
  3. Table 3: Global Rubber Carbon Black Market Revenue Million Forecast, by Region 2019 & 2032
  4. Table 4: Global Rubber Carbon Black Market Revenue Million Forecast, by Country 2019 & 2032
  5. Table 5: China Rubber Carbon Black Market Revenue (Million) Forecast, by Application 2019 & 2032
  6. Table 6: India Rubber Carbon Black Market Revenue (Million) Forecast, by Application 2019 & 2032
  7. Table 7: Japan Rubber Carbon Black Market Revenue (Million) Forecast, by Application 2019 & 2032
  8. Table 8: South Korea Rubber Carbon Black Market Revenue (Million) Forecast, by Application 2019 & 2032
  9. Table 9: Rest of Asia Pacific Rubber Carbon Black Market Revenue (Million) Forecast, by Application 2019 & 2032
  10. Table 10: Global Rubber Carbon Black Market Revenue Million Forecast, by Country 2019 & 2032
  11. Table 11: United States Rubber Carbon Black Market Revenue (Million) Forecast, by Application 2019 & 2032
  12. Table 12: Canada Rubber Carbon Black Market Revenue (Million) Forecast, by Application 2019 & 2032
  13. Table 13: Mexico Rubber Carbon Black Market Revenue (Million) Forecast, by Application 2019 & 2032
  14. Table 14: Global Rubber Carbon Black Market Revenue Million Forecast, by Country 2019 & 2032
  15. Table 15: Germany Rubber Carbon Black Market Revenue (Million) Forecast, by Application 2019 & 2032
  16. Table 16: United Kingdom Rubber Carbon Black Market Revenue (Million) Forecast, by Application 2019 & 2032
  17. Table 17: Italy Rubber Carbon Black Market Revenue (Million) Forecast, by Application 2019 & 2032
  18. Table 18: Russia Rubber Carbon Black Market Revenue (Million) Forecast, by Application 2019 & 2032
  19. Table 19: France Rubber Carbon Black Market Revenue (Million) Forecast, by Application 2019 & 2032
  20. Table 20: Spain Rubber Carbon Black Market Revenue (Million) Forecast, by Application 2019 & 2032
  21. Table 21: Turkey Rubber Carbon Black Market Revenue (Million) Forecast, by Application 2019 & 2032
  22. Table 22: Rest of Europe Rubber Carbon Black Market Revenue (Million) Forecast, by Application 2019 & 2032
  23. Table 23: Global Rubber Carbon Black Market Revenue Million Forecast, by Country 2019 & 2032
  24. Table 24: Brazil Rubber Carbon Black Market Revenue (Million) Forecast, by Application 2019 & 2032
  25. Table 25: Argentina Rubber Carbon Black Market Revenue (Million) Forecast, by Application 2019 & 2032
  26. Table 26: Rest of South America Rubber Carbon Black Market Revenue (Million) Forecast, by Application 2019 & 2032
  27. Table 27: Global Rubber Carbon Black Market Revenue Million Forecast, by Country 2019 & 2032
  28. Table 28: Saudi Arabia Rubber Carbon Black Market Revenue (Million) Forecast, by Application 2019 & 2032
  29. Table 29: South Africa Rubber Carbon Black Market Revenue (Million) Forecast, by Application 2019 & 2032
  30. Table 30: Rest of Middle East and Africa Rubber Carbon Black Market Revenue (Million) Forecast, by Application 2019 & 2032
  31. Table 31: Global Rubber Carbon Black Market Revenue Million Forecast, by Application 2019 & 2032
  32. Table 32: Global Rubber Carbon Black Market Revenue Million Forecast, by Country 2019 & 2032
  33. Table 33: China Rubber Carbon Black Market Revenue (Million) Forecast, by Application 2019 & 2032
  34. Table 34: India Rubber Carbon Black Market Revenue (Million) Forecast, by Application 2019 & 2032
  35. Table 35: Japan Rubber Carbon Black Market Revenue (Million) Forecast, by Application 2019 & 2032
  36. Table 36: South Korea Rubber Carbon Black Market Revenue (Million) Forecast, by Application 2019 & 2032
  37. Table 37: Rest of Asia Pacific Rubber Carbon Black Market Revenue (Million) Forecast, by Application 2019 & 2032
  38. Table 38: Global Rubber Carbon Black Market Revenue Million Forecast, by Application 2019 & 2032
  39. Table 39: Global Rubber Carbon Black Market Revenue Million Forecast, by Country 2019 & 2032
  40. Table 40: United States Rubber Carbon Black Market Revenue (Million) Forecast, by Application 2019 & 2032
  41. Table 41: Canada Rubber Carbon Black Market Revenue (Million) Forecast, by Application 2019 & 2032
  42. Table 42: Mexico Rubber Carbon Black Market Revenue (Million) Forecast, by Application 2019 & 2032
  43. Table 43: Global Rubber Carbon Black Market Revenue Million Forecast, by Application 2019 & 2032
  44. Table 44: Global Rubber Carbon Black Market Revenue Million Forecast, by Country 2019 & 2032
  45. Table 45: Germany Rubber Carbon Black Market Revenue (Million) Forecast, by Application 2019 & 2032
  46. Table 46: United Kingdom Rubber Carbon Black Market Revenue (Million) Forecast, by Application 2019 & 2032
  47. Table 47: Italy Rubber Carbon Black Market Revenue (Million) Forecast, by Application 2019 & 2032
  48. Table 48: Russia Rubber Carbon Black Market Revenue (Million) Forecast, by Application 2019 & 2032
  49. Table 49: France Rubber Carbon Black Market Revenue (Million) Forecast, by Application 2019 & 2032
  50. Table 50: Spain Rubber Carbon Black Market Revenue (Million) Forecast, by Application 2019 & 2032
  51. Table 51: Turkey Rubber Carbon Black Market Revenue (Million) Forecast, by Application 2019 & 2032
  52. Table 52: Rest of Europe Rubber Carbon Black Market Revenue (Million) Forecast, by Application 2019 & 2032
  53. Table 53: Global Rubber Carbon Black Market Revenue Million Forecast, by Application 2019 & 2032
  54. Table 54: Global Rubber Carbon Black Market Revenue Million Forecast, by Country 2019 & 2032
  55. Table 55: Brazil Rubber Carbon Black Market Revenue (Million) Forecast, by Application 2019 & 2032
  56. Table 56: Argentina Rubber Carbon Black Market Revenue (Million) Forecast, by Application 2019 & 2032
  57. Table 57: Rest of South America Rubber Carbon Black Market Revenue (Million) Forecast, by Application 2019 & 2032
  58. Table 58: Global Rubber Carbon Black Market Revenue Million Forecast, by Application 2019 & 2032
  59. Table 59: Global Rubber Carbon Black Market Revenue Million Forecast, by Country 2019 & 2032
  60. Table 60: Saudi Arabia Rubber Carbon Black Market Revenue (Million) Forecast, by Application 2019 & 2032
  61. Table 61: South Africa Rubber Carbon Black Market Revenue (Million) Forecast, by Application 2019 & 2032
  62. Table 62: Rest of Middle East and Africa Rubber Carbon Black Market Revenue (Million) Forecast, by Application 2019 & 2032


Frequently Asked Questions

1. What is the projected Compound Annual Growth Rate (CAGR) of the Rubber Carbon Black Market?

The projected CAGR is approximately > 3.00%.

2. Which companies are prominent players in the Rubber Carbon Black Market?

Key companies in the market include Tokai Carbon Co Ltd, Omsk Carbon Group, Mitsubishi Chemical Corporation, Orion Engineered Carbons GmbH, Jiangxi Black Cat Carbon Black Co Ltd, NNPC, ASAHI CARBON Co Ltd, Cabot Corporation, Himadri Speciality Chemical Ltd, Longxing Chemical Stock Co Ltd, International CSRC Investment Holdings Co Ltd, PCBL*List Not Exhaustive, OCI Company Ltd, Birla Carbon (Aditya Birla Group).

3. What are the main segments of the Rubber Carbon Black Market?

The market segments include Application.

4. Can you provide details about the market size?

The market size is estimated to be USD XX Million as of 2022.

5. What are some drivers contributing to market growth?

Increasing Demand for Automotive Tires; Increasing Demand for Carbon Black in Industrial Rubber Applications.

6. What are the notable trends driving market growth?

Increasing Demand for Automotive Tires.

7. Are there any restraints impacting market growth?

Fluctuation In Prices of Oil Derived Feedstocks Used for Carbon Black Manufacturing; Increasing Use of Green Tires; Growing Environmental Concerns Regarding Emissions of Harmful Particulate Matter During The Production Of Carbon Black.

8. Can you provide examples of recent developments in the market?

In March 2022, Orion Engineered Carbon started commercial sales from its new carbon black production site in Ravenna, Italy. The site produces technical rubber carbon blacks for the European market and has a production capacity of 25,000 tons.

9. What pricing options are available for accessing the report?

Pricing options include single-user, multi-user, and enterprise licenses priced at USD 4750, USD 5250, and USD 8750 respectively.

10. Is the market size provided in terms of value or volume?

The market size is provided in terms of value, measured in Million.

11. Are there any specific market keywords associated with the report?

Yes, the market keyword associated with the report is "Rubber Carbon Black Market," which aids in identifying and referencing the specific market segment covered.

12. How do I determine which pricing option suits my needs best?

The pricing options vary based on user requirements and access needs. Individual users may opt for single-user licenses, while businesses requiring broader access may choose multi-user or enterprise licenses for cost-effective access to the report.

13. Are there any additional resources or data provided in the Rubber Carbon Black Market report?

While the report offers comprehensive insights, it's advisable to review the specific contents or supplementary materials provided to ascertain if additional resources or data are available.

14. How can I stay updated on further developments or reports in the Rubber Carbon Black Market?

To stay informed about further developments, trends, and reports in the Rubber Carbon Black Market, consider subscribing to industry newsletters, following relevant companies and organizations, or regularly checking reputable industry news sources and publications.


Methodology

Step 1 - Identification of Relevant Samples Size from Population Database

Step Chart
Bar Chart
Method Chart

Step 2 - Approaches for Defining Global Market Size (Value, Volume* & Price*)

Approach Chart
Top-down and bottom-up approaches are used to validate the global market size and estimate the market size for manufactures, regional segments, product, and application.

Note*: In applicable scenarios

Step 3 - Data Sources

Primary Research

  • Web Analytics
  • Survey Reports
  • Research Institute
  • Latest Research Reports
  • Opinion Leaders

Secondary Research

  • Annual Reports
  • White Paper
  • Latest Press Release
  • Industry Association
  • Paid Database
  • Investor Presentations
Analyst Chart

Step 4 - Data Triangulation

Involves using different sources of information in order to increase the validity of a study

These sources are likely to be stakeholders in a program - participants, other researchers, program staff, other community members, and so on.

Then we put all data in single framework & apply various statistical tools to find out the dynamic on the market.

During the analysis stage, feedback from the stakeholder groups would be compared to determine areas of agreement as well as areas of divergence

Additionally, after gathering mixed and scattered data from a wide range of sources, data is triangulated and correlated to come up with estimated figures which are further validated through primary mediums or industry experts, opinion leaders.

About Visionary Data Reports

Visionary Data Reports provides future-focused market research, advanced analytics, and strategic insights for technology, healthcare, green energy, and finance. Our reports help you anticipate trends, innovate, and lead in your industry. Our expert team combines primary research, data science, and industry knowledge to deliver actionable intelligence. We offer syndicated reports, custom analytics, and consulting services tailored to your business needs. At Visionary Data Reports, we are committed to quality, transparency, and client satisfaction. Every report is rigorously validated to ensure accuracy and relevance. Our global perspective and forward-thinking approach help you understand both current and emerging market dynamics.

Stay ahead with Visionary Data Reports. Subscribe to our newsletter for the latest insights and research highlights, and follow us on social media for real-time updates. Visionary Data Reports – Your Guide to Tomorrow’s Opportunities.

  • Home
  • About Us
  • Industries
    • Packaging
    • Automotive
    • Home and Property Improvement
    • Retail
    • Energy & Power
    • Food & Beverage
    • Real Estate and Construction
    • Hospitality and Tourism
    • Agriculture
    • Manufacturing Products and Services
    • Healthcare
    • Logistics
    • Aerospace & Defense
    • Chemicals & Materials
    • Professional and Commercial Services
    • Financial Services and Investment Intelligence
    • Consumer Goods and Services
    • Animal Nutrition & Wellness
    • Technology, Media and Telecom
  • Services
  • Contact
Main Logo
  • Home
  • About Us
  • Industries
    • Packaging
    • Automotive
    • Home and Property Improvement
    • Retail
    • Energy & Power
    • Food & Beverage
    • Real Estate and Construction
    • Hospitality and Tourism
    • Agriculture
    • Manufacturing Products and Services
    • Healthcare
    • Logistics
    • Aerospace & Defense
    • Chemicals & Materials
    • Professional and Commercial Services
    • Financial Services and Investment Intelligence
    • Consumer Goods and Services
    • Animal Nutrition & Wellness
    • Technology, Media and Telecom
  • Services
  • Contact
+17162654855
[email protected]

+17162654855

[email protected]

Business Address

Head Office

Ansec House 3 rd floor Tank Road, Yerwada, Pune, Maharashtra 411014

Contact Information

Craig Francis

Business Development Head

+17162654855

[email protected]

Secure Payment Partners

payment image
RetailPackagingLogisticsAutomotiveHealthcareAgricultureEnergy & PowerFood & BeverageAerospace & DefenseChemicals & MaterialsHospitality and TourismConsumer Goods and ServicesAnimal Nutrition & WellnessReal Estate and ConstructionHome and Property ImprovementTechnology, Media and TelecomManufacturing Products and ServicesFinancial Services and Investment Intelligence

© 2025 PRDUA Research & Media Private Limited, All rights reserved

Privacy Policy
Terms and Conditions
FAQ
artwork spiralartwork spiralRelated Reports
artwork underline

Future Trends Shaping Bleaching Clay Market Growth

Explore the growing Bleaching Clay market, driven by demand in food, cosmetics, and chemicals. Discover key insights, growth drivers, and regional trends for this essential purification agent.

December 2025
Base Year: 2024
No Of Pages: 180
Price: $4750

Understanding Growth Trends in Bio-based Polymers Market Market

Explore the booming Bio-based Polymers Market (2025-2033). Discover key drivers like sustainability, market size projections ($6.5B+ by 2025), CAGR of 24.30%, and growth segments including PLA, PHA, and Packaging.

December 2025
Base Year: 2024
No Of Pages: 180
Price: $4750

Understanding Growth Challenges in Extruded Plastics Market Market 2025-2033

Explore the dynamic Extruded Plastics Market analysis, revealing significant growth drivers, key trends, and market size projections driven by packaging, biomedical, and textile industries. Discover regional opportunities and leading companies shaping the future of extruded plastics.

December 2025
Base Year: 2024
No Of Pages: 234
Price: $4750

Market Projections for Base Metals Market Industry 2025-2033

Explore the global Base Metals Market analysis, growth drivers, key segments, and forecast to 2033. Discover trends in copper, zinc, aluminum, and more for construction, automotive, and electronics.

November 2025
Base Year: 2024
No Of Pages: 180
Price: $4750

Growth Trajectories in North America Cyanoacrylate Adhesives Market: Industry Outlook to 2033

Explore the dynamic North America Cyanoacrylate Adhesives Market analysis, highlighting key growth drivers, product segments, and industry trends. Discover market size, CAGR, and forecast data for 2025-2033.

November 2025
Base Year: 2024
No Of Pages: 234
Price: $4750

Canada Bioplastics Market: Harnessing Emerging Innovations for Growth 2025-2033

The size of the Canada Bioplastics Market market was valued at USD XX Million in 2024 and is projected to reach USD XXX Million by 2033, with an expected CAGR of 13.85% during the forecast period.

November 2025
Base Year: 2024
No Of Pages: 120
Price: $3800

Thin Film Materials Market Market Overview: Growth and Insights

Explore the dynamic Thin Film Materials Market forecast (2025-2033). Discover key drivers, restraints, trends, and market size with a CAGR > 4%. Insights into CIGS, CdTe, a-Si, PV cells, semiconductors, and MEMS applications.

November 2025
Base Year: 2024
No Of Pages: 180
Price: $4750

Analyzing Competitor Moves: Sizing Agent Industry Growth Outlook 2025-2033

Explore the global sizing agent market analysis, detailing size, CAGR, drivers, trends, and key players. Discover insights into the textile, paper, and food industries' demand for sizing solutions.

November 2025
Base Year: 2024
No Of Pages: 180
Price: $4750

Asia-Pacific Flooring Resins Market 2025-2033 Overview: Trends, Dynamics, and Growth Opportunities

The size of the Asia-Pacific Flooring Resins Market market was valued at USD XX Million in 2024 and is projected to reach USD XXX Million by 2033, with an expected CAGR of 6% during the forecast period.

November 2025
Base Year: 2024
No Of Pages: 140
Price: $3800

Matting Agents Market Analysis 2025 and Forecasts 2033: Unveiling Growth Opportunities

Explore the growing global matting agents market, driven by coatings, inks, and evolving aesthetic demands. Discover key insights, market size, CAGR, trends, and top companies shaping the future of surface finishes.

November 2025
Base Year: 2024
No Of Pages: 180
Price: $4750

India Hydrogen Peroxide Market Market’s Growth Catalysts

Explore the dynamic Indian Hydrogen Peroxide market, driven by disinfectant, bleaching, and chemical synthesis demands. Insights on market size, growth drivers, trends, and leading companies for 2025-2033.

November 2025
Base Year: 2024
No Of Pages: 197
Price: $3800

Market Projections for Coating Agents for Synthetic Leather Market Industry 2025-2033

The size of the Coating Agents for Synthetic Leather Market market was valued at USD XX Million in 2024 and is projected to reach USD XXX Million by 2033, with an expected CAGR of 7.00">> 7.00% during the forecast period.

November 2025
Base Year: 2024
No Of Pages: 234
Price: $4750

Cyanate Ester Resin Industry in Emerging Markets: Analysis and Projections 2025-2033

Explore the burgeoning Cyanate Ester Resin market, driven by aerospace, electronics, and automotive innovations. Discover market size, CAGR, key drivers, restraints, and regional trends shaping this high-performance material sector.

November 2025
Base Year: 2024
No Of Pages: 234
Price: $4750

Understanding Growth Trends in Isophorone Market Market

The size of the Isophorone Market market was valued at USD XX Million in 2024 and is projected to reach USD XXX Million by 2033, with an expected CAGR of 6.00">> 6.00% during the forecast period.

November 2025
Base Year: 2024
No Of Pages: 180
Price: $4750

Automotive Adhesives & Sealants Market and Emerging Technologies: Growth Insights 2025-2033

Explore the dynamic Automotive Adhesives & Sealants Market analysis, forecasts, key drivers, and trends. Discover market size, CAGR, resin and technology segments, and regional insights for global automotive manufacturing.

November 2025
Base Year: 2024
No Of Pages: 150
Price: $3800

Industrial Film Industry Industry’s Future Growth Prospects

Explore the dynamic Industrial Film market analysis, key growth drivers, emerging trends like sustainability, and restraints. Discover market size, CAGR, and regional insights from 2019-2033.

November 2025
Base Year: 2024
No Of Pages: 234
Price: $4750

Strategic Trends in Synthetic Diamond Industry Market 2025-2033

Explore the booming Synthetic Diamond Industry market size, CAGR, key drivers like electronics & jewelry, and future trends from 2025-2033. Get insights into HPHT, CVD, and regional growth.

November 2025
Base Year: 2024
No Of Pages: 234
Price: $4750

Emerging India Paints & Coatings Market Trends and Opportunities

The size of the India Paints & Coatings Market market was valued at USD 9.56 Million in 2024 and is projected to reach USD 17.91 Million by 2033, with an expected CAGR of 9.38% during the forecast period.

November 2025
Base Year: 2024
No Of Pages: 180
Price: $3800

MEA Polyurethane (PU) Adhesives Market Insights: Growth at XX CAGR Through 2033

The size of the MEA Polyurethane (PU) Adhesives Market market was valued at USD 0.79 Million in 2024 and is projected to reach USD 1.15 Million by 2033, with an expected CAGR of 5.50% during the forecast period.

November 2025
Base Year: 2024
No Of Pages: 234
Price: $4750

Strategic Vision for European Bioplastics Industry Market Expansion

The size of the European Bioplastics Industry market was valued at USD XX Million in 2024 and is projected to reach USD XXX Million by 2033, with an expected CAGR of 14.08% during the forecast period.

November 2025
Base Year: 2024
No Of Pages: 140
Price: $4750

Aluminum Recycling Market Market Expansion: Growth Outlook 2025-2033

The size of the Aluminum Recycling Market market was valued at USD XX Million in 2024 and is projected to reach USD XXX Million by 2033, with an expected CAGR of 4.83% during the forecast period.

November 2025
Base Year: 2024
No Of Pages: 180
Price: $4750

Asia-Pacific Hydrogen Peroxide Market to Grow at XX CAGR: Market Size Analysis and Forecasts 2025-2033

The size of the Asia-Pacific Hydrogen Peroxide Market market was valued at USD XX Million in 2024 and is projected to reach USD XXX Million by 2033, with an expected CAGR of 4.00">> 4.00% during the forecast period.

November 2025
Base Year: 2024
No Of Pages: 234
Price: $4750

Decoding Market Trends in Acetic Acid Industry: 2025-2033 Analysis

Explore the global Acetic Acid market's projected growth to $XX million by 2025, driven by VAM, PTA, plastics, and coatings demand. Understand key drivers, trends, restraints, and regional insights.

November 2025
Base Year: 2024
No Of Pages: 234
Price: $4750

Redispersible Polymer Powder Industry Market Growth Fueled by CAGR to XXX Million by 2033

Explore the booming Redispersible Polymer Powder market, driven by construction growth and innovation. Get insights into market size, CAGR (>5.00%), key trends, drivers, restraints, and regional dynamics.

November 2025
Base Year: 2024
No Of Pages: 234
Price: $4750

Innovations Driving Methyl Isobutyl Carbinol Market Market 2025-2033

The size of the Methyl Isobutyl Carbinol Market market was valued at USD XX Million in 2024 and is projected to reach USD XXX Million by 2033, with an expected CAGR of 3.00">> 3.00% during the forecast period.

October 2025
Base Year: 2024
No Of Pages: 180
Price: $4750

Key Drivers for Stone Coated Steel Roofing Market Market Growth: Projections 2025-2033

The size of the Stone Coated Steel Roofing Market market was valued at USD XX Million in 2024 and is projected to reach USD XXX Million by 2033, with an expected CAGR of 8.00">> 8.00% during the forecast period.

October 2025
Base Year: 2024
No Of Pages: 234
Price: $4750

Oriented Strand Board Market Industry’s Evolution and Growth Pathways

Explore the booming Oriented Strand Board (OSB) market forecast, key drivers, and regional growth. Discover CAGR trends, market size projections, and top companies in this essential construction and furniture material.

October 2025
Base Year: 2024
No Of Pages: 234
Price: $4750

Nitrile Butadiene Rubber Industry Unlocking Growth Potential: 2025-2033 Analysis and Forecasts

Explore the dynamic Nitrile Butadiene Rubber (NBR) market with a projected CAGR of 6.31%. Discover key drivers like automotive and construction, emerging trends, and regional growth forecasts for 2025-2033.

October 2025
Base Year: 2024
No Of Pages: 180
Price: $4750

Specialty Silica Industry Industry’s Evolution and Growth Pathways

Explore the growing Specialty Silica market with insights into its expansion drivers, key applications like rubber and personal care, and regional trends from 2025-2033.

October 2025
Base Year: 2024
No Of Pages: 234
Price: $4750

Emerging Opportunities in Heat Resistant Polymer Market Market

Explore the dynamic Heat Resistant Polymer Market, driven by automotive, aerospace, and electronics industries. Discover key insights, growth drivers, and future trends impacting this high-performance material sector.

October 2025
Base Year: 2024
No Of Pages: 234
Price: $4750

Antimicrobial Textile Industry Market Size and Trends 2025-2033: Comprehensive Outlook

Explore the robust growth of the Antimicrobial Textile market, driven by hygiene awareness. Discover key drivers, emerging trends like sustainable solutions, restraints, and segmental analysis in medical, apparel, and home textiles.

October 2025
Base Year: 2024
No Of Pages: 234
Price: $4750

Exploring Chromatography Reagents Market Growth Trajectories: CAGR Insights 2025-2033

Explore the dynamic Chromatography Reagents Market, projected to reach over USD 20 billion by 2033 with a CAGR exceeding 7%. Discover key drivers, segments, and leading companies shaping pharmaceutical, food, and environmental analysis.

October 2025
Base Year: 2024
No Of Pages: 180
Price: $4750

Exploring Key Trends in Fluorosilicone Market Market

Explore the dynamic Fluorosilicone market analysis, driven by demand from Oil & Gas, Automotive, and Aerospace industries. Discover key insights, growth drivers, restraints, and regional trends shaping the future of fluorosilicone materials from 2019-2033.

October 2025
Base Year: 2024
No Of Pages: 180
Price: $4750

Saudi Arabia Industrial Coatings Market Market Growth Fueled by CAGR to XXX Million by 2033

The size of the Saudi Arabia Industrial Coatings Market market was valued at USD XX Million in 2024 and is projected to reach USD XXX Million by 2033, with an expected CAGR of 3.50">> 3.50% during the forecast period.

October 2025
Base Year: 2024
No Of Pages: 180
Price: $3800

Exploring Key Dynamics of Isobutylene Market Industry

Explore the dynamic global Isobutylene market forecast from 2025-2033. Discover key drivers like automotive fuel additives and antioxidants, emerging trends, restraints, and regional insights.

October 2025
Base Year: 2024
No Of Pages: 234
Price: $4750

Growth Strategies in India Automotive Paints And Coatings Market Market: 2025-2033 Outlook

Explore the dynamic India automotive paints and coatings market, projected for significant growth to USD 608.17 million by 2033 with an 8.41% CAGR. Discover key drivers, resin types (Polyurethane, Epoxy, Acrylic), technologies (water-borne, solvent-borne), applications, and leading companies shaping the future of automotive finishes in India.

October 2025
Base Year: 2024
No Of Pages: 180
Price: $3800

Ordinary Portland Cement Market in Focus: Growth Trajectories and Strategic Insights 2025-2033

Explore the dynamic Ordinary Portland Cement market forecast (2025-2033) with projected growth, key drivers, and regional insights. Discover market size and CAGR trends for this essential construction material.

October 2025
Base Year: 2024
No Of Pages: 180
Price: $3800

Composite Materials in Renewable Energy Market Analysis 2025 and Forecasts 2033: Unveiling Growth Opportunities

Explore the dynamic Composite Materials in Renewable Energy Market, driven by solar and wind power growth. Discover key insights, market size, CAGR > 6.00%, drivers, trends, and leading companies.

October 2025
Base Year: 2024
No Of Pages: 234
Price: $4750

MCAA Market XX CAGR Growth Outlook 2025-2033

Explore the global Monochloroacetic Acid (MCAA) market analysis, including its $990.11 million size in 2025, 3.6% CAGR, key drivers like personal care & agrochemicals, and regional trends.

October 2025
Base Year: 2024
No Of Pages: 180
Price: $4750

Industrial Insulation Industry Dynamics and Forecasts: 2025-2033 Strategic Insights

Explore the booming Industrial Insulation market, projected to exceed USD 7.41 billion by 2025. Discover key drivers like energy efficiency, market trends in insulation materials and products, and growth opportunities across sectors like Oil & Gas, Chemical, and Automotive.

October 2025
Base Year: 2024
No Of Pages: 180
Price: $4750

Growth Catalysts in Polyethylene Foam Market Market

Explore the dynamic global Polyethylene Foam Market with insights into its significant growth, key drivers like automotive and construction demand, and future trends through 2033.

October 2025
Base Year: 2024
No Of Pages: 180
Price: $4750

Food Processing Lubricants Market Navigating Dynamics Comprehensive Analysis and Forecasts 2025-2033

Explore the dynamic Food Processing Lubricants Market, driven by safety standards and industry growth. Discover key drivers, trends, and forecasts from 2025-2033.

October 2025
Base Year: 2024
No Of Pages: 234
Price: $4750

APCA Fuel Additive Industry: Disruptive Technologies Driving Market Growth 2025-2033

Explore the booming Asia-Pacific Fuel Additive Market, projected to surpass USD 19,800 million by 2033 with a CAGR over 6.50%. Discover key drivers like emission regulations and demand for cleaner fuels, alongside market trends and restraints.

October 2025
Base Year: 2024
No Of Pages: 234
Price: $4750

Metal-faced Insulated Panels Industry: Growth Opportunities and Competitive Landscape Overview 2025-2033

Explore the booming Metal-faced Insulated Panels market! Discover key growth drivers, market trends, and segment analysis for energy-efficient construction solutions. Forecasts indicate substantial growth driven by sustainability and innovation in PU, PIR, and mineral wool panels.

October 2025
Base Year: 2024
No Of Pages: 180
Price: $4750

Asia-Pacific Industrial Flooring Market Market’s Consumer Preferences: Trends and Analysis 2025-2033

The size of the Asia-Pacific Industrial Flooring Market market was valued at USD XX Million in 2024 and is projected to reach USD XXX Million by 2033, with an expected CAGR of 6.00">> 6.00% during the forecast period.

October 2025
Base Year: 2024
No Of Pages: 150
Price: $4750

Europe Hydrogen Peroxide Market XX CAGR Growth to Drive Market Size to XXX Million by 2033

The size of the Europe Hydrogen Peroxide Market market was valued at USD 727.1 Million in 2024 and is projected to reach USD XXX Million by 2033, with an expected CAGR of 4.00">> 4.00% during the forecast period.

October 2025
Base Year: 2024
No Of Pages: 180
Price: $4750

Strategic Insights for Silica Market Market Expansion

Explore the dynamic Silica Market, projected to exceed $10 billion by 2033 with a CAGR over 4.00%. Discover key drivers, restraints, and growth opportunities in agriculture, automotive, cosmetics, and electronics.

October 2025
Base Year: 2024
No Of Pages: 150
Price: $4750

Exploring Consumer Shifts in Indonesia Adhesives and Sealants Market Market 2025-2033

The size of the Indonesia Adhesives and Sealants Market market was valued at USD XX Million in 2024 and is projected to reach USD XXX Million by 2033, with an expected CAGR of 6.66% during the forecast period.

October 2025
Base Year: 2024
No Of Pages: 150
Price: $3800

ASEAN Paints and Coatings Market Trends and Forecasts: Comprehensive Insights

Explore the dynamic ASEAN Paints and Coatings Market, forecast to exceed USD 15 Billion by 2025 with a CAGR over 4.00%. Discover key drivers like urbanization, infrastructure growth, and the shift towards sustainable coatings.

October 2025
Base Year: 2024
No Of Pages: 150
Price: $4750

Future-Ready Strategies for Healthcare Textiles Industry Market Growth

Explore the dynamic Healthcare Textiles market forecast, CAGR > 8.00%, driven by hygiene, chronic diseases, and advanced materials. Key insights on global trends and opportunities.

October 2025
Base Year: 2024
No Of Pages: 234
Price: $4750