

Key Insights
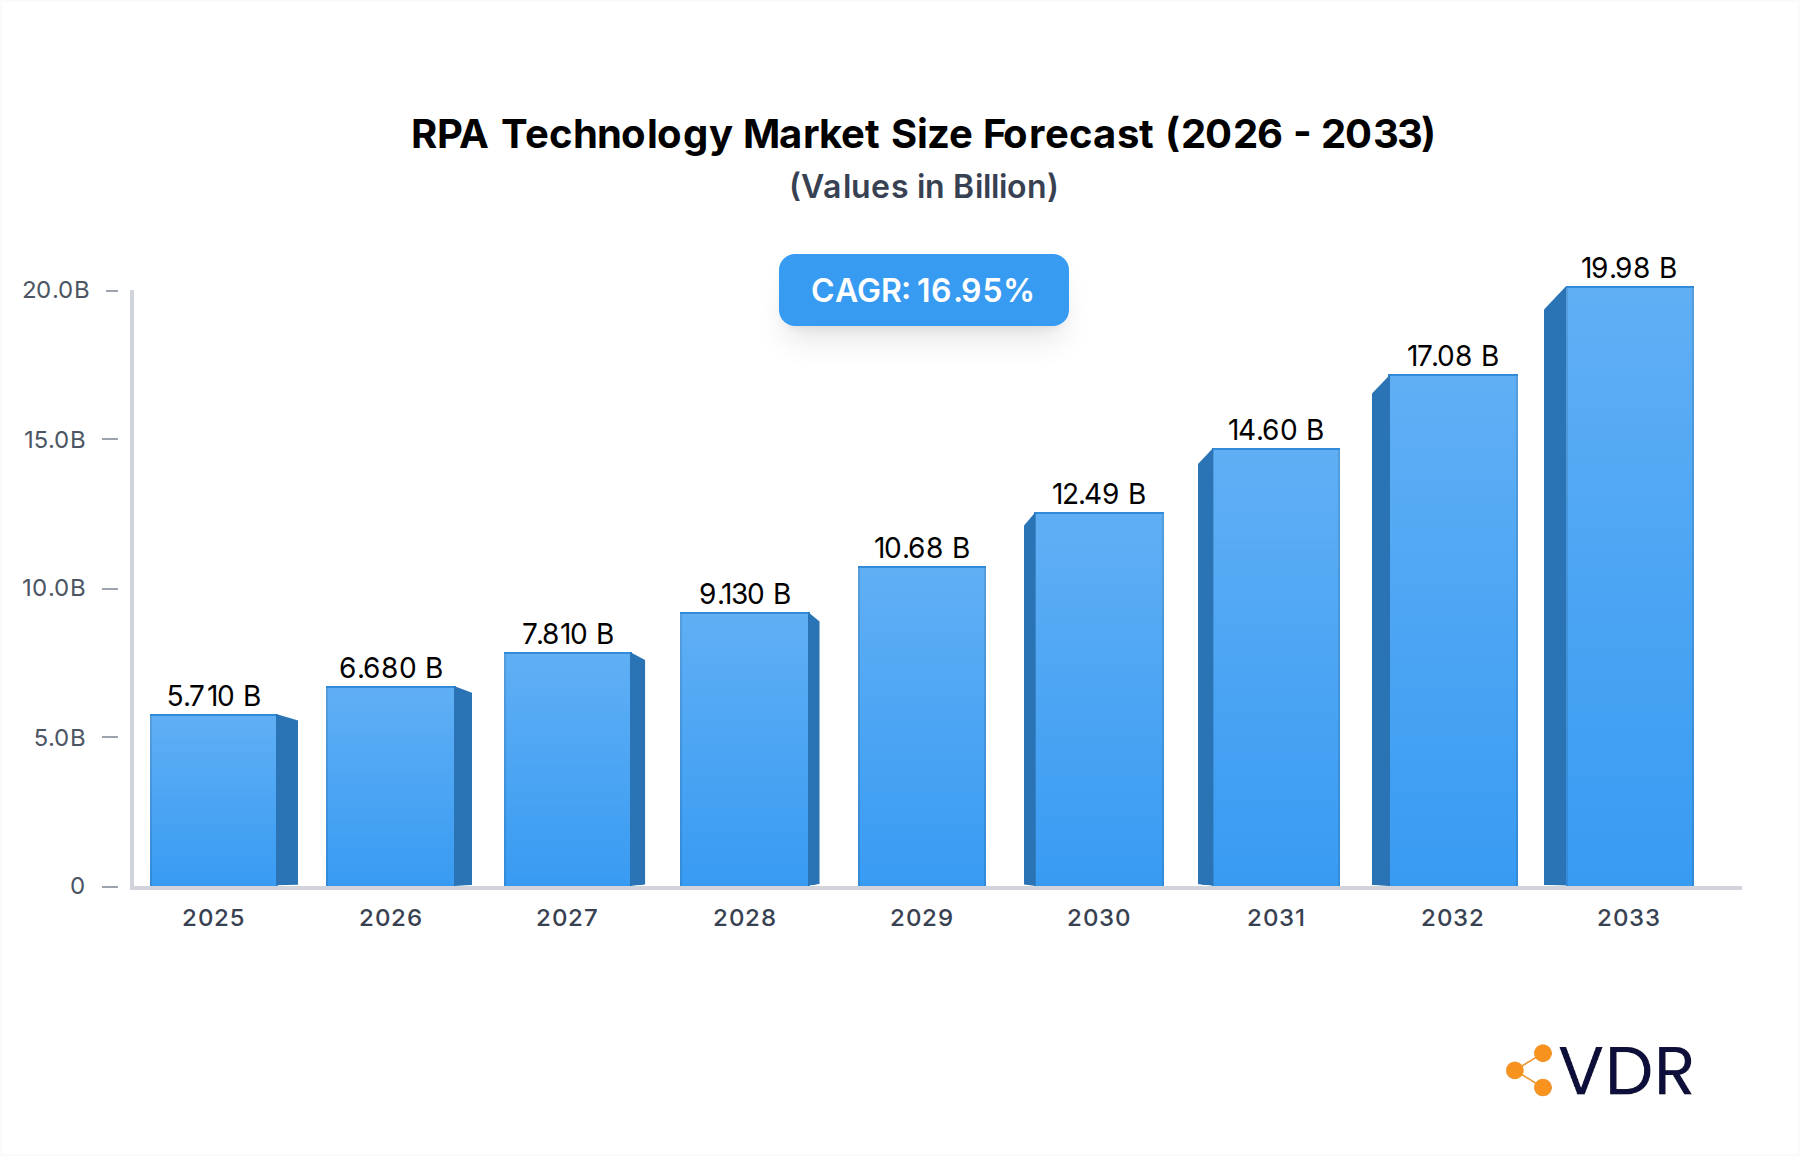
The Robotic Process Automation (RPA) technology market is poised for significant expansion, with a projected market size of USD 5.71 billion in 2025. This robust growth is fueled by an impressive CAGR of 16.9%, indicating a rapidly maturing and increasingly adopted technology. The primary drivers for this surge include the escalating need for operational efficiency, cost reduction, and enhanced accuracy across various industries. Businesses are leveraging RPA to automate repetitive, rule-based tasks, freeing up human capital for more strategic and value-added activities. The software and computer industries, in particular, are early adopters, integrating RPA into their workflows to streamline development processes, testing, and customer support. The evolution towards more sophisticated applications, including those in server environments, further broadens the market's reach and potential.

RPA Technology Market Size (In Billion)
The RPA market's trajectory is characterized by a dynamic interplay of drivers and restraints. While the benefits of automation, scalability, and improved compliance are strong growth catalysts, challenges such as the initial implementation costs, the need for skilled IT professionals, and concerns around data security and process complexity present hurdles. However, the continuous innovation in RPA platforms, including the integration of AI and machine learning for more intelligent automation, is rapidly addressing these limitations. Leading companies like PagerDuty, Celonis, and Blue Prism are at the forefront, developing advanced solutions that cater to diverse needs, from desktop automation to complex server-type deployments. The increasing adoption across North America, Europe, and the burgeoning Asia Pacific region highlights the global recognition of RPA as a critical tool for digital transformation.
RPA Technology Company Market Share
This in-depth report provides an exhaustive analysis of the global Robotic Process Automation (RPA) Technology market, covering dynamics, growth trends, regional dominance, product landscape, drivers, barriers, opportunities, and key players. Utilizing a robust study period from 2019–2033, with 2025 as the base and estimated year, and a forecast period of 2025–2033, this analysis offers critical insights for industry professionals, investors, and strategists navigating the evolving RPA ecosystem. The report delves into both parent and child market segments, offering a holistic view of market expansion and adoption.
RPA Technology Market Dynamics & Structure
The RPA Technology market is characterized by a dynamic interplay of technological innovation, evolving regulatory frameworks, and a competitive landscape featuring both established giants and agile challengers. Market concentration remains moderately fragmented, with key players like Celonis, Blue Prism, Laserfiche, HelpSystems, and Datamatics actively investing in research and development to maintain their competitive edge. Technological innovation is primarily driven by advancements in Artificial Intelligence (AI) and Machine Learning (ML), enabling more sophisticated automation capabilities and intelligent decision-making within RPA solutions.
- Technological Innovation Drivers: Integration of AI/ML for cognitive automation, enhanced bot management and orchestration platforms, low-code/no-code RPA development environments, and secure cloud-based RPA deployments.
- Regulatory Frameworks: Growing emphasis on data privacy regulations (e.g., GDPR, CCPA) and compliance requirements is shaping the development and deployment of RPA solutions, demanding robust security and audit trails.
- Competitive Product Substitutes: While direct substitutes are limited, advancements in Business Process Management (BPM) software and AI-powered cognitive automation platforms present potential overlaps and competitive pressures.
- End-User Demographics: A broad spectrum of end-users, from large enterprises across finance, healthcare, and manufacturing to small and medium-sized businesses (SMBs) seeking operational efficiency gains.
- M&A Trends: The market has witnessed significant M&A activity, with larger entities acquiring innovative startups to expand their capabilities and market reach. For instance, the acquisition of niche RPA providers by established software vendors aims to integrate RPA seamlessly into broader enterprise solutions. The volume of M&A deals is expected to remain robust, reflecting the strategic importance of RPA.
RPA Technology Growth Trends & Insights
The Robotic Process Automation (RPA) Technology market is poised for substantial expansion, driven by an ever-increasing demand for operational efficiency, cost reduction, and enhanced productivity across diverse industries. Leveraging the power of AI and ML, the market is witnessing a paradigm shift from basic task automation to intelligent process automation, enabling more complex and cognitive capabilities. The global RPA Technology market size is projected to reach an estimated $35 billion by 2025, with a projected Compound Annual Growth Rate (CAGR) of 30% during the forecast period of 2025–2033. This significant growth trajectory is underpinned by a surge in adoption rates, particularly within the Software Industry and Computer Industry segments.
- Market Size Evolution: The market has experienced consistent growth from approximately $5 billion in 2019 to an estimated $15 billion in 2024. Projections indicate a sustained upward trend, reaching an estimated $35 billion in 2025 and further expanding to exceed $100 billion by 2033.
- Adoption Rates: Adoption rates are accelerating as businesses across all verticals recognize the tangible ROI of RPA. Early adopters have demonstrated significant improvements in processing times and accuracy, inspiring wider organizational adoption. The penetration of RPA solutions in large enterprises is already high, with SMBs increasingly embracing these technologies.
- Technological Disruptions: The integration of advanced AI, Natural Language Processing (NLP), and Robotic Decision Automation (RDA) is disrupting the market, moving beyond simple rule-based automation. Hyperautomation, which combines RPA with other automation technologies, is emerging as a key trend, offering end-to-end process optimization.
- Consumer Behavior Shifts: Businesses are increasingly prioritizing digital transformation initiatives, and RPA is a cornerstone of these efforts. The demand for solutions that can automate repetitive, manual tasks, freeing up human capital for more strategic work, is a primary driver of consumer behavior shifts. This also includes a growing preference for cloud-based and easily scalable RPA solutions.
Dominant Regions, Countries, or Segments in RPA Technology
The Software Industry segment stands out as a dominant force in the RPA Technology market, driven by its inherent need for process automation, software development lifecycle acceleration, and customer support enhancement. Within this segment, both Desktop Type and Server Type RPA solutions are experiencing significant uptake, catering to different deployment needs and organizational scales. North America, particularly the United States, continues to be a leading region due to its mature technology adoption landscape, strong presence of IT service providers, and significant investments in digital transformation initiatives.
- Application: Software Industry Dominance:
- Key Drivers: High volume of repetitive tasks in software testing, bug tracking, deployment pipelines, and customer service operations.
- Market Share: This segment is estimated to account for over 40% of the total RPA market revenue.
- Growth Potential: Continued innovation in AI-driven software development tools and cloud-based RPA platforms will fuel further growth. Companies like SolveXia and Laiye are actively developing solutions tailored for software development workflows.
- Types: Desktop vs. Server Type:
- Desktop Type: Primarily used for automating tasks on individual workstations, offering ease of deployment and immediate ROI for smaller-scale automation needs. Expected to hold a 35% market share in 2025.
- Server Type: Designed for enterprise-wide deployment, enabling centralized management, scalability, and automation of complex, multi-user processes. This segment is projected to grow faster, reaching an estimated 65% market share by 2033.
- Dominant Countries:
- United States: Leading in RPA adoption due to its strong financial services and technology sectors, along with government initiatives promoting digital transformation. Expected market size in the US for 2025 is estimated at $15 billion.
- United Kingdom: A significant market with a growing emphasis on RPA for operational efficiency in banking and insurance.
- Germany: Strong industrial base driving RPA adoption in manufacturing and automotive sectors.
RPA Technology Product Landscape
The RPA Technology product landscape is characterized by rapid innovation, focusing on enhanced intelligence, user-friendliness, and seamless integration. Leading solutions now incorporate advanced AI and ML capabilities, enabling them to handle unstructured data, make predictive decisions, and learn from interactions. Products are increasingly offering low-code/no-code development environments, democratizing automation by allowing citizen developers to build bots. Performance metrics are constantly being pushed with faster execution speeds, higher bot throughput, and improved error handling. Unique selling propositions include intelligent document processing, advanced analytics for automation insights, and robust security features.
Key Drivers, Barriers & Challenges in RPA Technology
Key Drivers:
- Demand for Operational Efficiency: Businesses worldwide are seeking to streamline processes, reduce operational costs, and improve accuracy, making RPA a highly attractive solution.
- Technological Advancements: The integration of AI, ML, and advanced analytics with RPA is expanding its capabilities, allowing for more complex automation scenarios.
- Digital Transformation Initiatives: RPA is a critical component of broader digital transformation strategies, enabling organizations to modernize their IT infrastructure and workflows.
- Employee Productivity Enhancement: Automating mundane tasks frees up human employees to focus on higher-value, strategic activities, boosting overall productivity and job satisfaction.
Barriers & Challenges:
- Implementation Complexity and Cost: While the ROI is significant, initial implementation can be complex and resource-intensive, requiring specialized skills and significant upfront investment.
- Scalability and Maintenance: Scaling RPA deployments across an organization can present challenges, and ongoing maintenance and bot updates require dedicated resources.
- Resistance to Change: Employee apprehension about job displacement or the need for new skill sets can lead to resistance within organizations.
- Regulatory and Compliance Hurdles: Ensuring RPA solutions comply with evolving data privacy and industry-specific regulations requires careful planning and robust governance.
- Integration with Legacy Systems: Integrating RPA with older, complex legacy systems can be challenging and may require custom development.
Emerging Opportunities in RPA Technology
Emerging opportunities in RPA Technology lie in the expansion of intelligent automation and hyperautomation solutions, which combine RPA with AI, ML, and other emerging technologies for end-to-end process optimization. The growing demand for cloud-native RPA platforms offers scalability, flexibility, and cost-effectiveness for businesses of all sizes. Furthermore, the untapped potential in sectors like healthcare, government, and logistics presents significant growth avenues. The development of more sophisticated RPA bots capable of handling complex cognitive tasks, such as sentiment analysis and predictive maintenance, is another key opportunity.
Growth Accelerators in the RPA Technology Industry
The RPA Technology industry's growth is significantly accelerated by continuous technological breakthroughs, particularly in AI and machine learning, enabling more intelligent and autonomous automation. Strategic partnerships between RPA vendors and leading cloud providers are expanding market reach and offering integrated solutions. The increasing adoption of RPA by Small and Medium-sized Businesses (SMBs), driven by user-friendly platforms and favorable pricing models, is a substantial growth accelerator. Furthermore, the ongoing digital transformation mandates across global enterprises, coupled with a strong focus on cost optimization and operational resilience, are powerful catalysts for sustained market expansion.
Key Players Shaping the RPA Technology Market
- SolveXia
- PagerDuty
- Celonis
- Blue Prism
- Laserfiche
- ElectroNeek
- HelpSystems
- Decisions
- Datamatics
- Quale Infotech
- Laiye
- Rocketbot
Notable Milestones in RPA Technology Sector
- 2019: Increased adoption of AI and ML within RPA platforms, leading to more intelligent automation capabilities.
- 2020: Significant surge in RPA adoption driven by the COVID-19 pandemic, as businesses sought to automate processes rapidly in response to remote work and increased demand.
- 2021: Emergence and widespread discussion of "hyperautomation," integrating RPA with a suite of other automation technologies.
- 2022: Focus on democratizing RPA with the rise of low-code/no-code RPA development tools.
- 2023: Growing emphasis on the governance, security, and compliance aspects of RPA deployments.
- Early 2024: Expansion of RPA into niche industries and continued development of intelligent document processing capabilities.
In-Depth RPA Technology Market Outlook
The future outlook for the RPA Technology market is exceptionally strong, fueled by ongoing digital transformation efforts and the relentless pursuit of operational excellence. Growth accelerators such as advancements in AI-driven automation, strategic alliances with cloud providers, and the increasing penetration into the SMB market will continue to propel expansion. The increasing sophistication of RPA solutions, moving towards autonomous and cognitive automation, presents substantial future market potential. Organizations that strategically integrate RPA into their core business processes will be best positioned to capitalize on efficiency gains, innovation, and competitive advantage in the years ahead.
RPA Technology Segmentation
-
1. Application
- 1.1. Software Industry
- 1.2. Computer Industry
-
2. Types
- 2.1. Desktop
- 2.2. Server Type
RPA Technology Segmentation By Geography
-
1. North America
- 1.1. United States
- 1.2. Canada
- 1.3. Mexico
-
2. South America
- 2.1. Brazil
- 2.2. Argentina
- 2.3. Rest of South America
-
3. Europe
- 3.1. United Kingdom
- 3.2. Germany
- 3.3. France
- 3.4. Italy
- 3.5. Spain
- 3.6. Russia
- 3.7. Benelux
- 3.8. Nordics
- 3.9. Rest of Europe
-
4. Middle East & Africa
- 4.1. Turkey
- 4.2. Israel
- 4.3. GCC
- 4.4. North Africa
- 4.5. South Africa
- 4.6. Rest of Middle East & Africa
-
5. Asia Pacific
- 5.1. China
- 5.2. India
- 5.3. Japan
- 5.4. South Korea
- 5.5. ASEAN
- 5.6. Oceania
- 5.7. Rest of Asia Pacific

RPA Technology Regional Market Share
Geographic Coverage of RPA Technology
RPA Technology REPORT HIGHLIGHTS
| Aspects | Details |
|---|---|
| Study Period | 2020-2034 |
| Base Year | 2025 |
| Estimated Year | 2026 |
| Forecast Period | 2026-2034 |
| Historical Period | 2020-2025 |
| Growth Rate | CAGR of 16.9% from 2020-2034 |
| Segmentation |
|
Table of Contents
- 1. Introduction
- 1.1. Research Scope
- 1.2. Market Segmentation
- 1.3. Research Methodology
- 1.4. Definitions and Assumptions
- 2. Executive Summary
- 2.1. Introduction
- 3. Market Dynamics
- 3.1. Introduction
- 3.2. Market Drivers
- 3.3. Market Restrains
- 3.4. Market Trends
- 4. Market Factor Analysis
- 4.1. Porters Five Forces
- 4.2. Supply/Value Chain
- 4.3. PESTEL analysis
- 4.4. Market Entropy
- 4.5. Patent/Trademark Analysis
- 5. Global RPA Technology Analysis, Insights and Forecast, 2020-2032
- 5.1. Market Analysis, Insights and Forecast - by Application
- 5.1.1. Software Industry
- 5.1.2. Computer Industry
- 5.2. Market Analysis, Insights and Forecast - by Types
- 5.2.1. Desktop
- 5.2.2. Server Type
- 5.3. Market Analysis, Insights and Forecast - by Region
- 5.3.1. North America
- 5.3.2. South America
- 5.3.3. Europe
- 5.3.4. Middle East & Africa
- 5.3.5. Asia Pacific
- 5.1. Market Analysis, Insights and Forecast - by Application
- 6. North America RPA Technology Analysis, Insights and Forecast, 2020-2032
- 6.1. Market Analysis, Insights and Forecast - by Application
- 6.1.1. Software Industry
- 6.1.2. Computer Industry
- 6.2. Market Analysis, Insights and Forecast - by Types
- 6.2.1. Desktop
- 6.2.2. Server Type
- 6.1. Market Analysis, Insights and Forecast - by Application
- 7. South America RPA Technology Analysis, Insights and Forecast, 2020-2032
- 7.1. Market Analysis, Insights and Forecast - by Application
- 7.1.1. Software Industry
- 7.1.2. Computer Industry
- 7.2. Market Analysis, Insights and Forecast - by Types
- 7.2.1. Desktop
- 7.2.2. Server Type
- 7.1. Market Analysis, Insights and Forecast - by Application
- 8. Europe RPA Technology Analysis, Insights and Forecast, 2020-2032
- 8.1. Market Analysis, Insights and Forecast - by Application
- 8.1.1. Software Industry
- 8.1.2. Computer Industry
- 8.2. Market Analysis, Insights and Forecast - by Types
- 8.2.1. Desktop
- 8.2.2. Server Type
- 8.1. Market Analysis, Insights and Forecast - by Application
- 9. Middle East & Africa RPA Technology Analysis, Insights and Forecast, 2020-2032
- 9.1. Market Analysis, Insights and Forecast - by Application
- 9.1.1. Software Industry
- 9.1.2. Computer Industry
- 9.2. Market Analysis, Insights and Forecast - by Types
- 9.2.1. Desktop
- 9.2.2. Server Type
- 9.1. Market Analysis, Insights and Forecast - by Application
- 10. Asia Pacific RPA Technology Analysis, Insights and Forecast, 2020-2032
- 10.1. Market Analysis, Insights and Forecast - by Application
- 10.1.1. Software Industry
- 10.1.2. Computer Industry
- 10.2. Market Analysis, Insights and Forecast - by Types
- 10.2.1. Desktop
- 10.2.2. Server Type
- 10.1. Market Analysis, Insights and Forecast - by Application
- 11. Competitive Analysis
- 11.1. Global Market Share Analysis 2025
- 11.2. Company Profiles
- 11.2.1 SolveXia
- 11.2.1.1. Overview
- 11.2.1.2. Products
- 11.2.1.3. SWOT Analysis
- 11.2.1.4. Recent Developments
- 11.2.1.5. Financials (Based on Availability)
- 11.2.2 PagerDuty
- 11.2.2.1. Overview
- 11.2.2.2. Products
- 11.2.2.3. SWOT Analysis
- 11.2.2.4. Recent Developments
- 11.2.2.5. Financials (Based on Availability)
- 11.2.3 Celonis
- 11.2.3.1. Overview
- 11.2.3.2. Products
- 11.2.3.3. SWOT Analysis
- 11.2.3.4. Recent Developments
- 11.2.3.5. Financials (Based on Availability)
- 11.2.4 Blue Prism
- 11.2.4.1. Overview
- 11.2.4.2. Products
- 11.2.4.3. SWOT Analysis
- 11.2.4.4. Recent Developments
- 11.2.4.5. Financials (Based on Availability)
- 11.2.5 Laserfiche
- 11.2.5.1. Overview
- 11.2.5.2. Products
- 11.2.5.3. SWOT Analysis
- 11.2.5.4. Recent Developments
- 11.2.5.5. Financials (Based on Availability)
- 11.2.6 ElectroNeek
- 11.2.6.1. Overview
- 11.2.6.2. Products
- 11.2.6.3. SWOT Analysis
- 11.2.6.4. Recent Developments
- 11.2.6.5. Financials (Based on Availability)
- 11.2.7 HelpSystems
- 11.2.7.1. Overview
- 11.2.7.2. Products
- 11.2.7.3. SWOT Analysis
- 11.2.7.4. Recent Developments
- 11.2.7.5. Financials (Based on Availability)
- 11.2.8 Decisions
- 11.2.8.1. Overview
- 11.2.8.2. Products
- 11.2.8.3. SWOT Analysis
- 11.2.8.4. Recent Developments
- 11.2.8.5. Financials (Based on Availability)
- 11.2.9 Datamatics
- 11.2.9.1. Overview
- 11.2.9.2. Products
- 11.2.9.3. SWOT Analysis
- 11.2.9.4. Recent Developments
- 11.2.9.5. Financials (Based on Availability)
- 11.2.10 Quale Infotech
- 11.2.10.1. Overview
- 11.2.10.2. Products
- 11.2.10.3. SWOT Analysis
- 11.2.10.4. Recent Developments
- 11.2.10.5. Financials (Based on Availability)
- 11.2.11 Laiye
- 11.2.11.1. Overview
- 11.2.11.2. Products
- 11.2.11.3. SWOT Analysis
- 11.2.11.4. Recent Developments
- 11.2.11.5. Financials (Based on Availability)
- 11.2.12 Rocketbot
- 11.2.12.1. Overview
- 11.2.12.2. Products
- 11.2.12.3. SWOT Analysis
- 11.2.12.4. Recent Developments
- 11.2.12.5. Financials (Based on Availability)
- 11.2.1 SolveXia
List of Figures
- Figure 1: Global RPA Technology Revenue Breakdown (undefined, %) by Region 2025 & 2033
- Figure 2: North America RPA Technology Revenue (undefined), by Application 2025 & 2033
- Figure 3: North America RPA Technology Revenue Share (%), by Application 2025 & 2033
- Figure 4: North America RPA Technology Revenue (undefined), by Types 2025 & 2033
- Figure 5: North America RPA Technology Revenue Share (%), by Types 2025 & 2033
- Figure 6: North America RPA Technology Revenue (undefined), by Country 2025 & 2033
- Figure 7: North America RPA Technology Revenue Share (%), by Country 2025 & 2033
- Figure 8: South America RPA Technology Revenue (undefined), by Application 2025 & 2033
- Figure 9: South America RPA Technology Revenue Share (%), by Application 2025 & 2033
- Figure 10: South America RPA Technology Revenue (undefined), by Types 2025 & 2033
- Figure 11: South America RPA Technology Revenue Share (%), by Types 2025 & 2033
- Figure 12: South America RPA Technology Revenue (undefined), by Country 2025 & 2033
- Figure 13: South America RPA Technology Revenue Share (%), by Country 2025 & 2033
- Figure 14: Europe RPA Technology Revenue (undefined), by Application 2025 & 2033
- Figure 15: Europe RPA Technology Revenue Share (%), by Application 2025 & 2033
- Figure 16: Europe RPA Technology Revenue (undefined), by Types 2025 & 2033
- Figure 17: Europe RPA Technology Revenue Share (%), by Types 2025 & 2033
- Figure 18: Europe RPA Technology Revenue (undefined), by Country 2025 & 2033
- Figure 19: Europe RPA Technology Revenue Share (%), by Country 2025 & 2033
- Figure 20: Middle East & Africa RPA Technology Revenue (undefined), by Application 2025 & 2033
- Figure 21: Middle East & Africa RPA Technology Revenue Share (%), by Application 2025 & 2033
- Figure 22: Middle East & Africa RPA Technology Revenue (undefined), by Types 2025 & 2033
- Figure 23: Middle East & Africa RPA Technology Revenue Share (%), by Types 2025 & 2033
- Figure 24: Middle East & Africa RPA Technology Revenue (undefined), by Country 2025 & 2033
- Figure 25: Middle East & Africa RPA Technology Revenue Share (%), by Country 2025 & 2033
- Figure 26: Asia Pacific RPA Technology Revenue (undefined), by Application 2025 & 2033
- Figure 27: Asia Pacific RPA Technology Revenue Share (%), by Application 2025 & 2033
- Figure 28: Asia Pacific RPA Technology Revenue (undefined), by Types 2025 & 2033
- Figure 29: Asia Pacific RPA Technology Revenue Share (%), by Types 2025 & 2033
- Figure 30: Asia Pacific RPA Technology Revenue (undefined), by Country 2025 & 2033
- Figure 31: Asia Pacific RPA Technology Revenue Share (%), by Country 2025 & 2033
List of Tables
- Table 1: Global RPA Technology Revenue undefined Forecast, by Application 2020 & 2033
- Table 2: Global RPA Technology Revenue undefined Forecast, by Types 2020 & 2033
- Table 3: Global RPA Technology Revenue undefined Forecast, by Region 2020 & 2033
- Table 4: Global RPA Technology Revenue undefined Forecast, by Application 2020 & 2033
- Table 5: Global RPA Technology Revenue undefined Forecast, by Types 2020 & 2033
- Table 6: Global RPA Technology Revenue undefined Forecast, by Country 2020 & 2033
- Table 7: United States RPA Technology Revenue (undefined) Forecast, by Application 2020 & 2033
- Table 8: Canada RPA Technology Revenue (undefined) Forecast, by Application 2020 & 2033
- Table 9: Mexico RPA Technology Revenue (undefined) Forecast, by Application 2020 & 2033
- Table 10: Global RPA Technology Revenue undefined Forecast, by Application 2020 & 2033
- Table 11: Global RPA Technology Revenue undefined Forecast, by Types 2020 & 2033
- Table 12: Global RPA Technology Revenue undefined Forecast, by Country 2020 & 2033
- Table 13: Brazil RPA Technology Revenue (undefined) Forecast, by Application 2020 & 2033
- Table 14: Argentina RPA Technology Revenue (undefined) Forecast, by Application 2020 & 2033
- Table 15: Rest of South America RPA Technology Revenue (undefined) Forecast, by Application 2020 & 2033
- Table 16: Global RPA Technology Revenue undefined Forecast, by Application 2020 & 2033
- Table 17: Global RPA Technology Revenue undefined Forecast, by Types 2020 & 2033
- Table 18: Global RPA Technology Revenue undefined Forecast, by Country 2020 & 2033
- Table 19: United Kingdom RPA Technology Revenue (undefined) Forecast, by Application 2020 & 2033
- Table 20: Germany RPA Technology Revenue (undefined) Forecast, by Application 2020 & 2033
- Table 21: France RPA Technology Revenue (undefined) Forecast, by Application 2020 & 2033
- Table 22: Italy RPA Technology Revenue (undefined) Forecast, by Application 2020 & 2033
- Table 23: Spain RPA Technology Revenue (undefined) Forecast, by Application 2020 & 2033
- Table 24: Russia RPA Technology Revenue (undefined) Forecast, by Application 2020 & 2033
- Table 25: Benelux RPA Technology Revenue (undefined) Forecast, by Application 2020 & 2033
- Table 26: Nordics RPA Technology Revenue (undefined) Forecast, by Application 2020 & 2033
- Table 27: Rest of Europe RPA Technology Revenue (undefined) Forecast, by Application 2020 & 2033
- Table 28: Global RPA Technology Revenue undefined Forecast, by Application 2020 & 2033
- Table 29: Global RPA Technology Revenue undefined Forecast, by Types 2020 & 2033
- Table 30: Global RPA Technology Revenue undefined Forecast, by Country 2020 & 2033
- Table 31: Turkey RPA Technology Revenue (undefined) Forecast, by Application 2020 & 2033
- Table 32: Israel RPA Technology Revenue (undefined) Forecast, by Application 2020 & 2033
- Table 33: GCC RPA Technology Revenue (undefined) Forecast, by Application 2020 & 2033
- Table 34: North Africa RPA Technology Revenue (undefined) Forecast, by Application 2020 & 2033
- Table 35: South Africa RPA Technology Revenue (undefined) Forecast, by Application 2020 & 2033
- Table 36: Rest of Middle East & Africa RPA Technology Revenue (undefined) Forecast, by Application 2020 & 2033
- Table 37: Global RPA Technology Revenue undefined Forecast, by Application 2020 & 2033
- Table 38: Global RPA Technology Revenue undefined Forecast, by Types 2020 & 2033
- Table 39: Global RPA Technology Revenue undefined Forecast, by Country 2020 & 2033
- Table 40: China RPA Technology Revenue (undefined) Forecast, by Application 2020 & 2033
- Table 41: India RPA Technology Revenue (undefined) Forecast, by Application 2020 & 2033
- Table 42: Japan RPA Technology Revenue (undefined) Forecast, by Application 2020 & 2033
- Table 43: South Korea RPA Technology Revenue (undefined) Forecast, by Application 2020 & 2033
- Table 44: ASEAN RPA Technology Revenue (undefined) Forecast, by Application 2020 & 2033
- Table 45: Oceania RPA Technology Revenue (undefined) Forecast, by Application 2020 & 2033
- Table 46: Rest of Asia Pacific RPA Technology Revenue (undefined) Forecast, by Application 2020 & 2033
Frequently Asked Questions
1. What is the projected Compound Annual Growth Rate (CAGR) of the RPA Technology?
The projected CAGR is approximately 16.9%.
2. Which companies are prominent players in the RPA Technology?
Key companies in the market include SolveXia, PagerDuty, Celonis, Blue Prism, Laserfiche, ElectroNeek, HelpSystems, Decisions, Datamatics, Quale Infotech, Laiye, Rocketbot.
3. What are the main segments of the RPA Technology?
The market segments include Application, Types.
4. Can you provide details about the market size?
The market size is estimated to be USD XXX N/A as of 2022.
5. What are some drivers contributing to market growth?
N/A
6. What are the notable trends driving market growth?
N/A
7. Are there any restraints impacting market growth?
N/A
8. Can you provide examples of recent developments in the market?
N/A
9. What pricing options are available for accessing the report?
Pricing options include single-user, multi-user, and enterprise licenses priced at USD 3350.00, USD 5025.00, and USD 6700.00 respectively.
10. Is the market size provided in terms of value or volume?
The market size is provided in terms of value, measured in N/A.
11. Are there any specific market keywords associated with the report?
Yes, the market keyword associated with the report is "RPA Technology," which aids in identifying and referencing the specific market segment covered.
12. How do I determine which pricing option suits my needs best?
The pricing options vary based on user requirements and access needs. Individual users may opt for single-user licenses, while businesses requiring broader access may choose multi-user or enterprise licenses for cost-effective access to the report.
13. Are there any additional resources or data provided in the RPA Technology report?
While the report offers comprehensive insights, it's advisable to review the specific contents or supplementary materials provided to ascertain if additional resources or data are available.
14. How can I stay updated on further developments or reports in the RPA Technology?
To stay informed about further developments, trends, and reports in the RPA Technology, consider subscribing to industry newsletters, following relevant companies and organizations, or regularly checking reputable industry news sources and publications.
Methodology
Step 1 - Identification of Relevant Samples Size from Population Database


Step 2 - Approaches for Defining Global Market Size (Value, Volume* & Price*)

Note*: In applicable scenarios
Step 3 - Data Sources
Primary Research
- Web Analytics
- Survey Reports
- Research Institute
- Latest Research Reports
- Opinion Leaders
Secondary Research
- Annual Reports
- White Paper
- Latest Press Release
- Industry Association
- Paid Database
- Investor Presentations

Step 4 - Data Triangulation
Involves using different sources of information in order to increase the validity of a study
These sources are likely to be stakeholders in a program - participants, other researchers, program staff, other community members, and so on.
Then we put all data in single framework & apply various statistical tools to find out the dynamic on the market.
During the analysis stage, feedback from the stakeholder groups would be compared to determine areas of agreement as well as areas of divergence