Key Insights
The global Rotator Cuff Reinforcement Device market is projected to reach an estimated $1.8 billion by 2025, exhibiting robust growth at a Compound Annual Growth Rate (CAGR) of 7.8% through 2033. This significant market expansion is primarily driven by the increasing incidence of rotator cuff injuries, largely attributable to the aging global population and a rise in sports-related trauma and occupational overuse. Advancements in surgical techniques, including minimally invasive procedures, are further bolstering demand for innovative reinforcement devices that offer enhanced healing and faster patient recovery. The growing awareness among both patients and healthcare professionals regarding the efficacy of these devices in preventing re-tears and improving long-term shoulder function is a key catalyst. Furthermore, an escalating investment in research and development by leading market players to introduce next-generation bio-compatible and bio-absorbable reinforcement materials is contributing to market dynamism.
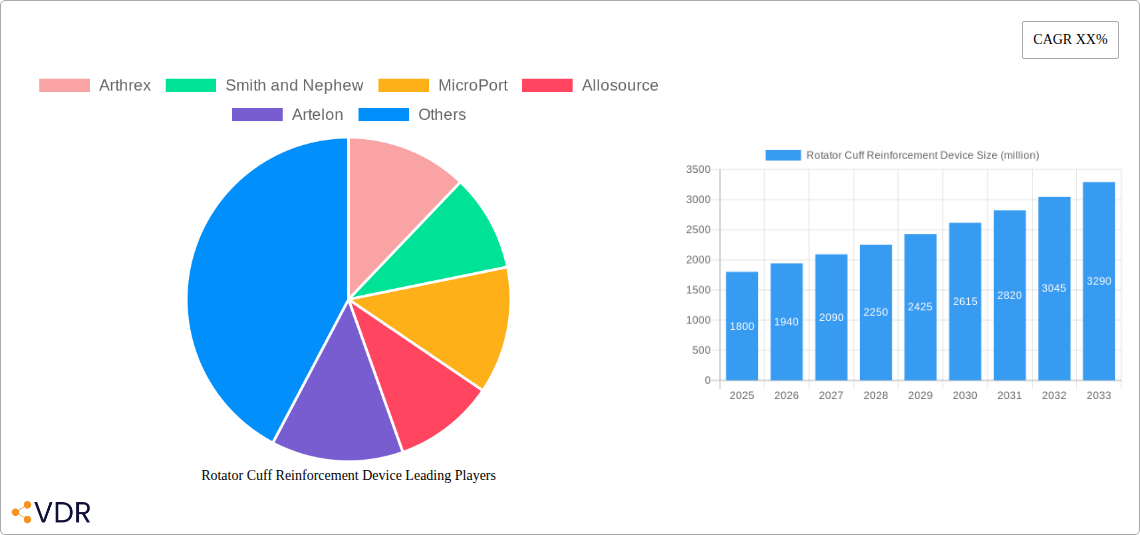
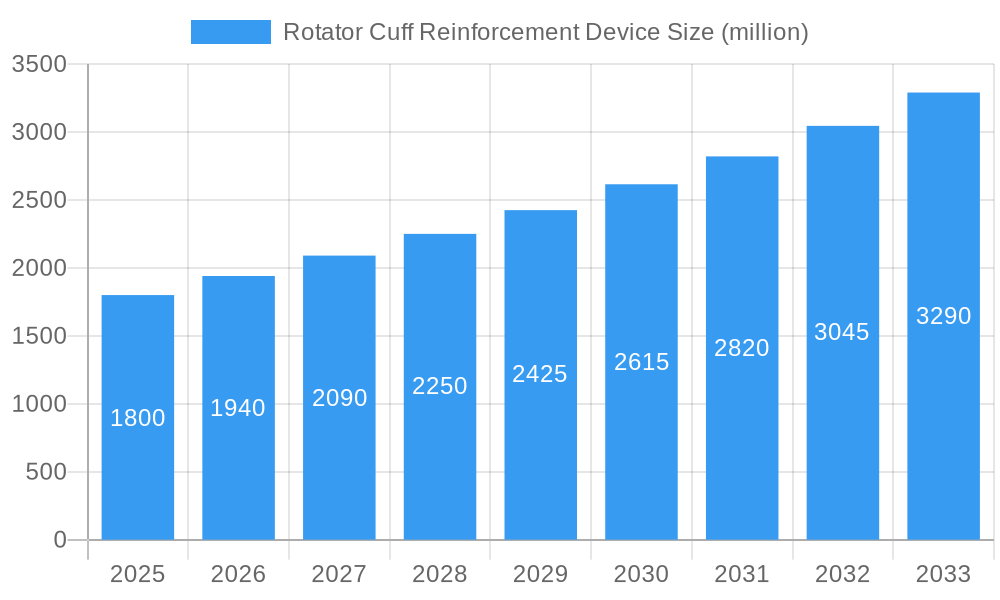
Rotator Cuff Reinforcement Device Market Size (In Billion)
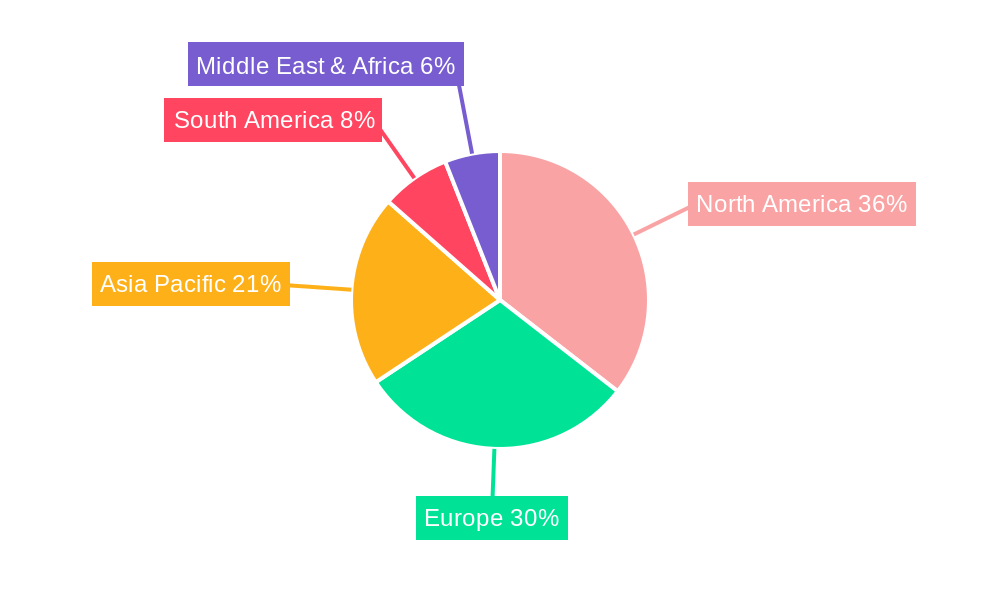
The market segmentation reveals a strong preference for Allograft Reinforcement Devices, accounting for a substantial market share due to their proven clinical outcomes and biological integration. However, Alloplast Reinforcement Devices are gaining traction owing to their cost-effectiveness and consistent availability. Geographically, North America currently dominates the market, driven by a high prevalence of sports injuries, advanced healthcare infrastructure, and favorable reimbursement policies. Europe follows closely, with significant contributions from Germany, the UK, and France. The Asia Pacific region is anticipated to witness the fastest growth, fueled by increasing healthcare expenditure, a growing middle class, and the rising adoption of advanced medical technologies. Key market players like Arthrex, Smith & Nephew, and Stryker are actively engaged in product innovation, strategic partnerships, and market expansion to capitalize on these growth opportunities and address the unmet needs in rotator cuff repair.
Rotator Cuff Reinforcement Device Company Market Share
Rotator Cuff Reinforcement Device Market Dynamics & Structure
The global Rotator Cuff Reinforcement Device market is characterized by moderate concentration, with key players like Arthrex, Smith and Nephew, and MicroPort holding significant market shares. Technological innovation is a primary driver, fueled by advancements in biomaterials and surgical techniques for enhanced rotator cuff repair outcomes. Robust regulatory frameworks, such as FDA approvals and CE marking, ensure product safety and efficacy, albeit sometimes posing barriers to faster market entry. Competitive product substitutes, including traditional suture repair techniques and biologic augmentation, present a dynamic competitive landscape. End-user demographics are evolving, with an increasing prevalence of sports-related injuries and a growing aging population contributing to higher demand. Mergers and acquisitions (M&A) are an ongoing trend, with companies seeking to expand their product portfolios and market reach. For instance, X number of M&A deals were observed in the historical period 2019-2024, with an estimated value of $XX million, indicating a strategic consolidation within the industry. Innovation barriers include the high cost of research and development and the lengthy clinical trial processes required for new device approvals.
- Market Concentration: Moderate, with key players like Arthrex, Smith and Nephew, MicroPort, Stryker, and Zimmer dominating market share.
- Technological Innovation Drivers: Advancements in biocompatible materials, bioabsorbable scaffolds, and minimally invasive surgical technologies.
- Regulatory Frameworks: Strict adherence to FDA, CE, and other regional regulatory approvals, ensuring patient safety and device efficacy.
- Competitive Product Substitutes: Traditional suture repair, advanced biologics (e.g., platelet-rich plasma), and alternative surgical approaches.
- End-User Demographics: Growing incidence of sports injuries, degenerative rotator cuff tears in the aging population, and increased awareness of surgical intervention.
- M&A Trends: Strategic acquisitions to broaden product offerings and gain market access, with an estimated X deals valued at $XX million in the historical period.
Rotator Cuff Reinforcement Device Growth Trends & Insights
The Rotator Cuff Reinforcement Device market is poised for significant growth, projected to expand from an estimated $XXX million in 2025 to $XXX million by 2033, exhibiting a Compound Annual Growth Rate (CAGR) of XX%. This robust expansion is attributed to several converging factors, including the increasing incidence of rotator cuff tears, driven by an aging global population and a rise in sports-related injuries across all age groups. The growing demand for minimally invasive surgical procedures, which often integrate reinforcement devices to improve repair integrity and reduce re-tears, is a major catalyst. Technological advancements in material science, leading to the development of more biocompatible, bioabsorbable, and mechanically superior reinforcement solutions, are also propelling market adoption. Furthermore, heightened awareness among both patients and healthcare professionals regarding the benefits of using reinforcement devices to enhance surgical outcomes and accelerate patient recovery is a key driver. The market penetration of these devices is steadily increasing, moving from niche applications to becoming a standard of care in many surgical settings.
The base year of 2025 sees a market size of $XXX million, with an estimated XX% growth in unit sales from the historical period (2019-2024). This upward trajectory is further supported by increasing healthcare expenditures globally, particularly in developed economies, where advanced surgical interventions and novel medical devices are readily adopted. Consumer behavior shifts are also noteworthy; patients are becoming more proactive in seeking surgical solutions for debilitating shoulder pain, influenced by the availability of effective treatments and the desire to maintain an active lifestyle. This increasing patient demand translates into higher procedure volumes, thereby boosting the market for rotator cuff reinforcement devices. Technological disruptions, such as the advent of 3D printing for customized implants and the integration of regenerative medicine principles into device design, are expected to revolutionize the market in the forecast period (2025-2033). The adoption rates of allograft and alloplast reinforcement devices, in particular, are projected to see substantial increases due to their favorable integration and reduced immunogenicity. The market is not merely expanding in value but also in its geographical reach, with emerging economies showing increasing interest and investment in advanced orthopedic solutions.
Dominant Regions, Countries, or Segments in Rotator Cuff Reinforcement Device
The North America region, particularly the United States, currently dominates the global Rotator Cuff Reinforcement Device market, driven by several key factors. The region boasts a highly developed healthcare infrastructure, with a high density of advanced orthopedic centers and a strong emphasis on sports medicine. The presence of leading medical device manufacturers and research institutions in the U.S. fosters continuous innovation and early adoption of new technologies. Furthermore, favorable reimbursement policies for orthopedic procedures and a high disposable income among the population contribute to increased patient access to advanced treatments. In 2025, North America is estimated to hold a XX% market share, with an anticipated CAGR of XX% through 2033.
Within the Applications segment, Hospitals are the leading segment, accounting for an estimated XX% of the market in 2025. This dominance is attributed to the complexity of many rotator cuff repair surgeries, which often require the specialized infrastructure and multidisciplinary teams available in hospital settings. Ambulatory Surgical Centers (ASCs) are a rapidly growing segment, projected to witness a CAGR of XX% over the forecast period, as an increasing number of less complex rotator cuff repairs are being shifted to outpatient settings for cost-effectiveness and patient convenience.
In terms of Types, Allograft Reinforcement Devices are currently the dominant segment, holding an estimated XX% market share in 2025. This is due to their proven biocompatibility, excellent integration properties with native tissue, and reduced risk of immune rejection. However, Alloplast Reinforcement Devices are projected to experience the highest CAGR of XX% during the forecast period, driven by advancements in synthetic materials offering superior mechanical strength and tailored resorption profiles. The market share of Xenograft Reinforcement Devices is expected to remain relatively smaller, facing challenges related to potential immunogenicity and regulatory hurdles. Economic policies promoting medical tourism and investments in healthcare infrastructure in countries like Germany and the UK contribute to Europe's significant market share, estimated at XX% in 2025.
Rotator Cuff Reinforcement Device Product Landscape
The Rotator Cuff Reinforcement Device product landscape is characterized by continuous innovation aimed at enhancing repair strength, promoting biological healing, and minimizing re-tear rates. Products range from advanced bioabsorbable scaffolds that provide temporary mechanical support and stimulate tissue regeneration, to permanent synthetic implants offering robust structural integrity. Biologics-based reinforcements, such as demineralized bone matrix and collagen membranes, are gaining traction for their regenerative potential. Unique selling propositions revolve around improved biomechanical properties, enhanced graft integration, and minimally invasive delivery systems. Technological advancements include the development of devices with tailored degradation rates to match healing timelines and the incorporation of growth factors to accelerate tissue repair.
Key Drivers, Barriers & Challenges in Rotator Cuff Reinforcement Device
Key Drivers:
- Rising Incidence of Rotator Cuff Tears: Increasing prevalence due to aging populations and sports-related injuries drives demand.
- Advancements in Surgical Techniques: Minimally invasive procedures and the desire for enhanced repair outcomes favor reinforcement devices.
- Technological Innovations: Development of biocompatible materials, bioabsorbable scaffolds, and regenerative medicine integration.
- Growing Healthcare Expenditure: Increased investment in orthopedic care globally.
- Patient Demand for Improved Quality of Life: Desire to regain shoulder function and reduce pain.
Barriers & Challenges:
- High Cost of Devices: Can limit adoption in resource-constrained healthcare settings.
- Reimbursement Policies: Inconsistent or restrictive reimbursement can hinder market access.
- Regulatory Hurdles: Lengthy approval processes for new and innovative devices.
- Surgeon Education and Training: Need for specialized training to effectively utilize new reinforcement technologies.
- Competition from Alternative Treatments: Traditional suture repair and non-surgical interventions.
- Supply Chain Disruptions: Global manufacturing and logistics can impact availability, particularly for biologic materials.
- Potential for Complications: While rare, infection or implant failure remains a concern.
Emerging Opportunities in Rotator Cuff Reinforcement Device
Emerging opportunities in the Rotator Cuff Reinforcement Device market lie in the development of personalized and regenerative medicine-inspired solutions. The growing interest in patient-specific implants, potentially enabled by 3D printing technology, offers a significant avenue for growth. Furthermore, the integration of advanced biologics and stem cell therapies with mechanical reinforcement scaffolds presents a frontier for accelerated and more complete healing. Untapped markets in developing economies with increasing healthcare investments and a rising middle class represent substantial growth potential. Evolving consumer preferences towards less invasive procedures and faster recovery times will also drive the demand for innovative, minimally invasive reinforcement devices.
Growth Accelerators in the Rotator Cuff Reinforcement Device Industry
Key catalysts driving long-term growth in the Rotator Cuff Reinforcement Device industry include breakthroughs in bioengineering, leading to the creation of novel biomaterials with superior mechanical and biological properties. Strategic partnerships between device manufacturers, research institutions, and biologic suppliers are crucial for synergistic innovation and faster product development. Market expansion strategies targeting emerging economies with improving healthcare infrastructures and increasing disposable incomes will unlock new revenue streams. The continuous refinement of surgical navigation systems and robotics further enhances the precision and effectiveness of rotator cuff repairs, indirectly boosting the adoption of reinforcement devices.
Key Players Shaping the Rotator Cuff Reinforcement Device Market
- Arthrex
- Smith and Nephew
- MicroPort
- Allosource
- Artelon
- Biomet
- Conmed Linvatec
- Integra LifeSciences
- RTI Biologics
- Stryker
- Synthasome
- Tissue Regenix
- Tornier
- Wright Medical
- Zimmer
Notable Milestones in Rotator Cuff Reinforcement Device Sector
- 2020: Launch of a new bioabsorbable scaffold with enhanced growth factor delivery, improving tissue regeneration.
- 2021: Major orthopedic company acquires a biologics firm, expanding its regenerative medicine portfolio.
- 2022: FDA approval granted for an advanced alloplast device featuring a novel porous structure for superior integration.
- 2023: Introduction of a minimally invasive rotator cuff repair system incorporating a flexible reinforcement patch.
- 2024: Successful completion of clinical trials demonstrating significantly reduced re-tear rates with a new generation of bio-integrated reinforcement devices.
In-Depth Rotator Cuff Reinforcement Device Market Outlook
The Rotator Cuff Reinforcement Device market outlook is exceptionally positive, driven by sustained growth accelerators such as continuous technological advancements in biomaterials and regenerative medicine. Strategic partnerships and market expansion into underserved regions will be pivotal for capturing future opportunities. The increasing focus on patient outcomes and the growing demand for less invasive, more effective surgical solutions position this market for robust expansion. Investment in research and development of personalized and bio-active reinforcement technologies will unlock significant untapped potential, ensuring continued innovation and market penetration in the coming years.
Rotator Cuff Reinforcement Device Segmentation
-
1. Application
- 1.1. Hospitals
- 1.2. Ambulatory Surgical Centers
- 1.3. Others
-
2. Types
- 2.1. Allograft Reinforcement Devices
- 2.2. Xenograft Reinforcement Devices
- 2.3. Alloplast Reinforcement Devices
Rotator Cuff Reinforcement Device Segmentation By Geography
-
1. North America
- 1.1. United States
- 1.2. Canada
- 1.3. Mexico
-
2. South America
- 2.1. Brazil
- 2.2. Argentina
- 2.3. Rest of South America
-
3. Europe
- 3.1. United Kingdom
- 3.2. Germany
- 3.3. France
- 3.4. Italy
- 3.5. Spain
- 3.6. Russia
- 3.7. Benelux
- 3.8. Nordics
- 3.9. Rest of Europe
-
4. Middle East & Africa
- 4.1. Turkey
- 4.2. Israel
- 4.3. GCC
- 4.4. North Africa
- 4.5. South Africa
- 4.6. Rest of Middle East & Africa
-
5. Asia Pacific
- 5.1. China
- 5.2. India
- 5.3. Japan
- 5.4. South Korea
- 5.5. ASEAN
- 5.6. Oceania
- 5.7. Rest of Asia Pacific
Rotator Cuff Reinforcement Device Regional Market Share
Geographic Coverage of Rotator Cuff Reinforcement Device
Rotator Cuff Reinforcement Device REPORT HIGHLIGHTS
| Aspects | Details |
|---|---|
| Study Period | 2020-2034 |
| Base Year | 2025 |
| Estimated Year | 2026 |
| Forecast Period | 2026-2034 |
| Historical Period | 2020-2025 |
| Growth Rate | CAGR of 8.2% from 2020-2034 |
| Segmentation |
|
Table of Contents
- 1. Introduction
- 1.1. Research Scope
- 1.2. Market Segmentation
- 1.3. Research Objective
- 1.4. Definitions and Assumptions
- 2. Executive Summary
- 2.1. Market Snapshot
- 3. Market Dynamics
- 3.1. Market Drivers
- 3.2. Market Restrains
- 3.3. Market Trends
- 3.4. Market Opportunities
- 4. Market Factor Analysis
- 4.1. Porters Five Forces
- 4.1.1. Bargaining Power of Suppliers
- 4.1.2. Bargaining Power of Buyers
- 4.1.3. Threat of New Entrants
- 4.1.4. Threat of Substitutes
- 4.1.5. Competitive Rivalry
- 4.2. PESTEL analysis
- 4.3. BCG Analysis
- 4.3.1. Stars (High Growth, High Market Share)
- 4.3.2. Cash Cows (Low Growth, High Market Share)
- 4.3.3. Question Mark (High Growth, Low Market Share)
- 4.3.4. Dogs (Low Growth, Low Market Share)
- 4.4. Ansoff Matrix Analysis
- 4.5. Supply Chain Analysis
- 4.6. Regulatory Landscape
- 4.7. Current Market Potential and Opportunity Assessment (TAM–SAM–SOM Framework)
- 4.8. VDR Analyst Note
- 4.1. Porters Five Forces
- 5. Market Analysis, Insights and Forecast 2021-2033
- 5.1. Market Analysis, Insights and Forecast - by Application
- 5.1.1. Hospitals
- 5.1.2. Ambulatory Surgical Centers
- 5.1.3. Others
- 5.2. Market Analysis, Insights and Forecast - by Types
- 5.2.1. Allograft Reinforcement Devices
- 5.2.2. Xenograft Reinforcement Devices
- 5.2.3. Alloplast Reinforcement Devices
- 5.3. Market Analysis, Insights and Forecast - by Region
- 5.3.1. North America
- 5.3.2. South America
- 5.3.3. Europe
- 5.3.4. Middle East & Africa
- 5.3.5. Asia Pacific
- 5.1. Market Analysis, Insights and Forecast - by Application
- 6. Global Rotator Cuff Reinforcement Device Analysis, Insights and Forecast, 2021-2033
- 6.1. Market Analysis, Insights and Forecast - by Application
- 6.1.1. Hospitals
- 6.1.2. Ambulatory Surgical Centers
- 6.1.3. Others
- 6.2. Market Analysis, Insights and Forecast - by Types
- 6.2.1. Allograft Reinforcement Devices
- 6.2.2. Xenograft Reinforcement Devices
- 6.2.3. Alloplast Reinforcement Devices
- 6.1. Market Analysis, Insights and Forecast - by Application
- 7. North America Rotator Cuff Reinforcement Device Analysis, Insights and Forecast, 2021-2033
- 7.1. Market Analysis, Insights and Forecast - by Application
- 7.1.1. Hospitals
- 7.1.2. Ambulatory Surgical Centers
- 7.1.3. Others
- 7.2. Market Analysis, Insights and Forecast - by Types
- 7.2.1. Allograft Reinforcement Devices
- 7.2.2. Xenograft Reinforcement Devices
- 7.2.3. Alloplast Reinforcement Devices
- 7.1. Market Analysis, Insights and Forecast - by Application
- 8. South America Rotator Cuff Reinforcement Device Analysis, Insights and Forecast, 2021-2033
- 8.1. Market Analysis, Insights and Forecast - by Application
- 8.1.1. Hospitals
- 8.1.2. Ambulatory Surgical Centers
- 8.1.3. Others
- 8.2. Market Analysis, Insights and Forecast - by Types
- 8.2.1. Allograft Reinforcement Devices
- 8.2.2. Xenograft Reinforcement Devices
- 8.2.3. Alloplast Reinforcement Devices
- 8.1. Market Analysis, Insights and Forecast - by Application
- 9. Europe Rotator Cuff Reinforcement Device Analysis, Insights and Forecast, 2021-2033
- 9.1. Market Analysis, Insights and Forecast - by Application
- 9.1.1. Hospitals
- 9.1.2. Ambulatory Surgical Centers
- 9.1.3. Others
- 9.2. Market Analysis, Insights and Forecast - by Types
- 9.2.1. Allograft Reinforcement Devices
- 9.2.2. Xenograft Reinforcement Devices
- 9.2.3. Alloplast Reinforcement Devices
- 9.1. Market Analysis, Insights and Forecast - by Application
- 10. Middle East & Africa Rotator Cuff Reinforcement Device Analysis, Insights and Forecast, 2021-2033
- 10.1. Market Analysis, Insights and Forecast - by Application
- 10.1.1. Hospitals
- 10.1.2. Ambulatory Surgical Centers
- 10.1.3. Others
- 10.2. Market Analysis, Insights and Forecast - by Types
- 10.2.1. Allograft Reinforcement Devices
- 10.2.2. Xenograft Reinforcement Devices
- 10.2.3. Alloplast Reinforcement Devices
- 10.1. Market Analysis, Insights and Forecast - by Application
- 11. Asia Pacific Rotator Cuff Reinforcement Device Analysis, Insights and Forecast, 2021-2033
- 11.1. Market Analysis, Insights and Forecast - by Application
- 11.1.1. Hospitals
- 11.1.2. Ambulatory Surgical Centers
- 11.1.3. Others
- 11.2. Market Analysis, Insights and Forecast - by Types
- 11.2.1. Allograft Reinforcement Devices
- 11.2.2. Xenograft Reinforcement Devices
- 11.2.3. Alloplast Reinforcement Devices
- 11.1. Market Analysis, Insights and Forecast - by Application
- 12. Competitive Analysis
- 12.1. Company Profiles
- 12.1.1 Arthrex
- 12.1.1.1. Company Overview
- 12.1.1.2. Products
- 12.1.1.3. Company Financials
- 12.1.1.4. SWOT Analysis
- 12.1.2 Smith and Nephew
- 12.1.2.1. Company Overview
- 12.1.2.2. Products
- 12.1.2.3. Company Financials
- 12.1.2.4. SWOT Analysis
- 12.1.3 MicroPort
- 12.1.3.1. Company Overview
- 12.1.3.2. Products
- 12.1.3.3. Company Financials
- 12.1.3.4. SWOT Analysis
- 12.1.4 Allosource
- 12.1.4.1. Company Overview
- 12.1.4.2. Products
- 12.1.4.3. Company Financials
- 12.1.4.4. SWOT Analysis
- 12.1.5 Artelon
- 12.1.5.1. Company Overview
- 12.1.5.2. Products
- 12.1.5.3. Company Financials
- 12.1.5.4. SWOT Analysis
- 12.1.6 Biomet
- 12.1.6.1. Company Overview
- 12.1.6.2. Products
- 12.1.6.3. Company Financials
- 12.1.6.4. SWOT Analysis
- 12.1.7 Conmed Linvatec
- 12.1.7.1. Company Overview
- 12.1.7.2. Products
- 12.1.7.3. Company Financials
- 12.1.7.4. SWOT Analysis
- 12.1.8 Integra LifeSciences
- 12.1.8.1. Company Overview
- 12.1.8.2. Products
- 12.1.8.3. Company Financials
- 12.1.8.4. SWOT Analysis
- 12.1.9 RTI Biologics
- 12.1.9.1. Company Overview
- 12.1.9.2. Products
- 12.1.9.3. Company Financials
- 12.1.9.4. SWOT Analysis
- 12.1.10 Stryker
- 12.1.10.1. Company Overview
- 12.1.10.2. Products
- 12.1.10.3. Company Financials
- 12.1.10.4. SWOT Analysis
- 12.1.11 Synthasome
- 12.1.11.1. Company Overview
- 12.1.11.2. Products
- 12.1.11.3. Company Financials
- 12.1.11.4. SWOT Analysis
- 12.1.12 Tissue Regenix
- 12.1.12.1. Company Overview
- 12.1.12.2. Products
- 12.1.12.3. Company Financials
- 12.1.12.4. SWOT Analysis
- 12.1.13 Tornier
- 12.1.13.1. Company Overview
- 12.1.13.2. Products
- 12.1.13.3. Company Financials
- 12.1.13.4. SWOT Analysis
- 12.1.14 Wright Medical
- 12.1.14.1. Company Overview
- 12.1.14.2. Products
- 12.1.14.3. Company Financials
- 12.1.14.4. SWOT Analysis
- 12.1.15 Zimmer
- 12.1.15.1. Company Overview
- 12.1.15.2. Products
- 12.1.15.3. Company Financials
- 12.1.15.4. SWOT Analysis
- 12.1.1 Arthrex
- 12.2. Market Entropy
- 12.2.1 Company's Key Areas Served
- 12.2.2 Recent Developments
- 12.3. Company Market Share Analysis 2025
- 12.3.1 Top 5 Companies Market Share Analysis
- 12.3.2 Top 3 Companies Market Share Analysis
- 12.4. List of Potential Customers
- 13. Research Methodology
List of Figures
- Figure 1: Global Rotator Cuff Reinforcement Device Revenue Breakdown (billion, %) by Region 2025 & 2033
- Figure 2: Global Rotator Cuff Reinforcement Device Volume Breakdown (K, %) by Region 2025 & 2033
- Figure 3: North America Rotator Cuff Reinforcement Device Revenue (billion), by Application 2025 & 2033
- Figure 4: North America Rotator Cuff Reinforcement Device Volume (K), by Application 2025 & 2033
- Figure 5: North America Rotator Cuff Reinforcement Device Revenue Share (%), by Application 2025 & 2033
- Figure 6: North America Rotator Cuff Reinforcement Device Volume Share (%), by Application 2025 & 2033
- Figure 7: North America Rotator Cuff Reinforcement Device Revenue (billion), by Types 2025 & 2033
- Figure 8: North America Rotator Cuff Reinforcement Device Volume (K), by Types 2025 & 2033
- Figure 9: North America Rotator Cuff Reinforcement Device Revenue Share (%), by Types 2025 & 2033
- Figure 10: North America Rotator Cuff Reinforcement Device Volume Share (%), by Types 2025 & 2033
- Figure 11: North America Rotator Cuff Reinforcement Device Revenue (billion), by Country 2025 & 2033
- Figure 12: North America Rotator Cuff Reinforcement Device Volume (K), by Country 2025 & 2033
- Figure 13: North America Rotator Cuff Reinforcement Device Revenue Share (%), by Country 2025 & 2033
- Figure 14: North America Rotator Cuff Reinforcement Device Volume Share (%), by Country 2025 & 2033
- Figure 15: South America Rotator Cuff Reinforcement Device Revenue (billion), by Application 2025 & 2033
- Figure 16: South America Rotator Cuff Reinforcement Device Volume (K), by Application 2025 & 2033
- Figure 17: South America Rotator Cuff Reinforcement Device Revenue Share (%), by Application 2025 & 2033
- Figure 18: South America Rotator Cuff Reinforcement Device Volume Share (%), by Application 2025 & 2033
- Figure 19: South America Rotator Cuff Reinforcement Device Revenue (billion), by Types 2025 & 2033
- Figure 20: South America Rotator Cuff Reinforcement Device Volume (K), by Types 2025 & 2033
- Figure 21: South America Rotator Cuff Reinforcement Device Revenue Share (%), by Types 2025 & 2033
- Figure 22: South America Rotator Cuff Reinforcement Device Volume Share (%), by Types 2025 & 2033
- Figure 23: South America Rotator Cuff Reinforcement Device Revenue (billion), by Country 2025 & 2033
- Figure 24: South America Rotator Cuff Reinforcement Device Volume (K), by Country 2025 & 2033
- Figure 25: South America Rotator Cuff Reinforcement Device Revenue Share (%), by Country 2025 & 2033
- Figure 26: South America Rotator Cuff Reinforcement Device Volume Share (%), by Country 2025 & 2033
- Figure 27: Europe Rotator Cuff Reinforcement Device Revenue (billion), by Application 2025 & 2033
- Figure 28: Europe Rotator Cuff Reinforcement Device Volume (K), by Application 2025 & 2033
- Figure 29: Europe Rotator Cuff Reinforcement Device Revenue Share (%), by Application 2025 & 2033
- Figure 30: Europe Rotator Cuff Reinforcement Device Volume Share (%), by Application 2025 & 2033
- Figure 31: Europe Rotator Cuff Reinforcement Device Revenue (billion), by Types 2025 & 2033
- Figure 32: Europe Rotator Cuff Reinforcement Device Volume (K), by Types 2025 & 2033
- Figure 33: Europe Rotator Cuff Reinforcement Device Revenue Share (%), by Types 2025 & 2033
- Figure 34: Europe Rotator Cuff Reinforcement Device Volume Share (%), by Types 2025 & 2033
- Figure 35: Europe Rotator Cuff Reinforcement Device Revenue (billion), by Country 2025 & 2033
- Figure 36: Europe Rotator Cuff Reinforcement Device Volume (K), by Country 2025 & 2033
- Figure 37: Europe Rotator Cuff Reinforcement Device Revenue Share (%), by Country 2025 & 2033
- Figure 38: Europe Rotator Cuff Reinforcement Device Volume Share (%), by Country 2025 & 2033
- Figure 39: Middle East & Africa Rotator Cuff Reinforcement Device Revenue (billion), by Application 2025 & 2033
- Figure 40: Middle East & Africa Rotator Cuff Reinforcement Device Volume (K), by Application 2025 & 2033
- Figure 41: Middle East & Africa Rotator Cuff Reinforcement Device Revenue Share (%), by Application 2025 & 2033
- Figure 42: Middle East & Africa Rotator Cuff Reinforcement Device Volume Share (%), by Application 2025 & 2033
- Figure 43: Middle East & Africa Rotator Cuff Reinforcement Device Revenue (billion), by Types 2025 & 2033
- Figure 44: Middle East & Africa Rotator Cuff Reinforcement Device Volume (K), by Types 2025 & 2033
- Figure 45: Middle East & Africa Rotator Cuff Reinforcement Device Revenue Share (%), by Types 2025 & 2033
- Figure 46: Middle East & Africa Rotator Cuff Reinforcement Device Volume Share (%), by Types 2025 & 2033
- Figure 47: Middle East & Africa Rotator Cuff Reinforcement Device Revenue (billion), by Country 2025 & 2033
- Figure 48: Middle East & Africa Rotator Cuff Reinforcement Device Volume (K), by Country 2025 & 2033
- Figure 49: Middle East & Africa Rotator Cuff Reinforcement Device Revenue Share (%), by Country 2025 & 2033
- Figure 50: Middle East & Africa Rotator Cuff Reinforcement Device Volume Share (%), by Country 2025 & 2033
- Figure 51: Asia Pacific Rotator Cuff Reinforcement Device Revenue (billion), by Application 2025 & 2033
- Figure 52: Asia Pacific Rotator Cuff Reinforcement Device Volume (K), by Application 2025 & 2033
- Figure 53: Asia Pacific Rotator Cuff Reinforcement Device Revenue Share (%), by Application 2025 & 2033
- Figure 54: Asia Pacific Rotator Cuff Reinforcement Device Volume Share (%), by Application 2025 & 2033
- Figure 55: Asia Pacific Rotator Cuff Reinforcement Device Revenue (billion), by Types 2025 & 2033
- Figure 56: Asia Pacific Rotator Cuff Reinforcement Device Volume (K), by Types 2025 & 2033
- Figure 57: Asia Pacific Rotator Cuff Reinforcement Device Revenue Share (%), by Types 2025 & 2033
- Figure 58: Asia Pacific Rotator Cuff Reinforcement Device Volume Share (%), by Types 2025 & 2033
- Figure 59: Asia Pacific Rotator Cuff Reinforcement Device Revenue (billion), by Country 2025 & 2033
- Figure 60: Asia Pacific Rotator Cuff Reinforcement Device Volume (K), by Country 2025 & 2033
- Figure 61: Asia Pacific Rotator Cuff Reinforcement Device Revenue Share (%), by Country 2025 & 2033
- Figure 62: Asia Pacific Rotator Cuff Reinforcement Device Volume Share (%), by Country 2025 & 2033
List of Tables
- Table 1: Global Rotator Cuff Reinforcement Device Revenue billion Forecast, by Application 2020 & 2033
- Table 2: Global Rotator Cuff Reinforcement Device Volume K Forecast, by Application 2020 & 2033
- Table 3: Global Rotator Cuff Reinforcement Device Revenue billion Forecast, by Types 2020 & 2033
- Table 4: Global Rotator Cuff Reinforcement Device Volume K Forecast, by Types 2020 & 2033
- Table 5: Global Rotator Cuff Reinforcement Device Revenue billion Forecast, by Region 2020 & 2033
- Table 6: Global Rotator Cuff Reinforcement Device Volume K Forecast, by Region 2020 & 2033
- Table 7: Global Rotator Cuff Reinforcement Device Revenue billion Forecast, by Application 2020 & 2033
- Table 8: Global Rotator Cuff Reinforcement Device Volume K Forecast, by Application 2020 & 2033
- Table 9: Global Rotator Cuff Reinforcement Device Revenue billion Forecast, by Types 2020 & 2033
- Table 10: Global Rotator Cuff Reinforcement Device Volume K Forecast, by Types 2020 & 2033
- Table 11: Global Rotator Cuff Reinforcement Device Revenue billion Forecast, by Country 2020 & 2033
- Table 12: Global Rotator Cuff Reinforcement Device Volume K Forecast, by Country 2020 & 2033
- Table 13: United States Rotator Cuff Reinforcement Device Revenue (billion) Forecast, by Application 2020 & 2033
- Table 14: United States Rotator Cuff Reinforcement Device Volume (K) Forecast, by Application 2020 & 2033
- Table 15: Canada Rotator Cuff Reinforcement Device Revenue (billion) Forecast, by Application 2020 & 2033
- Table 16: Canada Rotator Cuff Reinforcement Device Volume (K) Forecast, by Application 2020 & 2033
- Table 17: Mexico Rotator Cuff Reinforcement Device Revenue (billion) Forecast, by Application 2020 & 2033
- Table 18: Mexico Rotator Cuff Reinforcement Device Volume (K) Forecast, by Application 2020 & 2033
- Table 19: Global Rotator Cuff Reinforcement Device Revenue billion Forecast, by Application 2020 & 2033
- Table 20: Global Rotator Cuff Reinforcement Device Volume K Forecast, by Application 2020 & 2033
- Table 21: Global Rotator Cuff Reinforcement Device Revenue billion Forecast, by Types 2020 & 2033
- Table 22: Global Rotator Cuff Reinforcement Device Volume K Forecast, by Types 2020 & 2033
- Table 23: Global Rotator Cuff Reinforcement Device Revenue billion Forecast, by Country 2020 & 2033
- Table 24: Global Rotator Cuff Reinforcement Device Volume K Forecast, by Country 2020 & 2033
- Table 25: Brazil Rotator Cuff Reinforcement Device Revenue (billion) Forecast, by Application 2020 & 2033
- Table 26: Brazil Rotator Cuff Reinforcement Device Volume (K) Forecast, by Application 2020 & 2033
- Table 27: Argentina Rotator Cuff Reinforcement Device Revenue (billion) Forecast, by Application 2020 & 2033
- Table 28: Argentina Rotator Cuff Reinforcement Device Volume (K) Forecast, by Application 2020 & 2033
- Table 29: Rest of South America Rotator Cuff Reinforcement Device Revenue (billion) Forecast, by Application 2020 & 2033
- Table 30: Rest of South America Rotator Cuff Reinforcement Device Volume (K) Forecast, by Application 2020 & 2033
- Table 31: Global Rotator Cuff Reinforcement Device Revenue billion Forecast, by Application 2020 & 2033
- Table 32: Global Rotator Cuff Reinforcement Device Volume K Forecast, by Application 2020 & 2033
- Table 33: Global Rotator Cuff Reinforcement Device Revenue billion Forecast, by Types 2020 & 2033
- Table 34: Global Rotator Cuff Reinforcement Device Volume K Forecast, by Types 2020 & 2033
- Table 35: Global Rotator Cuff Reinforcement Device Revenue billion Forecast, by Country 2020 & 2033
- Table 36: Global Rotator Cuff Reinforcement Device Volume K Forecast, by Country 2020 & 2033
- Table 37: United Kingdom Rotator Cuff Reinforcement Device Revenue (billion) Forecast, by Application 2020 & 2033
- Table 38: United Kingdom Rotator Cuff Reinforcement Device Volume (K) Forecast, by Application 2020 & 2033
- Table 39: Germany Rotator Cuff Reinforcement Device Revenue (billion) Forecast, by Application 2020 & 2033
- Table 40: Germany Rotator Cuff Reinforcement Device Volume (K) Forecast, by Application 2020 & 2033
- Table 41: France Rotator Cuff Reinforcement Device Revenue (billion) Forecast, by Application 2020 & 2033
- Table 42: France Rotator Cuff Reinforcement Device Volume (K) Forecast, by Application 2020 & 2033
- Table 43: Italy Rotator Cuff Reinforcement Device Revenue (billion) Forecast, by Application 2020 & 2033
- Table 44: Italy Rotator Cuff Reinforcement Device Volume (K) Forecast, by Application 2020 & 2033
- Table 45: Spain Rotator Cuff Reinforcement Device Revenue (billion) Forecast, by Application 2020 & 2033
- Table 46: Spain Rotator Cuff Reinforcement Device Volume (K) Forecast, by Application 2020 & 2033
- Table 47: Russia Rotator Cuff Reinforcement Device Revenue (billion) Forecast, by Application 2020 & 2033
- Table 48: Russia Rotator Cuff Reinforcement Device Volume (K) Forecast, by Application 2020 & 2033
- Table 49: Benelux Rotator Cuff Reinforcement Device Revenue (billion) Forecast, by Application 2020 & 2033
- Table 50: Benelux Rotator Cuff Reinforcement Device Volume (K) Forecast, by Application 2020 & 2033
- Table 51: Nordics Rotator Cuff Reinforcement Device Revenue (billion) Forecast, by Application 2020 & 2033
- Table 52: Nordics Rotator Cuff Reinforcement Device Volume (K) Forecast, by Application 2020 & 2033
- Table 53: Rest of Europe Rotator Cuff Reinforcement Device Revenue (billion) Forecast, by Application 2020 & 2033
- Table 54: Rest of Europe Rotator Cuff Reinforcement Device Volume (K) Forecast, by Application 2020 & 2033
- Table 55: Global Rotator Cuff Reinforcement Device Revenue billion Forecast, by Application 2020 & 2033
- Table 56: Global Rotator Cuff Reinforcement Device Volume K Forecast, by Application 2020 & 2033
- Table 57: Global Rotator Cuff Reinforcement Device Revenue billion Forecast, by Types 2020 & 2033
- Table 58: Global Rotator Cuff Reinforcement Device Volume K Forecast, by Types 2020 & 2033
- Table 59: Global Rotator Cuff Reinforcement Device Revenue billion Forecast, by Country 2020 & 2033
- Table 60: Global Rotator Cuff Reinforcement Device Volume K Forecast, by Country 2020 & 2033
- Table 61: Turkey Rotator Cuff Reinforcement Device Revenue (billion) Forecast, by Application 2020 & 2033
- Table 62: Turkey Rotator Cuff Reinforcement Device Volume (K) Forecast, by Application 2020 & 2033
- Table 63: Israel Rotator Cuff Reinforcement Device Revenue (billion) Forecast, by Application 2020 & 2033
- Table 64: Israel Rotator Cuff Reinforcement Device Volume (K) Forecast, by Application 2020 & 2033
- Table 65: GCC Rotator Cuff Reinforcement Device Revenue (billion) Forecast, by Application 2020 & 2033
- Table 66: GCC Rotator Cuff Reinforcement Device Volume (K) Forecast, by Application 2020 & 2033
- Table 67: North Africa Rotator Cuff Reinforcement Device Revenue (billion) Forecast, by Application 2020 & 2033
- Table 68: North Africa Rotator Cuff Reinforcement Device Volume (K) Forecast, by Application 2020 & 2033
- Table 69: South Africa Rotator Cuff Reinforcement Device Revenue (billion) Forecast, by Application 2020 & 2033
- Table 70: South Africa Rotator Cuff Reinforcement Device Volume (K) Forecast, by Application 2020 & 2033
- Table 71: Rest of Middle East & Africa Rotator Cuff Reinforcement Device Revenue (billion) Forecast, by Application 2020 & 2033
- Table 72: Rest of Middle East & Africa Rotator Cuff Reinforcement Device Volume (K) Forecast, by Application 2020 & 2033
- Table 73: Global Rotator Cuff Reinforcement Device Revenue billion Forecast, by Application 2020 & 2033
- Table 74: Global Rotator Cuff Reinforcement Device Volume K Forecast, by Application 2020 & 2033
- Table 75: Global Rotator Cuff Reinforcement Device Revenue billion Forecast, by Types 2020 & 2033
- Table 76: Global Rotator Cuff Reinforcement Device Volume K Forecast, by Types 2020 & 2033
- Table 77: Global Rotator Cuff Reinforcement Device Revenue billion Forecast, by Country 2020 & 2033
- Table 78: Global Rotator Cuff Reinforcement Device Volume K Forecast, by Country 2020 & 2033
- Table 79: China Rotator Cuff Reinforcement Device Revenue (billion) Forecast, by Application 2020 & 2033
- Table 80: China Rotator Cuff Reinforcement Device Volume (K) Forecast, by Application 2020 & 2033
- Table 81: India Rotator Cuff Reinforcement Device Revenue (billion) Forecast, by Application 2020 & 2033
- Table 82: India Rotator Cuff Reinforcement Device Volume (K) Forecast, by Application 2020 & 2033
- Table 83: Japan Rotator Cuff Reinforcement Device Revenue (billion) Forecast, by Application 2020 & 2033
- Table 84: Japan Rotator Cuff Reinforcement Device Volume (K) Forecast, by Application 2020 & 2033
- Table 85: South Korea Rotator Cuff Reinforcement Device Revenue (billion) Forecast, by Application 2020 & 2033
- Table 86: South Korea Rotator Cuff Reinforcement Device Volume (K) Forecast, by Application 2020 & 2033
- Table 87: ASEAN Rotator Cuff Reinforcement Device Revenue (billion) Forecast, by Application 2020 & 2033
- Table 88: ASEAN Rotator Cuff Reinforcement Device Volume (K) Forecast, by Application 2020 & 2033
- Table 89: Oceania Rotator Cuff Reinforcement Device Revenue (billion) Forecast, by Application 2020 & 2033
- Table 90: Oceania Rotator Cuff Reinforcement Device Volume (K) Forecast, by Application 2020 & 2033
- Table 91: Rest of Asia Pacific Rotator Cuff Reinforcement Device Revenue (billion) Forecast, by Application 2020 & 2033
- Table 92: Rest of Asia Pacific Rotator Cuff Reinforcement Device Volume (K) Forecast, by Application 2020 & 2033
Frequently Asked Questions
1. What is the projected Compound Annual Growth Rate (CAGR) of the Rotator Cuff Reinforcement Device?
The projected CAGR is approximately 8.2%.
2. Which companies are prominent players in the Rotator Cuff Reinforcement Device?
Key companies in the market include Arthrex, Smith and Nephew, MicroPort, Allosource, Artelon, Biomet, Conmed Linvatec, Integra LifeSciences, RTI Biologics, Stryker, Synthasome, Tissue Regenix, Tornier, Wright Medical, Zimmer.
3. What are the main segments of the Rotator Cuff Reinforcement Device?
The market segments include Application, Types.
4. Can you provide details about the market size?
The market size is estimated to be USD 1.5 billion as of 2022.
5. What are some drivers contributing to market growth?
N/A
6. What are the notable trends driving market growth?
N/A
7. Are there any restraints impacting market growth?
N/A
8. Can you provide examples of recent developments in the market?
N/A
9. What pricing options are available for accessing the report?
Pricing options include single-user, multi-user, and enterprise licenses priced at USD 3350.00, USD 5025.00, and USD 6700.00 respectively.
10. Is the market size provided in terms of value or volume?
The market size is provided in terms of value, measured in billion and volume, measured in K.
11. Are there any specific market keywords associated with the report?
Yes, the market keyword associated with the report is "Rotator Cuff Reinforcement Device," which aids in identifying and referencing the specific market segment covered.
12. How do I determine which pricing option suits my needs best?
The pricing options vary based on user requirements and access needs. Individual users may opt for single-user licenses, while businesses requiring broader access may choose multi-user or enterprise licenses for cost-effective access to the report.
13. Are there any additional resources or data provided in the Rotator Cuff Reinforcement Device report?
While the report offers comprehensive insights, it's advisable to review the specific contents or supplementary materials provided to ascertain if additional resources or data are available.
14. How can I stay updated on further developments or reports in the Rotator Cuff Reinforcement Device?
To stay informed about further developments, trends, and reports in the Rotator Cuff Reinforcement Device, consider subscribing to industry newsletters, following relevant companies and organizations, or regularly checking reputable industry news sources and publications.
Methodology
Step 1 - Identification of Relevant Samples Size from Population Database


Step 2 - Approaches for Defining Global Market Size (Value, Volume* & Price*)

Note*: In applicable scenarios
Step 3 - Data Sources
Primary Research
- Web Analytics
- Survey Reports
- Research Institute
- Latest Research Reports
- Opinion Leaders
Secondary Research
- Annual Reports
- White Paper
- Latest Press Release
- Industry Association
- Paid Database
- Investor Presentations

Step 4 - Data Triangulation
Involves using different sources of information in order to increase the validity of a study
These sources are likely to be stakeholders in a program - participants, other researchers, program staff, other community members, and so on.
Then we put all data in single framework & apply various statistical tools to find out the dynamic on the market.
During the analysis stage, feedback from the stakeholder groups would be compared to determine areas of agreement as well as areas of divergence

