
Key Insights
The Rosé wine market is experiencing robust growth, driven by increasing consumer preference for lighter, refreshing wines, particularly among younger demographics. The market's appeal stems from its versatility – it pairs well with a wide range of cuisines and occasions, from casual picnics to upscale dinners. This broadened appeal, coupled with innovative production techniques resulting in higher quality and diverse flavor profiles, fuels significant market expansion. The segment is witnessing a rise in premium Rosé offerings, commanding higher price points and contributing to overall market value growth. While precise figures for market size and CAGR are unavailable, industry reports suggest a substantial market value, potentially exceeding $10 billion globally in 2025, with a Compound Annual Growth Rate (CAGR) between 5% and 8% projected for the forecast period (2025-2033). This growth trajectory is further supported by the expanding distribution channels, including online retailers and specialized wine shops, enhancing accessibility to a broader consumer base.
Several factors contribute to this positive outlook. The increasing popularity of Rosé among millennials and Gen Z is a significant driver. Marketing campaigns emphasizing Rosé's versatility and sophisticated image also play a role. However, potential restraints include fluctuations in grape yields due to climate change and increased competition from other alcoholic beverages. Regional variations exist, with established markets in Europe and North America continuing to grow, while emerging markets in Asia and South America offer substantial untapped potential. Key players like Summer Water, Justin Wine, and others are leveraging innovative marketing and product diversification strategies to maintain a competitive edge in this dynamic market. The premium segment is expected to demonstrate faster growth compared to the overall market, driven by consumer willingness to pay more for high-quality, unique Rosé wines.
Rose Wine Market Report: 2019-2033 – A Comprehensive Analysis
This in-depth report provides a comprehensive analysis of the global rose wine market from 2019 to 2033, offering invaluable insights for industry professionals, investors, and strategic decision-makers. The report leverages extensive data analysis to provide a clear understanding of market dynamics, growth trends, key players, and future opportunities within this dynamic beverage sector. The study covers both the parent market (wine market) and the child market (rose wine) to provide a holistic view. Projected market values are presented in million units.
Rose Wine Market Dynamics & Structure
The global rose wine market is characterized by moderate concentration, with a few major players and numerous smaller regional producers vying for market share. Technological innovation, primarily focused on production efficiency and quality enhancement, is a key driver. Regulatory frameworks concerning labeling, alcohol content, and marketing vary significantly across regions, influencing market access and competitiveness. Competitive substitutes include other types of wine (red, white, sparkling) and alcoholic beverages. The end-user demographic is broadening, encompassing diverse age groups and preferences, leading to increased segmentation within the market. M&A activity, while not exceptionally high, plays a role in consolidating market share and expanding product portfolios.
- Market Concentration: Moderately concentrated, with the top 5 players holding an estimated xx% market share in 2025.
- Technological Innovation: Focus on sustainable production practices, improved grape varietal selection, and precision fermentation techniques.
- Regulatory Framework: Significant regional variations impacting labeling, marketing, and distribution.
- Competitive Substitutes: Red wine, white wine, sparkling wine, other alcoholic beverages.
- End-User Demographics: Growing demand across age groups, with a notable increase in younger consumers.
- M&A Trends: xx M&A deals recorded between 2019-2024, with an estimated xx deals projected for 2025-2033.
Rose Wine Growth Trends & Insights
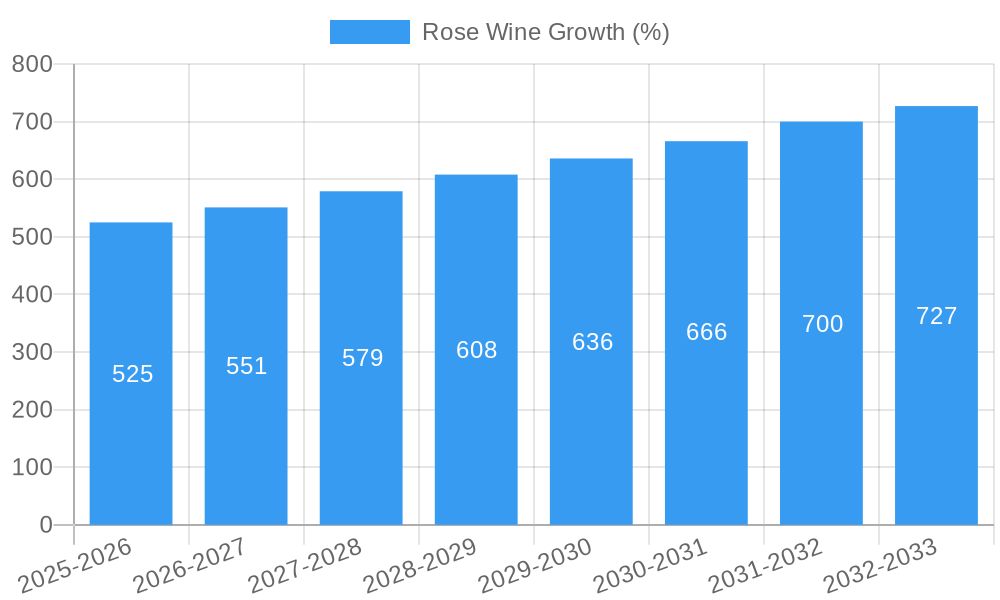
The global rose wine market exhibited robust growth during the historical period (2019-2024), driven by increasing consumer preference for lighter-bodied wines and rising disposable incomes in key markets. The market experienced a Compound Annual Growth Rate (CAGR) of xx% during this period. The estimated market size in 2025 is xx million units, projected to reach xx million units by 2033, indicating a CAGR of xx% during the forecast period (2025-2033). Technological advancements in grape cultivation and winemaking have further enhanced product quality and consistency, contributing to market expansion. Shifting consumer preferences toward healthier lifestyle choices and the growing popularity of rose wine in various culinary applications are also significant factors. Market penetration is expected to increase from xx% in 2025 to xx% by 2033.
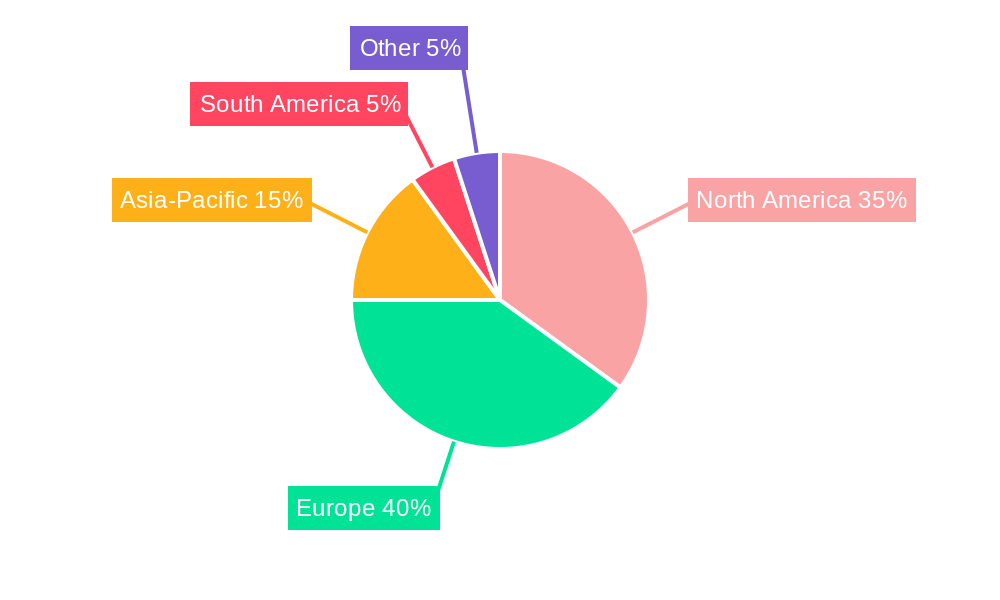
Dominant Regions, Countries, or Segments in Rose Wine
The [Specific Region, e.g., North America] region is currently the leading market for rose wine, driven by strong consumer demand and well-established distribution networks. [Specific Country, e.g., United States] holds the largest market share within this region. Several factors contribute to this dominance:
- Strong Consumer Demand: High per capita consumption and preference for lighter-bodied wines.
- Established Distribution Channels: Mature wine retail infrastructure facilitating widespread product availability.
- Favorable Economic Conditions: High disposable incomes supporting premium wine purchases.
- Marketing & Promotion: Effective marketing campaigns promoting rose wine's versatility and appeal.
The European market, specifically [Specific Country, e.g., France], also holds significant market share, characterized by a long history of rose wine production and strong regional brands. The Asia-Pacific region presents a substantial growth opportunity, fuelled by increasing wine consumption and evolving consumer tastes.
Rose Wine Product Landscape
Rose wine product innovation focuses on creating a wider range of styles, catering to diverse palates. This includes exploring various grape varieties, experimenting with fermentation techniques, and developing unique flavor profiles. Recent advancements involve using sustainable farming practices and implementing precision viticulture techniques to enhance grape quality and yield. Several producers are focusing on premiumization, offering high-quality rose wines with unique selling propositions like specific regional origin, limited-edition batches, or sustainable production methods.
Key Drivers, Barriers & Challenges in Rose Wine
Key Drivers:
- Growing consumer preference: Lighter-bodied wines appeal to broader demographics.
- Increased disposable incomes: Driving purchasing power in key markets.
- Technological innovation: Improved winemaking practices enhancing quality and yield.
- Favorable government regulations (in some regions): Supporting market expansion.
Challenges & Restraints:
- Supply chain disruptions: Impacting raw material availability and product delivery.
- Stringent regulatory hurdles (in some regions): Restricting market access.
- Intense competition: From other wine types and alcoholic beverages.
- Fluctuations in grape yields due to climate change: Threatening consistent supply. This is estimated to impact production by xx% by 2033.
Emerging Opportunities in Rose Wine
- Untapped markets: Expanding presence in emerging economies with rising wine consumption.
- Innovative applications: Rose wine cocktails and culinary pairings are gaining popularity.
- Premiumization: Demand for high-quality, niche rose wines with unique characteristics.
- Sustainability: Consumers increasingly value eco-friendly production practices.
Growth Accelerators in the Rose Wine Industry
Technological breakthroughs in viticulture and winemaking, coupled with strategic partnerships between producers and distributors, are key growth accelerators. Expansion into new markets, especially in the Asia-Pacific region, and the effective marketing of rose wine's versatility will further propel market growth. Focus on sustainable production and premiumization strategies will also drive value growth.
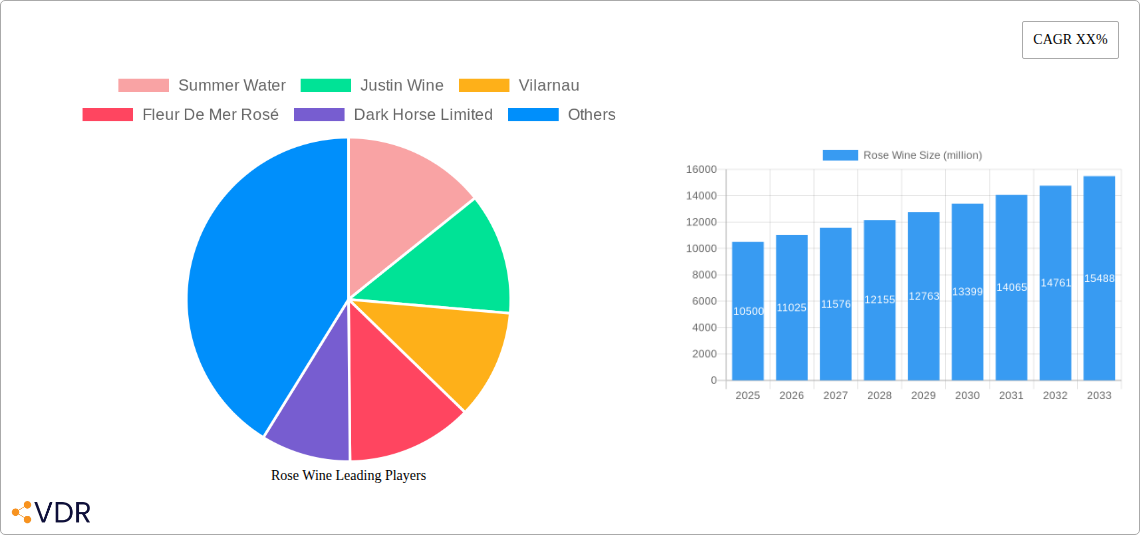
Key Players Shaping the Rose Wine Market
- Summer Water
- Justin Wine
- Vilarnau
- Fleur De Mer Rosé
- Dark Horse Limited
- Luc Belaire
- SAVED Wines
- Minuty
- Rotari
- Chloe Wine Collection
- Santa Cristina
Notable Milestones in Rose Wine Sector
- 2020: Increased adoption of sustainable viticulture practices by several key players.
- 2021: Launch of several new rose wine brands targeting younger consumers.
- 2022: Significant M&A activity consolidating market share within the premium segment.
- 2023: Increased focus on organic and biodynamic rose wine production.
- 2024: Several successful marketing campaigns targeting international markets.
In-Depth Rose Wine Market Outlook
The rose wine market is poised for sustained growth throughout the forecast period, driven by favorable consumer trends, technological advancements, and strategic market expansions. Opportunities exist in premiumization, sustainability, and innovative product development. Strategic partnerships and effective marketing will be crucial for capturing this potential and maintaining a competitive edge in this thriving sector. The market's future is bright, presenting a compelling investment opportunity and significant potential for market share expansion for both existing and new market entrants.
Rose Wine Segmentation
-
1. Application
- 1.1. Online Sales
- 1.2. Offline Sales
-
2. Types
- 2.1. Maceration Method
- 2.2. Saignée or “Bled” Method
- 2.3. Blending Method
Rose Wine Segmentation By Geography
-
1. North America
- 1.1. United States
- 1.2. Canada
- 1.3. Mexico
-
2. South America
- 2.1. Brazil
- 2.2. Argentina
- 2.3. Rest of South America
-
3. Europe
- 3.1. United Kingdom
- 3.2. Germany
- 3.3. France
- 3.4. Italy
- 3.5. Spain
- 3.6. Russia
- 3.7. Benelux
- 3.8. Nordics
- 3.9. Rest of Europe
-
4. Middle East & Africa
- 4.1. Turkey
- 4.2. Israel
- 4.3. GCC
- 4.4. North Africa
- 4.5. South Africa
- 4.6. Rest of Middle East & Africa
-
5. Asia Pacific
- 5.1. China
- 5.2. India
- 5.3. Japan
- 5.4. South Korea
- 5.5. ASEAN
- 5.6. Oceania
- 5.7. Rest of Asia Pacific
Rose Wine REPORT HIGHLIGHTS
| Aspects | Details |
|---|---|
| Study Period | 2019-2033 |
| Base Year | 2024 |
| Estimated Year | 2025 |
| Forecast Period | 2025-2033 |
| Historical Period | 2019-2024 |
| Growth Rate | CAGR of XX% from 2019-2033 |
| Segmentation |
|
Table of Contents
- 1. Introduction
- 1.1. Research Scope
- 1.2. Market Segmentation
- 1.3. Research Methodology
- 1.4. Definitions and Assumptions
- 2. Executive Summary
- 2.1. Introduction
- 3. Market Dynamics
- 3.1. Introduction
- 3.2. Market Drivers
- 3.3. Market Restrains
- 3.4. Market Trends
- 4. Market Factor Analysis
- 4.1. Porters Five Forces
- 4.2. Supply/Value Chain
- 4.3. PESTEL analysis
- 4.4. Market Entropy
- 4.5. Patent/Trademark Analysis
- 5. Global Rose Wine Analysis, Insights and Forecast, 2019-2031
- 5.1. Market Analysis, Insights and Forecast - by Application
- 5.1.1. Online Sales
- 5.1.2. Offline Sales
- 5.2. Market Analysis, Insights and Forecast - by Types
- 5.2.1. Maceration Method
- 5.2.2. Saignée or “Bled” Method
- 5.2.3. Blending Method
- 5.3. Market Analysis, Insights and Forecast - by Region
- 5.3.1. North America
- 5.3.2. South America
- 5.3.3. Europe
- 5.3.4. Middle East & Africa
- 5.3.5. Asia Pacific
- 5.1. Market Analysis, Insights and Forecast - by Application
- 6. North America Rose Wine Analysis, Insights and Forecast, 2019-2031
- 6.1. Market Analysis, Insights and Forecast - by Application
- 6.1.1. Online Sales
- 6.1.2. Offline Sales
- 6.2. Market Analysis, Insights and Forecast - by Types
- 6.2.1. Maceration Method
- 6.2.2. Saignée or “Bled” Method
- 6.2.3. Blending Method
- 6.1. Market Analysis, Insights and Forecast - by Application
- 7. South America Rose Wine Analysis, Insights and Forecast, 2019-2031
- 7.1. Market Analysis, Insights and Forecast - by Application
- 7.1.1. Online Sales
- 7.1.2. Offline Sales
- 7.2. Market Analysis, Insights and Forecast - by Types
- 7.2.1. Maceration Method
- 7.2.2. Saignée or “Bled” Method
- 7.2.3. Blending Method
- 7.1. Market Analysis, Insights and Forecast - by Application
- 8. Europe Rose Wine Analysis, Insights and Forecast, 2019-2031
- 8.1. Market Analysis, Insights and Forecast - by Application
- 8.1.1. Online Sales
- 8.1.2. Offline Sales
- 8.2. Market Analysis, Insights and Forecast - by Types
- 8.2.1. Maceration Method
- 8.2.2. Saignée or “Bled” Method
- 8.2.3. Blending Method
- 8.1. Market Analysis, Insights and Forecast - by Application
- 9. Middle East & Africa Rose Wine Analysis, Insights and Forecast, 2019-2031
- 9.1. Market Analysis, Insights and Forecast - by Application
- 9.1.1. Online Sales
- 9.1.2. Offline Sales
- 9.2. Market Analysis, Insights and Forecast - by Types
- 9.2.1. Maceration Method
- 9.2.2. Saignée or “Bled” Method
- 9.2.3. Blending Method
- 9.1. Market Analysis, Insights and Forecast - by Application
- 10. Asia Pacific Rose Wine Analysis, Insights and Forecast, 2019-2031
- 10.1. Market Analysis, Insights and Forecast - by Application
- 10.1.1. Online Sales
- 10.1.2. Offline Sales
- 10.2. Market Analysis, Insights and Forecast - by Types
- 10.2.1. Maceration Method
- 10.2.2. Saignée or “Bled” Method
- 10.2.3. Blending Method
- 10.1. Market Analysis, Insights and Forecast - by Application
- 11. Competitive Analysis
- 11.1. Global Market Share Analysis 2024
- 11.2. Company Profiles
- 11.2.1 Summer Water
- 11.2.1.1. Overview
- 11.2.1.2. Products
- 11.2.1.3. SWOT Analysis
- 11.2.1.4. Recent Developments
- 11.2.1.5. Financials (Based on Availability)
- 11.2.2 Justin Wine
- 11.2.2.1. Overview
- 11.2.2.2. Products
- 11.2.2.3. SWOT Analysis
- 11.2.2.4. Recent Developments
- 11.2.2.5. Financials (Based on Availability)
- 11.2.3 Vilarnau
- 11.2.3.1. Overview
- 11.2.3.2. Products
- 11.2.3.3. SWOT Analysis
- 11.2.3.4. Recent Developments
- 11.2.3.5. Financials (Based on Availability)
- 11.2.4 Fleur De Mer Rosé
- 11.2.4.1. Overview
- 11.2.4.2. Products
- 11.2.4.3. SWOT Analysis
- 11.2.4.4. Recent Developments
- 11.2.4.5. Financials (Based on Availability)
- 11.2.5 Dark Horse Limited
- 11.2.5.1. Overview
- 11.2.5.2. Products
- 11.2.5.3. SWOT Analysis
- 11.2.5.4. Recent Developments
- 11.2.5.5. Financials (Based on Availability)
- 11.2.6 Luc Belaire
- 11.2.6.1. Overview
- 11.2.6.2. Products
- 11.2.6.3. SWOT Analysis
- 11.2.6.4. Recent Developments
- 11.2.6.5. Financials (Based on Availability)
- 11.2.7 SAVED Wines
- 11.2.7.1. Overview
- 11.2.7.2. Products
- 11.2.7.3. SWOT Analysis
- 11.2.7.4. Recent Developments
- 11.2.7.5. Financials (Based on Availability)
- 11.2.8 Minuty
- 11.2.8.1. Overview
- 11.2.8.2. Products
- 11.2.8.3. SWOT Analysis
- 11.2.8.4. Recent Developments
- 11.2.8.5. Financials (Based on Availability)
- 11.2.9 Rotari
- 11.2.9.1. Overview
- 11.2.9.2. Products
- 11.2.9.3. SWOT Analysis
- 11.2.9.4. Recent Developments
- 11.2.9.5. Financials (Based on Availability)
- 11.2.10 Chloe Wine Collection
- 11.2.10.1. Overview
- 11.2.10.2. Products
- 11.2.10.3. SWOT Analysis
- 11.2.10.4. Recent Developments
- 11.2.10.5. Financials (Based on Availability)
- 11.2.11 Santa Cristina
- 11.2.11.1. Overview
- 11.2.11.2. Products
- 11.2.11.3. SWOT Analysis
- 11.2.11.4. Recent Developments
- 11.2.11.5. Financials (Based on Availability)
- 11.2.1 Summer Water
List of Figures
- Figure 1: Global Rose Wine Revenue Breakdown (million, %) by Region 2024 & 2032
- Figure 2: Global Rose Wine Volume Breakdown (K, %) by Region 2024 & 2032
- Figure 3: North America Rose Wine Revenue (million), by Application 2024 & 2032
- Figure 4: North America Rose Wine Volume (K), by Application 2024 & 2032
- Figure 5: North America Rose Wine Revenue Share (%), by Application 2024 & 2032
- Figure 6: North America Rose Wine Volume Share (%), by Application 2024 & 2032
- Figure 7: North America Rose Wine Revenue (million), by Types 2024 & 2032
- Figure 8: North America Rose Wine Volume (K), by Types 2024 & 2032
- Figure 9: North America Rose Wine Revenue Share (%), by Types 2024 & 2032
- Figure 10: North America Rose Wine Volume Share (%), by Types 2024 & 2032
- Figure 11: North America Rose Wine Revenue (million), by Country 2024 & 2032
- Figure 12: North America Rose Wine Volume (K), by Country 2024 & 2032
- Figure 13: North America Rose Wine Revenue Share (%), by Country 2024 & 2032
- Figure 14: North America Rose Wine Volume Share (%), by Country 2024 & 2032
- Figure 15: South America Rose Wine Revenue (million), by Application 2024 & 2032
- Figure 16: South America Rose Wine Volume (K), by Application 2024 & 2032
- Figure 17: South America Rose Wine Revenue Share (%), by Application 2024 & 2032
- Figure 18: South America Rose Wine Volume Share (%), by Application 2024 & 2032
- Figure 19: South America Rose Wine Revenue (million), by Types 2024 & 2032
- Figure 20: South America Rose Wine Volume (K), by Types 2024 & 2032
- Figure 21: South America Rose Wine Revenue Share (%), by Types 2024 & 2032
- Figure 22: South America Rose Wine Volume Share (%), by Types 2024 & 2032
- Figure 23: South America Rose Wine Revenue (million), by Country 2024 & 2032
- Figure 24: South America Rose Wine Volume (K), by Country 2024 & 2032
- Figure 25: South America Rose Wine Revenue Share (%), by Country 2024 & 2032
- Figure 26: South America Rose Wine Volume Share (%), by Country 2024 & 2032
- Figure 27: Europe Rose Wine Revenue (million), by Application 2024 & 2032
- Figure 28: Europe Rose Wine Volume (K), by Application 2024 & 2032
- Figure 29: Europe Rose Wine Revenue Share (%), by Application 2024 & 2032
- Figure 30: Europe Rose Wine Volume Share (%), by Application 2024 & 2032
- Figure 31: Europe Rose Wine Revenue (million), by Types 2024 & 2032
- Figure 32: Europe Rose Wine Volume (K), by Types 2024 & 2032
- Figure 33: Europe Rose Wine Revenue Share (%), by Types 2024 & 2032
- Figure 34: Europe Rose Wine Volume Share (%), by Types 2024 & 2032
- Figure 35: Europe Rose Wine Revenue (million), by Country 2024 & 2032
- Figure 36: Europe Rose Wine Volume (K), by Country 2024 & 2032
- Figure 37: Europe Rose Wine Revenue Share (%), by Country 2024 & 2032
- Figure 38: Europe Rose Wine Volume Share (%), by Country 2024 & 2032
- Figure 39: Middle East & Africa Rose Wine Revenue (million), by Application 2024 & 2032
- Figure 40: Middle East & Africa Rose Wine Volume (K), by Application 2024 & 2032
- Figure 41: Middle East & Africa Rose Wine Revenue Share (%), by Application 2024 & 2032
- Figure 42: Middle East & Africa Rose Wine Volume Share (%), by Application 2024 & 2032
- Figure 43: Middle East & Africa Rose Wine Revenue (million), by Types 2024 & 2032
- Figure 44: Middle East & Africa Rose Wine Volume (K), by Types 2024 & 2032
- Figure 45: Middle East & Africa Rose Wine Revenue Share (%), by Types 2024 & 2032
- Figure 46: Middle East & Africa Rose Wine Volume Share (%), by Types 2024 & 2032
- Figure 47: Middle East & Africa Rose Wine Revenue (million), by Country 2024 & 2032
- Figure 48: Middle East & Africa Rose Wine Volume (K), by Country 2024 & 2032
- Figure 49: Middle East & Africa Rose Wine Revenue Share (%), by Country 2024 & 2032
- Figure 50: Middle East & Africa Rose Wine Volume Share (%), by Country 2024 & 2032
- Figure 51: Asia Pacific Rose Wine Revenue (million), by Application 2024 & 2032
- Figure 52: Asia Pacific Rose Wine Volume (K), by Application 2024 & 2032
- Figure 53: Asia Pacific Rose Wine Revenue Share (%), by Application 2024 & 2032
- Figure 54: Asia Pacific Rose Wine Volume Share (%), by Application 2024 & 2032
- Figure 55: Asia Pacific Rose Wine Revenue (million), by Types 2024 & 2032
- Figure 56: Asia Pacific Rose Wine Volume (K), by Types 2024 & 2032
- Figure 57: Asia Pacific Rose Wine Revenue Share (%), by Types 2024 & 2032
- Figure 58: Asia Pacific Rose Wine Volume Share (%), by Types 2024 & 2032
- Figure 59: Asia Pacific Rose Wine Revenue (million), by Country 2024 & 2032
- Figure 60: Asia Pacific Rose Wine Volume (K), by Country 2024 & 2032
- Figure 61: Asia Pacific Rose Wine Revenue Share (%), by Country 2024 & 2032
- Figure 62: Asia Pacific Rose Wine Volume Share (%), by Country 2024 & 2032
List of Tables
- Table 1: Global Rose Wine Revenue million Forecast, by Region 2019 & 2032
- Table 2: Global Rose Wine Volume K Forecast, by Region 2019 & 2032
- Table 3: Global Rose Wine Revenue million Forecast, by Application 2019 & 2032
- Table 4: Global Rose Wine Volume K Forecast, by Application 2019 & 2032
- Table 5: Global Rose Wine Revenue million Forecast, by Types 2019 & 2032
- Table 6: Global Rose Wine Volume K Forecast, by Types 2019 & 2032
- Table 7: Global Rose Wine Revenue million Forecast, by Region 2019 & 2032
- Table 8: Global Rose Wine Volume K Forecast, by Region 2019 & 2032
- Table 9: Global Rose Wine Revenue million Forecast, by Application 2019 & 2032
- Table 10: Global Rose Wine Volume K Forecast, by Application 2019 & 2032
- Table 11: Global Rose Wine Revenue million Forecast, by Types 2019 & 2032
- Table 12: Global Rose Wine Volume K Forecast, by Types 2019 & 2032
- Table 13: Global Rose Wine Revenue million Forecast, by Country 2019 & 2032
- Table 14: Global Rose Wine Volume K Forecast, by Country 2019 & 2032
- Table 15: United States Rose Wine Revenue (million) Forecast, by Application 2019 & 2032
- Table 16: United States Rose Wine Volume (K) Forecast, by Application 2019 & 2032
- Table 17: Canada Rose Wine Revenue (million) Forecast, by Application 2019 & 2032
- Table 18: Canada Rose Wine Volume (K) Forecast, by Application 2019 & 2032
- Table 19: Mexico Rose Wine Revenue (million) Forecast, by Application 2019 & 2032
- Table 20: Mexico Rose Wine Volume (K) Forecast, by Application 2019 & 2032
- Table 21: Global Rose Wine Revenue million Forecast, by Application 2019 & 2032
- Table 22: Global Rose Wine Volume K Forecast, by Application 2019 & 2032
- Table 23: Global Rose Wine Revenue million Forecast, by Types 2019 & 2032
- Table 24: Global Rose Wine Volume K Forecast, by Types 2019 & 2032
- Table 25: Global Rose Wine Revenue million Forecast, by Country 2019 & 2032
- Table 26: Global Rose Wine Volume K Forecast, by Country 2019 & 2032
- Table 27: Brazil Rose Wine Revenue (million) Forecast, by Application 2019 & 2032
- Table 28: Brazil Rose Wine Volume (K) Forecast, by Application 2019 & 2032
- Table 29: Argentina Rose Wine Revenue (million) Forecast, by Application 2019 & 2032
- Table 30: Argentina Rose Wine Volume (K) Forecast, by Application 2019 & 2032
- Table 31: Rest of South America Rose Wine Revenue (million) Forecast, by Application 2019 & 2032
- Table 32: Rest of South America Rose Wine Volume (K) Forecast, by Application 2019 & 2032
- Table 33: Global Rose Wine Revenue million Forecast, by Application 2019 & 2032
- Table 34: Global Rose Wine Volume K Forecast, by Application 2019 & 2032
- Table 35: Global Rose Wine Revenue million Forecast, by Types 2019 & 2032
- Table 36: Global Rose Wine Volume K Forecast, by Types 2019 & 2032
- Table 37: Global Rose Wine Revenue million Forecast, by Country 2019 & 2032
- Table 38: Global Rose Wine Volume K Forecast, by Country 2019 & 2032
- Table 39: United Kingdom Rose Wine Revenue (million) Forecast, by Application 2019 & 2032
- Table 40: United Kingdom Rose Wine Volume (K) Forecast, by Application 2019 & 2032
- Table 41: Germany Rose Wine Revenue (million) Forecast, by Application 2019 & 2032
- Table 42: Germany Rose Wine Volume (K) Forecast, by Application 2019 & 2032
- Table 43: France Rose Wine Revenue (million) Forecast, by Application 2019 & 2032
- Table 44: France Rose Wine Volume (K) Forecast, by Application 2019 & 2032
- Table 45: Italy Rose Wine Revenue (million) Forecast, by Application 2019 & 2032
- Table 46: Italy Rose Wine Volume (K) Forecast, by Application 2019 & 2032
- Table 47: Spain Rose Wine Revenue (million) Forecast, by Application 2019 & 2032
- Table 48: Spain Rose Wine Volume (K) Forecast, by Application 2019 & 2032
- Table 49: Russia Rose Wine Revenue (million) Forecast, by Application 2019 & 2032
- Table 50: Russia Rose Wine Volume (K) Forecast, by Application 2019 & 2032
- Table 51: Benelux Rose Wine Revenue (million) Forecast, by Application 2019 & 2032
- Table 52: Benelux Rose Wine Volume (K) Forecast, by Application 2019 & 2032
- Table 53: Nordics Rose Wine Revenue (million) Forecast, by Application 2019 & 2032
- Table 54: Nordics Rose Wine Volume (K) Forecast, by Application 2019 & 2032
- Table 55: Rest of Europe Rose Wine Revenue (million) Forecast, by Application 2019 & 2032
- Table 56: Rest of Europe Rose Wine Volume (K) Forecast, by Application 2019 & 2032
- Table 57: Global Rose Wine Revenue million Forecast, by Application 2019 & 2032
- Table 58: Global Rose Wine Volume K Forecast, by Application 2019 & 2032
- Table 59: Global Rose Wine Revenue million Forecast, by Types 2019 & 2032
- Table 60: Global Rose Wine Volume K Forecast, by Types 2019 & 2032
- Table 61: Global Rose Wine Revenue million Forecast, by Country 2019 & 2032
- Table 62: Global Rose Wine Volume K Forecast, by Country 2019 & 2032
- Table 63: Turkey Rose Wine Revenue (million) Forecast, by Application 2019 & 2032
- Table 64: Turkey Rose Wine Volume (K) Forecast, by Application 2019 & 2032
- Table 65: Israel Rose Wine Revenue (million) Forecast, by Application 2019 & 2032
- Table 66: Israel Rose Wine Volume (K) Forecast, by Application 2019 & 2032
- Table 67: GCC Rose Wine Revenue (million) Forecast, by Application 2019 & 2032
- Table 68: GCC Rose Wine Volume (K) Forecast, by Application 2019 & 2032
- Table 69: North Africa Rose Wine Revenue (million) Forecast, by Application 2019 & 2032
- Table 70: North Africa Rose Wine Volume (K) Forecast, by Application 2019 & 2032
- Table 71: South Africa Rose Wine Revenue (million) Forecast, by Application 2019 & 2032
- Table 72: South Africa Rose Wine Volume (K) Forecast, by Application 2019 & 2032
- Table 73: Rest of Middle East & Africa Rose Wine Revenue (million) Forecast, by Application 2019 & 2032
- Table 74: Rest of Middle East & Africa Rose Wine Volume (K) Forecast, by Application 2019 & 2032
- Table 75: Global Rose Wine Revenue million Forecast, by Application 2019 & 2032
- Table 76: Global Rose Wine Volume K Forecast, by Application 2019 & 2032
- Table 77: Global Rose Wine Revenue million Forecast, by Types 2019 & 2032
- Table 78: Global Rose Wine Volume K Forecast, by Types 2019 & 2032
- Table 79: Global Rose Wine Revenue million Forecast, by Country 2019 & 2032
- Table 80: Global Rose Wine Volume K Forecast, by Country 2019 & 2032
- Table 81: China Rose Wine Revenue (million) Forecast, by Application 2019 & 2032
- Table 82: China Rose Wine Volume (K) Forecast, by Application 2019 & 2032
- Table 83: India Rose Wine Revenue (million) Forecast, by Application 2019 & 2032
- Table 84: India Rose Wine Volume (K) Forecast, by Application 2019 & 2032
- Table 85: Japan Rose Wine Revenue (million) Forecast, by Application 2019 & 2032
- Table 86: Japan Rose Wine Volume (K) Forecast, by Application 2019 & 2032
- Table 87: South Korea Rose Wine Revenue (million) Forecast, by Application 2019 & 2032
- Table 88: South Korea Rose Wine Volume (K) Forecast, by Application 2019 & 2032
- Table 89: ASEAN Rose Wine Revenue (million) Forecast, by Application 2019 & 2032
- Table 90: ASEAN Rose Wine Volume (K) Forecast, by Application 2019 & 2032
- Table 91: Oceania Rose Wine Revenue (million) Forecast, by Application 2019 & 2032
- Table 92: Oceania Rose Wine Volume (K) Forecast, by Application 2019 & 2032
- Table 93: Rest of Asia Pacific Rose Wine Revenue (million) Forecast, by Application 2019 & 2032
- Table 94: Rest of Asia Pacific Rose Wine Volume (K) Forecast, by Application 2019 & 2032
Frequently Asked Questions
1. What is the projected Compound Annual Growth Rate (CAGR) of the Rose Wine?
The projected CAGR is approximately XX%.
2. Which companies are prominent players in the Rose Wine?
Key companies in the market include Summer Water, Justin Wine, Vilarnau, Fleur De Mer Rosé, Dark Horse Limited, Luc Belaire, SAVED Wines, Minuty, Rotari, Chloe Wine Collection, Santa Cristina.
3. What are the main segments of the Rose Wine?
The market segments include Application, Types.
4. Can you provide details about the market size?
The market size is estimated to be USD XXX million as of 2022.
5. What are some drivers contributing to market growth?
N/A
6. What are the notable trends driving market growth?
N/A
7. Are there any restraints impacting market growth?
N/A
8. Can you provide examples of recent developments in the market?
N/A
9. What pricing options are available for accessing the report?
Pricing options include single-user, multi-user, and enterprise licenses priced at USD 3350.00, USD 5025.00, and USD 6700.00 respectively.
10. Is the market size provided in terms of value or volume?
The market size is provided in terms of value, measured in million and volume, measured in K.
11. Are there any specific market keywords associated with the report?
Yes, the market keyword associated with the report is "Rose Wine," which aids in identifying and referencing the specific market segment covered.
12. How do I determine which pricing option suits my needs best?
The pricing options vary based on user requirements and access needs. Individual users may opt for single-user licenses, while businesses requiring broader access may choose multi-user or enterprise licenses for cost-effective access to the report.
13. Are there any additional resources or data provided in the Rose Wine report?
While the report offers comprehensive insights, it's advisable to review the specific contents or supplementary materials provided to ascertain if additional resources or data are available.
14. How can I stay updated on further developments or reports in the Rose Wine?
To stay informed about further developments, trends, and reports in the Rose Wine, consider subscribing to industry newsletters, following relevant companies and organizations, or regularly checking reputable industry news sources and publications.
Methodology
Step 1 - Identification of Relevant Samples Size from Population Database


Step 2 - Approaches for Defining Global Market Size (Value, Volume* & Price*)

Note*: In applicable scenarios
Step 3 - Data Sources
Primary Research
- Web Analytics
- Survey Reports
- Research Institute
- Latest Research Reports
- Opinion Leaders
Secondary Research
- Annual Reports
- White Paper
- Latest Press Release
- Industry Association
- Paid Database
- Investor Presentations

Step 4 - Data Triangulation
Involves using different sources of information in order to increase the validity of a study
These sources are likely to be stakeholders in a program - participants, other researchers, program staff, other community members, and so on.
Then we put all data in single framework & apply various statistical tools to find out the dynamic on the market.
During the analysis stage, feedback from the stakeholder groups would be compared to determine areas of agreement as well as areas of divergence


