

Key Insights
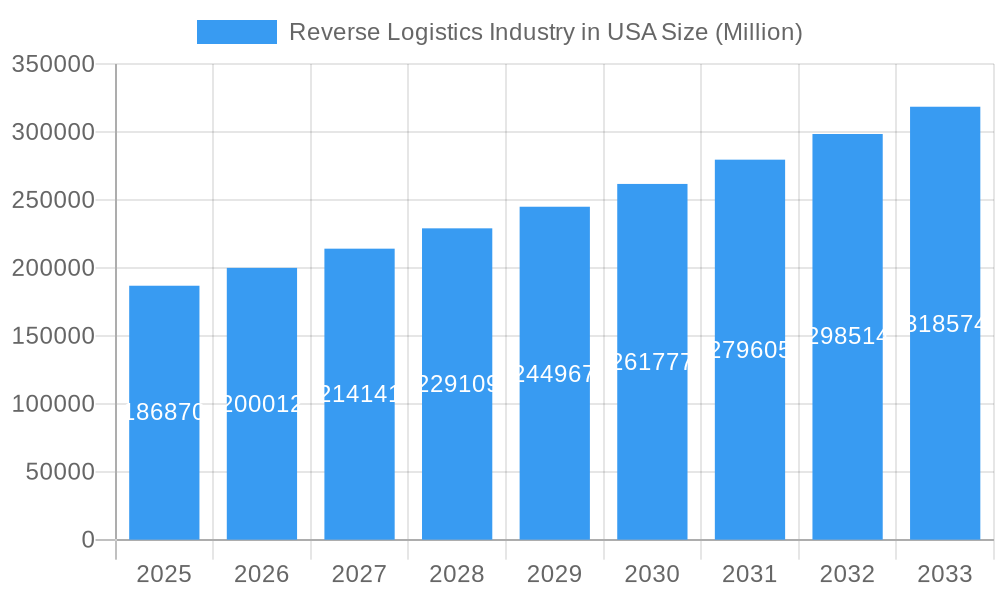
The US Reverse Logistics Industry is poised for robust expansion, driven by evolving consumer expectations and the increasing complexity of supply chains. With a current market size estimated at $186.87 billion in 2025, the sector is projected to grow at a Compound Annual Growth Rate (CAGR) of 6.69% through 2033. This sustained growth is fueled by several key factors. The burgeoning e-commerce landscape, with its inherent higher return rates, is a primary catalyst. Consumers increasingly expect seamless and convenient return processes, compelling businesses to invest in efficient reverse logistics solutions to maintain customer loyalty and manage costs. Furthermore, the growing emphasis on sustainability and the circular economy is driving a greater focus on product refurbishment, recycling, and responsible disposal, further bolstering the demand for specialized reverse logistics services. The need to manage the logistics of returned goods across various channels, from individual consumer returns to business-to-business product lifecycles, necessitates sophisticated technological integration and operational streamlining.
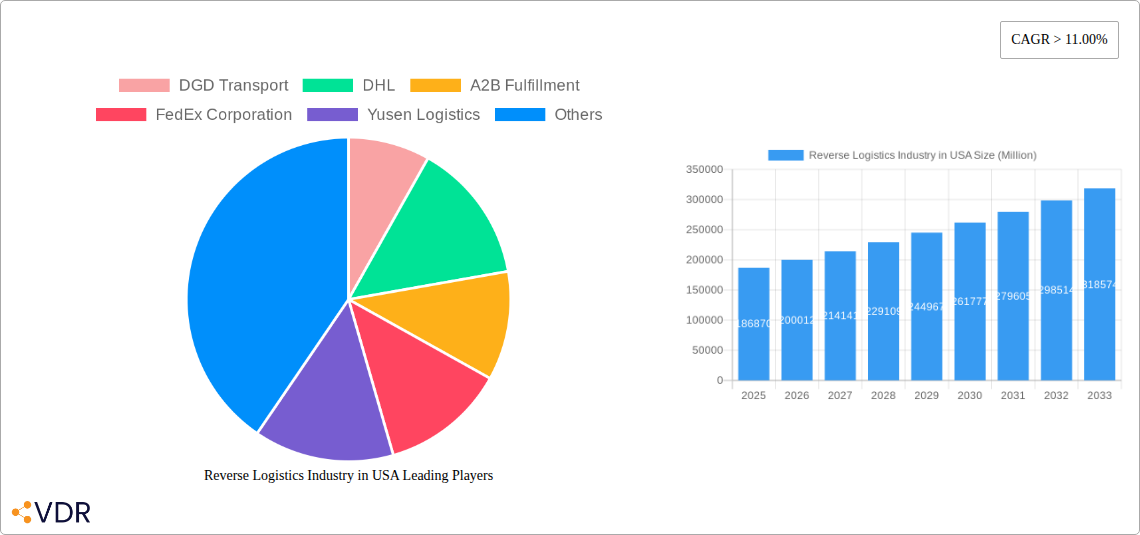
Reverse Logistics Industry in USA Market Size (In Billion)
This dynamic market is segmented across crucial functions and end-user industries, highlighting its pervasive influence. The "Transportation" segment, encompassing road, air, and other modes, plays a vital role in moving returned goods. "Warehousing" is essential for storing, inspecting, and processing these items, while "Other" value-added services address specialized needs like repair and refurbishment. On the end-user side, the "Consumer" sector, directly impacted by e-commerce returns, is a significant driver. The "Automotive" and "Healthcare and Pharmaceuticals" industries also rely heavily on reverse logistics for product recalls, equipment servicing, and waste management. This broad applicability ensures sustained demand and innovation within the US reverse logistics sector, adapting to the unique requirements of each industry. Leading companies like FedEx Corporation, United Parcel Service (UPS), and DHL are actively shaping the market through strategic investments in technology and service offerings.
Reverse Logistics Industry in USA Company Market Share
Unlock the Potential of the US Reverse Logistics Market: A Comprehensive Report
Dive deep into the dynamic and rapidly expanding Reverse Logistics Industry in USA with our in-depth market analysis. This report is meticulously crafted to equip industry professionals, investors, and stakeholders with actionable insights, strategic guidance, and a clear roadmap for navigating the complexities of product returns, refurbishment, and resale. We cover parent and child markets, offering a holistic view of this critical sector of the supply chain.
Reverse Logistics Industry in USA Market Dynamics & Structure
The U.S. reverse logistics market exhibits a moderately concentrated structure, driven by significant investments in technological innovation and evolving regulatory frameworks. Key players are actively enhancing their capabilities in areas like AI-powered sorting, predictive analytics for returns, and sustainable disposal solutions. Competitive product substitutes, primarily focused on direct disposal or simplified return processes, are increasingly being challenged by more efficient and value-generating reverse logistics strategies. End-user demographics are shifting, with a growing demand for convenient and eco-friendly return options, particularly from younger consumer segments and sustainability-conscious businesses. Mergers and acquisitions (M&A) remain a significant trend, with consolidation aimed at expanding service portfolios, geographic reach, and technological expertise.
- Market Concentration: Moderate, with leading players investing heavily in technology.
- Technological Innovation Drivers: AI in sorting, predictive analytics, sustainable disposal technologies.
- Regulatory Frameworks: Increasing focus on e-waste reduction and circular economy principles.
- Competitive Product Substitutes: Direct disposal, simplified return portals.
- End-User Demographics: Rising demand for convenience and sustainability.
- M&A Trends: Driven by service expansion and technological integration.
Reverse Logistics Industry in USA Growth Trends & Insights
The U.S. reverse logistics market is poised for substantial expansion, fueled by the exponential growth of e-commerce and an increasing emphasis on sustainability. The market is projected to experience a Compound Annual Growth Rate (CAGR) of approximately 8.5% from 2025 to 2033, reaching an estimated $250 billion in 2025 and projected to exceed $450 billion by the end of the forecast period. This growth is underpinned by a significant increase in return rates, driven by consumer purchasing habits and a desire for seamless post-purchase experiences. Technological disruptions, including advanced sorting technologies, blockchain for traceability, and automated processing, are rapidly being adopted, enhancing efficiency and reducing operational costs. Consumer behavior shifts are also playing a crucial role, with a greater preference for companies offering hassle-free returns and sustainable disposal options, pushing businesses to invest more robustly in their reverse logistics infrastructure. The integration of AI and machine learning is optimizing the entire returns process, from initial return authorization to final disposition, leading to higher recovery rates and reduced waste. The rise of the circular economy further incentivizes companies to view returned products not as waste, but as valuable assets for refurbishment, resale, or recycling. This evolving landscape necessitates a proactive approach to managing returns, turning a potential cost center into a strategic differentiator.
Dominant Regions, Countries, or Segments in Reverse Logistics Industry in USA
The Consumer segment, particularly within the Transportation (Road) function, is the dominant force driving growth in the U.S. reverse logistics market. The proliferation of e-commerce has led to an unprecedented volume of product returns from individual consumers, making efficient and cost-effective transportation of these items paramount. The sheer scale of consumer returns across diverse product categories, from apparel and electronics to home goods, creates a continuous demand for specialized reverse logistics services.
- Consumer End User Dominance:
- The vast number of online transactions leads to high return volumes.
- Expectations for convenient and free returns are a key driver.
- Growth in fashion e-commerce significantly contributes to return rates.
- Transportation (Road) Function Primacy:
- The most common and cost-effective method for collecting returns from consumers.
- Extensive network of carriers and last-mile delivery providers.
- Technological advancements in route optimization and fleet management enhance efficiency.
- Warehousing as a Critical Hub:
- Centralized facilities for sorting, inspecting, and processing returned goods.
- Increasing use of automation and robotics in these facilities.
- Strategic placement of warehouses to minimize transit times.
- Growth Potential in Healthcare and Pharmaceuticals:
- Strict regulations and product integrity requirements present unique challenges and opportunities.
- Increasing demand for efficient disposal and return of expired or damaged medical supplies.
- Technological solutions for temperature-controlled returns and secure disposal are critical.
- Automotive Sector Opportunities:
- Returns of parts, warranty claims, and end-of-life vehicle processing.
- Increasing focus on remanufacturing and parts recovery.
- The shift towards electric vehicles is creating new streams of battery returns and recycling.
- Other Industrial Activity Sectors:
- Returns of industrial equipment, machinery, and raw materials.
- Focus on repair, refurbishment, and remanufacturing to extend product lifecycles.
- Circular economy initiatives are gaining traction across various industries.
Reverse Logistics Industry in USA Product Landscape
The product landscape in U.S. reverse logistics is characterized by increasingly sophisticated software solutions and advanced hardware designed to optimize every stage of the returns process. Innovations include AI-powered sorting systems capable of accurately categorizing returned items, predictive analytics platforms that forecast return volumes and trends, and specialized packaging solutions that facilitate easier returns and reduce damage. Companies are offering integrated platforms that manage the entire return lifecycle, from customer initiation to final disposition, including refurbishment, resale, or responsible recycling. Performance metrics are centered on reducing processing times, increasing recovery rates for resale or refurbishment, minimizing waste, and enhancing customer satisfaction, thereby turning a potential cost into a value-generating opportunity.
Key Drivers, Barriers & Challenges in Reverse Logistics Industry in USA
The U.S. reverse logistics market is propelled by several key drivers, including the relentless growth of e-commerce, which inherently increases product return volumes, and a growing consumer demand for sustainable practices, pushing companies to adopt more environmentally friendly disposal and reprocessing methods. Technological advancements in automation, AI, and data analytics are also critical, enabling more efficient and cost-effective returns management.
- Drivers:
- E-commerce growth and associated return rates.
- Consumer demand for sustainable and convenient returns.
- Technological advancements (AI, automation, data analytics).
- Focus on circular economy principles.
Conversely, the industry faces significant challenges and barriers. Supply chain disruptions, including labor shortages and transportation bottlenecks, can impede the timely processing of returns. Stringent regulatory hurdles, particularly for certain product categories like pharmaceuticals and electronics, add complexity and cost. Furthermore, the competitive pressure to offer free and easy returns can strain profit margins, making efficient cost management paramount.
- Barriers & Challenges:
- Supply chain disruptions and labor shortages.
- Complex regulatory compliance.
- Cost management pressure from customer expectations.
- Infrastructure limitations in certain regions.
- Difficulty in accurately valuing returned inventory.
Emerging Opportunities in Reverse Logistics Industry in USA
Emerging opportunities in the U.S. reverse logistics sector lie in the expanding adoption of AI and machine learning for predictive return forecasting and optimized disposition decisions, significantly reducing processing costs and improving asset recovery. The growing emphasis on the circular economy is opening up new avenues for refurbished and remanufactured product sales, creating a secondary market with substantial growth potential. Furthermore, specialized reverse logistics solutions for niche industries such as healthcare and industrial equipment, which often involve complex handling and disposal requirements, represent untapped markets. The development of more sustainable and biodegradable packaging for returns also presents an innovative application, aligning with environmental consciousness.
Growth Accelerators in the Reverse Logistics Industry in USA Industry
Several catalysts are accelerating long-term growth in the U.S. reverse logistics industry. Technological breakthroughs, particularly in artificial intelligence for automated sorting and data analytics for better return prediction and management, are significantly enhancing operational efficiency and cost-effectiveness. Strategic partnerships between e-commerce giants and specialized reverse logistics providers are creating integrated solutions that streamline the returns process for consumers and businesses alike. Furthermore, market expansion strategies targeting the growing demand for sustainable product lifecycles and the increasing adoption of circular economy models are driving investment and innovation, transforming returns from a cost center into a revenue-generating avenue.
Key Players Shaping the Reverse Logistics Industry in USA Market
- DGD Transport
- DHL
- A2B Fulfillment
- FedEx Corporation
- Yusen Logistics
- United Parcel Service (UPS)
- YRC Worldwide Inc
- C H Robinson Worldwide Inc
- XPO Logistics
- Excelsior Integrated LLC
- Happy Returns Inc
- American Distribution Inc
- FW Logistics
- Newgistics Inc
- United States Postal Service (USPS)
- Optoro
Notable Milestones in Reverse Logistics Industry in USA Sector
- 2019: Increased adoption of AI-powered sorting technology by major logistics providers.
- 2020: Surge in e-commerce returns due to pandemic-driven online shopping.
- 2021: Growing emphasis on sustainable disposal and recycling initiatives.
- 2022: Significant M&A activity as companies sought to expand capabilities and market reach.
- 2023: Development of advanced predictive analytics for return forecasting.
- 2024: Increased investment in circular economy models and refurbished product marketplaces.
In-Depth Reverse Logistics Industry in USA Market Outlook
The U.S. reverse logistics market outlook is exceptionally strong, driven by an unwavering commitment to efficiency and sustainability. Growth accelerators include the pervasive integration of AI and data analytics, promising unparalleled optimization in return processing and asset recovery. Strategic alliances between e-commerce platforms and specialized logistics firms are forging seamless customer experiences, while the burgeoning circular economy and heightened consumer demand for eco-friendly options are transforming returned goods into valuable resources. This forward-looking landscape presents significant strategic opportunities for innovation and market expansion, solidifying reverse logistics as a critical component of future supply chain success.
Reverse Logistics Industry in USA Segmentation
-
1. Function
-
1.1. Transportation
- 1.1.1. Road
- 1.1.2. Air
- 1.1.3. Other Modes of Transportation
- 1.2. Warehous
- 1.3. Other Va
-
1.1. Transportation
-
2. End User
- 2.1. Consumer
- 2.2. Automotive
- 2.3. Healthcare and Pharmaceuticals
- 2.4. Other Industrial Activity Sectors
- 2.5. Other End Users
Reverse Logistics Industry in USA Segmentation By Geography
-
1. North America
- 1.1. United States
- 1.2. Canada
- 1.3. Mexico
-
2. South America
- 2.1. Brazil
- 2.2. Argentina
- 2.3. Rest of South America
-
3. Europe
- 3.1. United Kingdom
- 3.2. Germany
- 3.3. France
- 3.4. Italy
- 3.5. Spain
- 3.6. Russia
- 3.7. Benelux
- 3.8. Nordics
- 3.9. Rest of Europe
-
4. Middle East & Africa
- 4.1. Turkey
- 4.2. Israel
- 4.3. GCC
- 4.4. North Africa
- 4.5. South Africa
- 4.6. Rest of Middle East & Africa
-
5. Asia Pacific
- 5.1. China
- 5.2. India
- 5.3. Japan
- 5.4. South Korea
- 5.5. ASEAN
- 5.6. Oceania
- 5.7. Rest of Asia Pacific
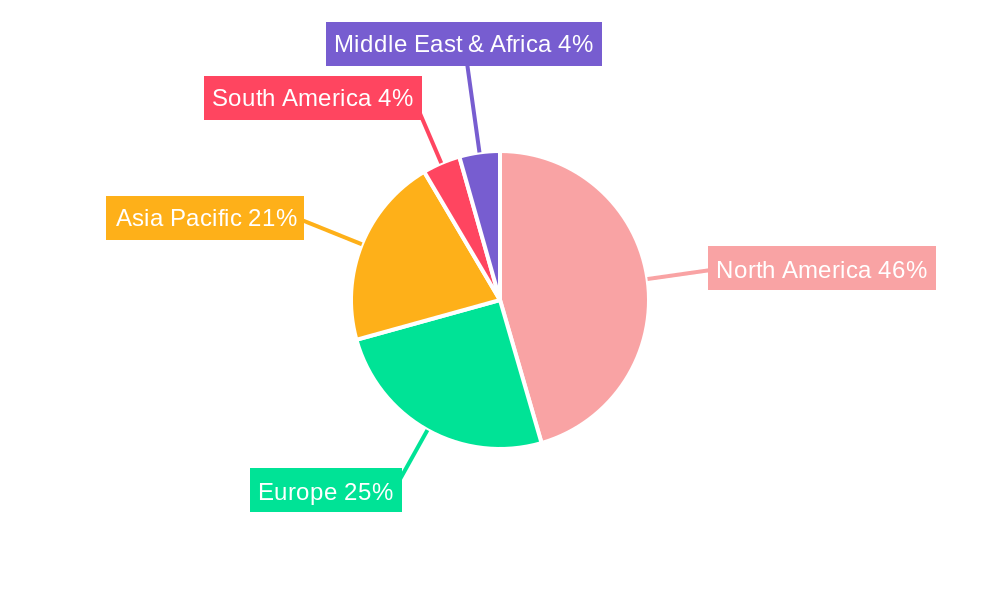
Reverse Logistics Industry in USA Regional Market Share
Geographic Coverage of Reverse Logistics Industry in USA
Reverse Logistics Industry in USA REPORT HIGHLIGHTS
| Aspects | Details |
|---|---|
| Study Period | 2020-2034 |
| Base Year | 2025 |
| Estimated Year | 2026 |
| Forecast Period | 2026-2034 |
| Historical Period | 2020-2025 |
| Growth Rate | CAGR of 6.2% from 2020-2034 |
| Segmentation |
|
Table of Contents
- 1. Introduction
- 1.1. Research Scope
- 1.2. Market Segmentation
- 1.3. Research Objective
- 1.4. Definitions and Assumptions
- 2. Executive Summary
- 2.1. Market Snapshot
- 3. Market Dynamics
- 3.1. Market Drivers
- 3.2. Market Restrains
- 3.3. Market Trends
- 3.4. Market Opportunities
- 4. Market Factor Analysis
- 4.1. Porters Five Forces
- 4.1.1. Bargaining Power of Suppliers
- 4.1.2. Bargaining Power of Buyers
- 4.1.3. Threat of New Entrants
- 4.1.4. Threat of Substitutes
- 4.1.5. Competitive Rivalry
- 4.2. PESTEL analysis
- 4.3. BCG Analysis
- 4.3.1. Stars (High Growth, High Market Share)
- 4.3.2. Cash Cows (Low Growth, High Market Share)
- 4.3.3. Question Mark (High Growth, Low Market Share)
- 4.3.4. Dogs (Low Growth, Low Market Share)
- 4.4. Ansoff Matrix Analysis
- 4.5. Supply Chain Analysis
- 4.6. Regulatory Landscape
- 4.7. Current Market Potential and Opportunity Assessment (TAM–SAM–SOM Framework)
- 4.8. VDR Analyst Note
- 4.1. Porters Five Forces
- 5. Market Analysis, Insights and Forecast 2021-2033
- 5.1. Market Analysis, Insights and Forecast - by Function
- 5.1.1. Transportation
- 5.1.1.1. Road
- 5.1.1.2. Air
- 5.1.1.3. Other Modes of Transportation
- 5.1.2. Warehous
- 5.1.3. Other Va
- 5.1.1. Transportation
- 5.2. Market Analysis, Insights and Forecast - by End User
- 5.2.1. Consumer
- 5.2.2. Automotive
- 5.2.3. Healthcare and Pharmaceuticals
- 5.2.4. Other Industrial Activity Sectors
- 5.2.5. Other End Users
- 5.3. Market Analysis, Insights and Forecast - by Region
- 5.3.1. North America
- 5.3.2. South America
- 5.3.3. Europe
- 5.3.4. Middle East & Africa
- 5.3.5. Asia Pacific
- 5.1. Market Analysis, Insights and Forecast - by Function
- 6. Global Reverse Logistics Industry in USA Analysis, Insights and Forecast, 2021-2033
- 6.1. Market Analysis, Insights and Forecast - by Function
- 6.1.1. Transportation
- 6.1.1.1. Road
- 6.1.1.2. Air
- 6.1.1.3. Other Modes of Transportation
- 6.1.2. Warehous
- 6.1.3. Other Va
- 6.1.1. Transportation
- 6.2. Market Analysis, Insights and Forecast - by End User
- 6.2.1. Consumer
- 6.2.2. Automotive
- 6.2.3. Healthcare and Pharmaceuticals
- 6.2.4. Other Industrial Activity Sectors
- 6.2.5. Other End Users
- 6.1. Market Analysis, Insights and Forecast - by Function
- 7. North America Reverse Logistics Industry in USA Analysis, Insights and Forecast, 2021-2033
- 7.1. Market Analysis, Insights and Forecast - by Function
- 7.1.1. Transportation
- 7.1.1.1. Road
- 7.1.1.2. Air
- 7.1.1.3. Other Modes of Transportation
- 7.1.2. Warehous
- 7.1.3. Other Va
- 7.1.1. Transportation
- 7.2. Market Analysis, Insights and Forecast - by End User
- 7.2.1. Consumer
- 7.2.2. Automotive
- 7.2.3. Healthcare and Pharmaceuticals
- 7.2.4. Other Industrial Activity Sectors
- 7.2.5. Other End Users
- 7.1. Market Analysis, Insights and Forecast - by Function
- 8. South America Reverse Logistics Industry in USA Analysis, Insights and Forecast, 2021-2033
- 8.1. Market Analysis, Insights and Forecast - by Function
- 8.1.1. Transportation
- 8.1.1.1. Road
- 8.1.1.2. Air
- 8.1.1.3. Other Modes of Transportation
- 8.1.2. Warehous
- 8.1.3. Other Va
- 8.1.1. Transportation
- 8.2. Market Analysis, Insights and Forecast - by End User
- 8.2.1. Consumer
- 8.2.2. Automotive
- 8.2.3. Healthcare and Pharmaceuticals
- 8.2.4. Other Industrial Activity Sectors
- 8.2.5. Other End Users
- 8.1. Market Analysis, Insights and Forecast - by Function
- 9. Europe Reverse Logistics Industry in USA Analysis, Insights and Forecast, 2021-2033
- 9.1. Market Analysis, Insights and Forecast - by Function
- 9.1.1. Transportation
- 9.1.1.1. Road
- 9.1.1.2. Air
- 9.1.1.3. Other Modes of Transportation
- 9.1.2. Warehous
- 9.1.3. Other Va
- 9.1.1. Transportation
- 9.2. Market Analysis, Insights and Forecast - by End User
- 9.2.1. Consumer
- 9.2.2. Automotive
- 9.2.3. Healthcare and Pharmaceuticals
- 9.2.4. Other Industrial Activity Sectors
- 9.2.5. Other End Users
- 9.1. Market Analysis, Insights and Forecast - by Function
- 10. Middle East & Africa Reverse Logistics Industry in USA Analysis, Insights and Forecast, 2021-2033
- 10.1. Market Analysis, Insights and Forecast - by Function
- 10.1.1. Transportation
- 10.1.1.1. Road
- 10.1.1.2. Air
- 10.1.1.3. Other Modes of Transportation
- 10.1.2. Warehous
- 10.1.3. Other Va
- 10.1.1. Transportation
- 10.2. Market Analysis, Insights and Forecast - by End User
- 10.2.1. Consumer
- 10.2.2. Automotive
- 10.2.3. Healthcare and Pharmaceuticals
- 10.2.4. Other Industrial Activity Sectors
- 10.2.5. Other End Users
- 10.1. Market Analysis, Insights and Forecast - by Function
- 11. Asia Pacific Reverse Logistics Industry in USA Analysis, Insights and Forecast, 2021-2033
- 11.1. Market Analysis, Insights and Forecast - by Function
- 11.1.1. Transportation
- 11.1.1.1. Road
- 11.1.1.2. Air
- 11.1.1.3. Other Modes of Transportation
- 11.1.2. Warehous
- 11.1.3. Other Va
- 11.1.1. Transportation
- 11.2. Market Analysis, Insights and Forecast - by End User
- 11.2.1. Consumer
- 11.2.2. Automotive
- 11.2.3. Healthcare and Pharmaceuticals
- 11.2.4. Other Industrial Activity Sectors
- 11.2.5. Other End Users
- 11.1. Market Analysis, Insights and Forecast - by Function
- 12. Competitive Analysis
- 12.1. Company Profiles
- 12.1.1 DGD Transport
- 12.1.1.1. Company Overview
- 12.1.1.2. Products
- 12.1.1.3. Company Financials
- 12.1.1.4. SWOT Analysis
- 12.1.2 DHL
- 12.1.2.1. Company Overview
- 12.1.2.2. Products
- 12.1.2.3. Company Financials
- 12.1.2.4. SWOT Analysis
- 12.1.3 A2B Fulfillment
- 12.1.3.1. Company Overview
- 12.1.3.2. Products
- 12.1.3.3. Company Financials
- 12.1.3.4. SWOT Analysis
- 12.1.4 FedEx Corporation
- 12.1.4.1. Company Overview
- 12.1.4.2. Products
- 12.1.4.3. Company Financials
- 12.1.4.4. SWOT Analysis
- 12.1.5 Yusen Logistics
- 12.1.5.1. Company Overview
- 12.1.5.2. Products
- 12.1.5.3. Company Financials
- 12.1.5.4. SWOT Analysis
- 12.1.6 United Parcel Service (UPS)
- 12.1.6.1. Company Overview
- 12.1.6.2. Products
- 12.1.6.3. Company Financials
- 12.1.6.4. SWOT Analysis
- 12.1.7 YRC Worldwide Inc
- 12.1.7.1. Company Overview
- 12.1.7.2. Products
- 12.1.7.3. Company Financials
- 12.1.7.4. SWOT Analysis
- 12.1.8 7 COMPANY PROFILES
- 12.1.8.1. Company Overview
- 12.1.8.2. Products
- 12.1.8.3. Company Financials
- 12.1.8.4. SWOT Analysis
- 12.1.9 C H Robinson Worldwide Inc
- 12.1.9.1. Company Overview
- 12.1.9.2. Products
- 12.1.9.3. Company Financials
- 12.1.9.4. SWOT Analysis
- 12.1.10 XPO Logistics
- 12.1.10.1. Company Overview
- 12.1.10.2. Products
- 12.1.10.3. Company Financials
- 12.1.10.4. SWOT Analysis
- 12.1.11 Excelsior Integrated LLC
- 12.1.11.1. Company Overview
- 12.1.11.2. Products
- 12.1.11.3. Company Financials
- 12.1.11.4. SWOT Analysis
- 12.1.12 Happy Returns Inc
- 12.1.12.1. Company Overview
- 12.1.12.2. Products
- 12.1.12.3. Company Financials
- 12.1.12.4. SWOT Analysis
- 12.1.13 American Distribution Inc
- 12.1.13.1. Company Overview
- 12.1.13.2. Products
- 12.1.13.3. Company Financials
- 12.1.13.4. SWOT Analysis
- 12.1.14 FW Logistics
- 12.1.14.1. Company Overview
- 12.1.14.2. Products
- 12.1.14.3. Company Financials
- 12.1.14.4. SWOT Analysis
- 12.1.15 Newgistics Inc
- 12.1.15.1. Company Overview
- 12.1.15.2. Products
- 12.1.15.3. Company Financials
- 12.1.15.4. SWOT Analysis
- 12.1.16 United States Postal Service (USPS)
- 12.1.16.1. Company Overview
- 12.1.16.2. Products
- 12.1.16.3. Company Financials
- 12.1.16.4. SWOT Analysis
- 12.1.17 Optoro
- 12.1.17.1. Company Overview
- 12.1.17.2. Products
- 12.1.17.3. Company Financials
- 12.1.17.4. SWOT Analysis
- 12.1.1 DGD Transport
- 12.2. Market Entropy
- 12.2.1 Company's Key Areas Served
- 12.2.2 Recent Developments
- 12.3. Company Market Share Analysis 2025
- 12.3.1 Top 5 Companies Market Share Analysis
- 12.3.2 Top 3 Companies Market Share Analysis
- 12.4. List of Potential Customers
- 13. Research Methodology
List of Figures
- Figure 1: Global Reverse Logistics Industry in USA Revenue Breakdown (undefined, %) by Region 2025 & 2033
- Figure 2: North America Reverse Logistics Industry in USA Revenue (undefined), by Function 2025 & 2033
- Figure 3: North America Reverse Logistics Industry in USA Revenue Share (%), by Function 2025 & 2033
- Figure 4: North America Reverse Logistics Industry in USA Revenue (undefined), by End User 2025 & 2033
- Figure 5: North America Reverse Logistics Industry in USA Revenue Share (%), by End User 2025 & 2033
- Figure 6: North America Reverse Logistics Industry in USA Revenue (undefined), by Country 2025 & 2033
- Figure 7: North America Reverse Logistics Industry in USA Revenue Share (%), by Country 2025 & 2033
- Figure 8: South America Reverse Logistics Industry in USA Revenue (undefined), by Function 2025 & 2033
- Figure 9: South America Reverse Logistics Industry in USA Revenue Share (%), by Function 2025 & 2033
- Figure 10: South America Reverse Logistics Industry in USA Revenue (undefined), by End User 2025 & 2033
- Figure 11: South America Reverse Logistics Industry in USA Revenue Share (%), by End User 2025 & 2033
- Figure 12: South America Reverse Logistics Industry in USA Revenue (undefined), by Country 2025 & 2033
- Figure 13: South America Reverse Logistics Industry in USA Revenue Share (%), by Country 2025 & 2033
- Figure 14: Europe Reverse Logistics Industry in USA Revenue (undefined), by Function 2025 & 2033
- Figure 15: Europe Reverse Logistics Industry in USA Revenue Share (%), by Function 2025 & 2033
- Figure 16: Europe Reverse Logistics Industry in USA Revenue (undefined), by End User 2025 & 2033
- Figure 17: Europe Reverse Logistics Industry in USA Revenue Share (%), by End User 2025 & 2033
- Figure 18: Europe Reverse Logistics Industry in USA Revenue (undefined), by Country 2025 & 2033
- Figure 19: Europe Reverse Logistics Industry in USA Revenue Share (%), by Country 2025 & 2033
- Figure 20: Middle East & Africa Reverse Logistics Industry in USA Revenue (undefined), by Function 2025 & 2033
- Figure 21: Middle East & Africa Reverse Logistics Industry in USA Revenue Share (%), by Function 2025 & 2033
- Figure 22: Middle East & Africa Reverse Logistics Industry in USA Revenue (undefined), by End User 2025 & 2033
- Figure 23: Middle East & Africa Reverse Logistics Industry in USA Revenue Share (%), by End User 2025 & 2033
- Figure 24: Middle East & Africa Reverse Logistics Industry in USA Revenue (undefined), by Country 2025 & 2033
- Figure 25: Middle East & Africa Reverse Logistics Industry in USA Revenue Share (%), by Country 2025 & 2033
- Figure 26: Asia Pacific Reverse Logistics Industry in USA Revenue (undefined), by Function 2025 & 2033
- Figure 27: Asia Pacific Reverse Logistics Industry in USA Revenue Share (%), by Function 2025 & 2033
- Figure 28: Asia Pacific Reverse Logistics Industry in USA Revenue (undefined), by End User 2025 & 2033
- Figure 29: Asia Pacific Reverse Logistics Industry in USA Revenue Share (%), by End User 2025 & 2033
- Figure 30: Asia Pacific Reverse Logistics Industry in USA Revenue (undefined), by Country 2025 & 2033
- Figure 31: Asia Pacific Reverse Logistics Industry in USA Revenue Share (%), by Country 2025 & 2033
List of Tables
- Table 1: Global Reverse Logistics Industry in USA Revenue undefined Forecast, by Function 2020 & 2033
- Table 2: Global Reverse Logistics Industry in USA Revenue undefined Forecast, by End User 2020 & 2033
- Table 3: Global Reverse Logistics Industry in USA Revenue undefined Forecast, by Region 2020 & 2033
- Table 4: Global Reverse Logistics Industry in USA Revenue undefined Forecast, by Function 2020 & 2033
- Table 5: Global Reverse Logistics Industry in USA Revenue undefined Forecast, by End User 2020 & 2033
- Table 6: Global Reverse Logistics Industry in USA Revenue undefined Forecast, by Country 2020 & 2033
- Table 7: United States Reverse Logistics Industry in USA Revenue (undefined) Forecast, by Application 2020 & 2033
- Table 8: Canada Reverse Logistics Industry in USA Revenue (undefined) Forecast, by Application 2020 & 2033
- Table 9: Mexico Reverse Logistics Industry in USA Revenue (undefined) Forecast, by Application 2020 & 2033
- Table 10: Global Reverse Logistics Industry in USA Revenue undefined Forecast, by Function 2020 & 2033
- Table 11: Global Reverse Logistics Industry in USA Revenue undefined Forecast, by End User 2020 & 2033
- Table 12: Global Reverse Logistics Industry in USA Revenue undefined Forecast, by Country 2020 & 2033
- Table 13: Brazil Reverse Logistics Industry in USA Revenue (undefined) Forecast, by Application 2020 & 2033
- Table 14: Argentina Reverse Logistics Industry in USA Revenue (undefined) Forecast, by Application 2020 & 2033
- Table 15: Rest of South America Reverse Logistics Industry in USA Revenue (undefined) Forecast, by Application 2020 & 2033
- Table 16: Global Reverse Logistics Industry in USA Revenue undefined Forecast, by Function 2020 & 2033
- Table 17: Global Reverse Logistics Industry in USA Revenue undefined Forecast, by End User 2020 & 2033
- Table 18: Global Reverse Logistics Industry in USA Revenue undefined Forecast, by Country 2020 & 2033
- Table 19: United Kingdom Reverse Logistics Industry in USA Revenue (undefined) Forecast, by Application 2020 & 2033
- Table 20: Germany Reverse Logistics Industry in USA Revenue (undefined) Forecast, by Application 2020 & 2033
- Table 21: France Reverse Logistics Industry in USA Revenue (undefined) Forecast, by Application 2020 & 2033
- Table 22: Italy Reverse Logistics Industry in USA Revenue (undefined) Forecast, by Application 2020 & 2033
- Table 23: Spain Reverse Logistics Industry in USA Revenue (undefined) Forecast, by Application 2020 & 2033
- Table 24: Russia Reverse Logistics Industry in USA Revenue (undefined) Forecast, by Application 2020 & 2033
- Table 25: Benelux Reverse Logistics Industry in USA Revenue (undefined) Forecast, by Application 2020 & 2033
- Table 26: Nordics Reverse Logistics Industry in USA Revenue (undefined) Forecast, by Application 2020 & 2033
- Table 27: Rest of Europe Reverse Logistics Industry in USA Revenue (undefined) Forecast, by Application 2020 & 2033
- Table 28: Global Reverse Logistics Industry in USA Revenue undefined Forecast, by Function 2020 & 2033
- Table 29: Global Reverse Logistics Industry in USA Revenue undefined Forecast, by End User 2020 & 2033
- Table 30: Global Reverse Logistics Industry in USA Revenue undefined Forecast, by Country 2020 & 2033
- Table 31: Turkey Reverse Logistics Industry in USA Revenue (undefined) Forecast, by Application 2020 & 2033
- Table 32: Israel Reverse Logistics Industry in USA Revenue (undefined) Forecast, by Application 2020 & 2033
- Table 33: GCC Reverse Logistics Industry in USA Revenue (undefined) Forecast, by Application 2020 & 2033
- Table 34: North Africa Reverse Logistics Industry in USA Revenue (undefined) Forecast, by Application 2020 & 2033
- Table 35: South Africa Reverse Logistics Industry in USA Revenue (undefined) Forecast, by Application 2020 & 2033
- Table 36: Rest of Middle East & Africa Reverse Logistics Industry in USA Revenue (undefined) Forecast, by Application 2020 & 2033
- Table 37: Global Reverse Logistics Industry in USA Revenue undefined Forecast, by Function 2020 & 2033
- Table 38: Global Reverse Logistics Industry in USA Revenue undefined Forecast, by End User 2020 & 2033
- Table 39: Global Reverse Logistics Industry in USA Revenue undefined Forecast, by Country 2020 & 2033
- Table 40: China Reverse Logistics Industry in USA Revenue (undefined) Forecast, by Application 2020 & 2033
- Table 41: India Reverse Logistics Industry in USA Revenue (undefined) Forecast, by Application 2020 & 2033
- Table 42: Japan Reverse Logistics Industry in USA Revenue (undefined) Forecast, by Application 2020 & 2033
- Table 43: South Korea Reverse Logistics Industry in USA Revenue (undefined) Forecast, by Application 2020 & 2033
- Table 44: ASEAN Reverse Logistics Industry in USA Revenue (undefined) Forecast, by Application 2020 & 2033
- Table 45: Oceania Reverse Logistics Industry in USA Revenue (undefined) Forecast, by Application 2020 & 2033
- Table 46: Rest of Asia Pacific Reverse Logistics Industry in USA Revenue (undefined) Forecast, by Application 2020 & 2033
Frequently Asked Questions
1. What is the projected Compound Annual Growth Rate (CAGR) of the Reverse Logistics Industry in USA?
The projected CAGR is approximately 6.2%.
2. Which companies are prominent players in the Reverse Logistics Industry in USA?
Key companies in the market include DGD Transport, DHL, A2B Fulfillment, FedEx Corporation, Yusen Logistics, United Parcel Service (UPS), YRC Worldwide Inc, 7 COMPANY PROFILES, C H Robinson Worldwide Inc, XPO Logistics, Excelsior Integrated LLC, Happy Returns Inc, American Distribution Inc, FW Logistics, Newgistics Inc, United States Postal Service (USPS), Optoro.
3. What are the main segments of the Reverse Logistics Industry in USA?
The market segments include Function, End User.
4. Can you provide details about the market size?
The market size is estimated to be USD XXX N/A as of 2022.
5. What are some drivers contributing to market growth?
N/A
6. What are the notable trends driving market growth?
Growth in E-commerce and Technology Propels the Demand for Efficient Return Logistics.
7. Are there any restraints impacting market growth?
N/A
8. Can you provide examples of recent developments in the market?
N/A
9. What pricing options are available for accessing the report?
Pricing options include single-user, multi-user, and enterprise licenses priced at USD 3800, USD 4500, and USD 5800 respectively.
10. Is the market size provided in terms of value or volume?
The market size is provided in terms of value, measured in N/A.
11. Are there any specific market keywords associated with the report?
Yes, the market keyword associated with the report is "Reverse Logistics Industry in USA," which aids in identifying and referencing the specific market segment covered.
12. How do I determine which pricing option suits my needs best?
The pricing options vary based on user requirements and access needs. Individual users may opt for single-user licenses, while businesses requiring broader access may choose multi-user or enterprise licenses for cost-effective access to the report.
13. Are there any additional resources or data provided in the Reverse Logistics Industry in USA report?
While the report offers comprehensive insights, it's advisable to review the specific contents or supplementary materials provided to ascertain if additional resources or data are available.
14. How can I stay updated on further developments or reports in the Reverse Logistics Industry in USA?
To stay informed about further developments, trends, and reports in the Reverse Logistics Industry in USA, consider subscribing to industry newsletters, following relevant companies and organizations, or regularly checking reputable industry news sources and publications.
Methodology
Step 1 - Identification of Relevant Samples Size from Population Database


Step 2 - Approaches for Defining Global Market Size (Value, Volume* & Price*)

Note*: In applicable scenarios
Step 3 - Data Sources
Primary Research
- Web Analytics
- Survey Reports
- Research Institute
- Latest Research Reports
- Opinion Leaders
Secondary Research
- Annual Reports
- White Paper
- Latest Press Release
- Industry Association
- Paid Database
- Investor Presentations

Step 4 - Data Triangulation
Involves using different sources of information in order to increase the validity of a study
These sources are likely to be stakeholders in a program - participants, other researchers, program staff, other community members, and so on.
Then we put all data in single framework & apply various statistical tools to find out the dynamic on the market.
During the analysis stage, feedback from the stakeholder groups would be compared to determine areas of agreement as well as areas of divergence