

Key Insights
The Remote Sensing Technology market is poised for significant expansion, driven by escalating demand across critical sectors. The market is projected to achieve a compound annual growth rate (CAGR) of 11.59%, reaching a market size of 25.37 billion by 2025. This growth trajectory is propelled by the indispensable need for accurate geographical data in agriculture, urban planning, environmental monitoring, and disaster management. Advancements in satellite technology, including miniaturization and higher-resolution imaging, are expanding market opportunities, while cloud-based solutions enhance data accessibility and reduce operational costs. Government initiatives supporting space exploration further bolster market expansion. Key end-users include commercial enterprises and government/military sectors. The satellite mass segment, encompassing various satellite types, and subsystems like Propulsion Hardware & Propellant, Satellite Bus & Subsystems, and Solar Array & Power Hardware, represent substantial market segments due to their technological complexity. The competitive landscape features established aerospace firms and emerging innovators.
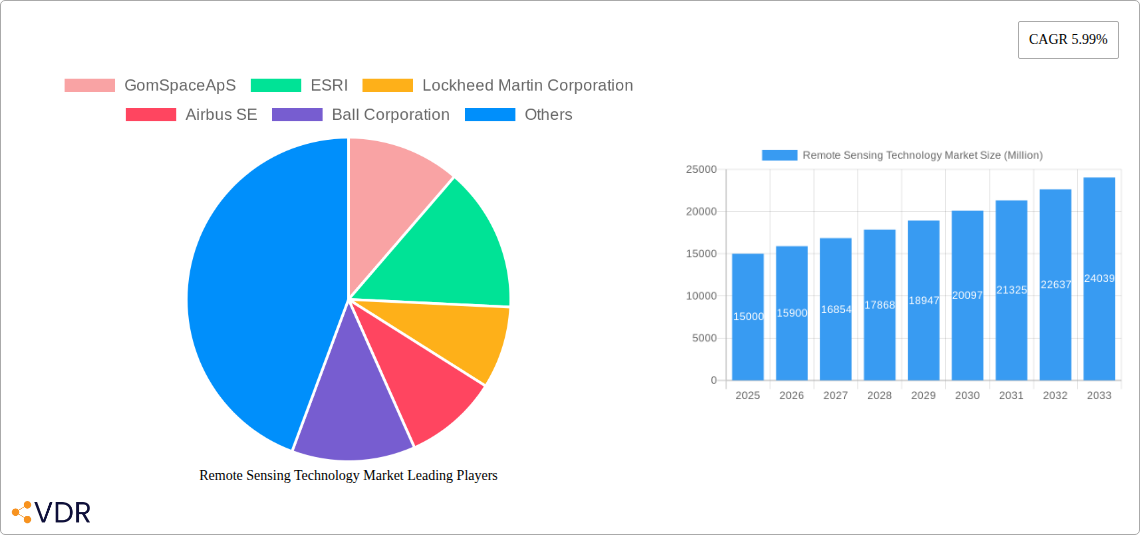
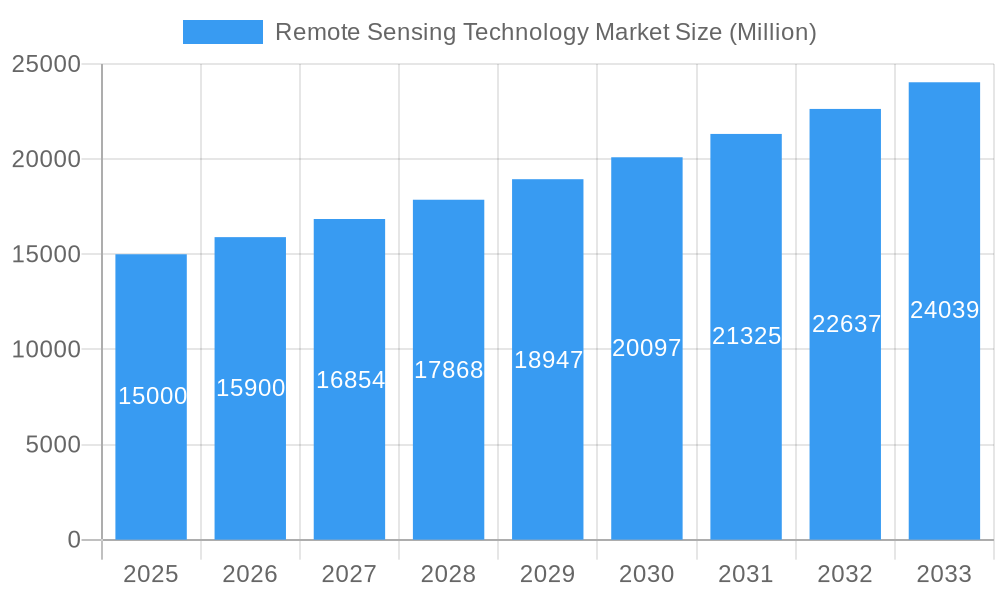
Remote Sensing Technology Market Market Size (In Billion)
Future market dynamics will be shaped by the integration of the Internet of Things (IoT) and AI-driven data analytics, enhancing decision-making capabilities. Industry consolidation through mergers and acquisitions is also anticipated. Key challenges include the high cost of satellite development and launch, regulatory complexities, and data security/privacy concerns. Despite these obstacles, the Remote Sensing Technology market's outlook remains robust, fueled by ongoing innovation, sustained demand, and broadening applications. Strategic collaborations will be vital for achieving sustained growth and market leadership.
Remote Sensing Technology Market Company Market Share
Remote Sensing Technology Market: A Comprehensive Market Report (2019-2033)
This comprehensive report provides an in-depth analysis of the Remote Sensing Technology market, encompassing its dynamics, growth trends, dominant segments, and key players. The study period spans from 2019 to 2033, with 2025 serving as the base and estimated year. The report segments the market by end-user (Commercial, Military & Government, Other), satellite mass (Below 10 Kg, 10-100kg, 100-500kg, 500-1000kg, above 1000kg), orbit class (LEO, MEO, GEO), and satellite subsystems (Propulsion Hardware and Propellant, Satellite Bus & Subsystems, Solar Array & Power Hardware, Structures, Harness & Mechanisms). The report projects a market value of xx Million by 2033.
Remote Sensing Technology Market Market Dynamics & Structure
The Remote Sensing Technology market is characterized by a moderately concentrated landscape, with key players like Lockheed Martin Corporation, Airbus SE, and Maxar Technologies Inc. holding significant market share. The market's growth is fueled by technological advancements in satellite technology, miniaturization, and improved sensor capabilities. Government initiatives promoting space exploration and national security further drive demand. However, high initial investment costs and stringent regulatory frameworks pose challenges. The increasing adoption of remote sensing in commercial applications, such as precision agriculture and environmental monitoring, is a major growth driver. Furthermore, mergers and acquisitions (M&A) activity is significant, with xx M&A deals recorded in the past five years, contributing to market consolidation.
- Market Concentration: Moderately concentrated, with top 5 players holding approximately xx% market share in 2025.
- Technological Innovation: Miniaturization, improved sensor resolution, AI integration, and cost reduction are key drivers.
- Regulatory Framework: Stringent regulations regarding satellite launches and data usage impact market growth.
- Competitive Substitutes: Limited direct substitutes, but alternative data acquisition methods pose indirect competition.
- End-User Demographics: Commercial sector is experiencing fastest growth, followed by Military & Government.
- M&A Trends: Consolidation through acquisitions is a prominent trend, driven by the desire to expand capabilities and market share.
Remote Sensing Technology Market Growth Trends & Insights
The global Remote Sensing Technology market is experiencing robust growth, exhibiting a CAGR of xx% during the forecast period (2025-2033). Market size expanded from xx Million in 2019 to xx Million in 2024. This growth is primarily driven by increasing demand for high-resolution imagery and data across various sectors. The adoption rate of remote sensing technologies is rising rapidly, particularly in developing economies, owing to decreasing costs and improved accessibility. Technological disruptions, such as the proliferation of CubeSats and nanosatellites, are significantly impacting the market, offering greater affordability and flexibility. Consumer behavior is shifting towards real-time data access and cloud-based solutions.
- Market Size Evolution: Significant expansion, driven by increasing commercial and governmental adoption.
- Adoption Rates: Rapid increase in adoption across diverse sectors.
- Technological Disruptions: Miniaturization and the rise of CubeSats are transforming the market.
- Consumer Behavior Shifts: Demand for real-time data and cloud-based platforms is growing.
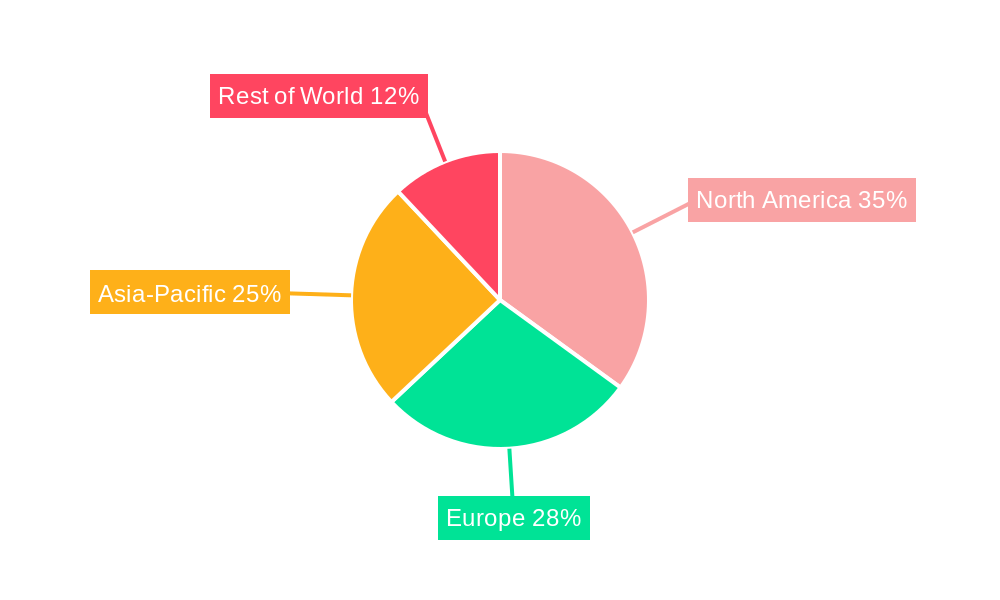
Dominant Regions, Countries, or Segments in Remote Sensing Technology Market
North America currently dominates the Remote Sensing Technology market, holding xx% of the global market share in 2025, followed by Europe and Asia-Pacific. The strong presence of major players, advanced technological infrastructure, and high government spending on defense and space exploration contribute to this dominance. However, the Asia-Pacific region is expected to experience the highest growth rate during the forecast period, driven by increasing investments in infrastructure development and a growing demand for high-resolution imagery in various applications. Within the segments, the Commercial end-user segment is witnessing significant expansion due to increasing private sector adoption. Similarly, the LEO orbit class is experiencing high growth due to cost-effectiveness and ease of access. The 10-100 kg satellite mass segment holds a significant market share due to the increasing popularity of small satellites.
- Key Drivers (North America): Strong presence of major players, well-developed technological infrastructure, high government spending.
- Key Drivers (Asia-Pacific): Rapid economic growth, increasing investments in infrastructure, growing demand for high-resolution imagery.
- Dominant Segments: Commercial end-user, LEO orbit class, 10-100 kg satellite mass segment.
Remote Sensing Technology Market Product Landscape
The Remote Sensing Technology market is characterized by continuous innovation in sensor technology, data processing techniques, and satellite platform design. Advancements like hyperspectral imaging, LiDAR, and SAR technologies are enhancing data quality and expanding applications. Products are increasingly integrated with AI and machine learning algorithms for improved data analysis and automated feature extraction. Key selling propositions include high resolution, improved accuracy, real-time data delivery, and cost-effectiveness. Technological advancements are focused on reducing size, weight, and power (SWaP) while simultaneously improving performance.
Key Drivers, Barriers & Challenges in Remote Sensing Technology Market
Key Drivers:
- Technological advancements in sensor technology and data processing.
- Increasing demand for high-resolution imagery and geospatial data across various sectors.
- Government initiatives promoting space exploration and national security.
- Decreasing costs of satellite technology and data acquisition.
Challenges:
- High initial investment costs and operational expenses.
- Stringent regulatory frameworks and licensing requirements.
- Data security and privacy concerns.
- Competition from alternative data acquisition methods. This results in a xx% reduction in market growth yearly.
Emerging Opportunities in Remote Sensing Technology Market
- Expansion into untapped markets, such as developing economies.
- Development of innovative applications, such as precision agriculture, environmental monitoring, and disaster management.
- Integration of remote sensing data with other data sources, such as IoT and social media.
- Focus on providing value-added services based on remote sensing data.
Growth Accelerators in the Remote Sensing Technology Market Industry
Long-term growth will be accelerated by technological breakthroughs in miniaturization, AI-driven data analytics, and the development of new sensor technologies. Strategic partnerships between satellite operators, data providers, and end-users will expand market reach and create new revenue streams. Expansion into new applications and markets will drive significant growth, with a focus on providing tailored solutions to address specific industry needs.
Key Players Shaping the Remote Sensing Technology Market Market
- GomSpace ApS
- ESRI
- Lockheed Martin Corporation
- Airbus SE
- Ball Corporation
- Japan Aerospace Exploration Agency (JAXA)
- China Aerospace Science and Technology Corporation (CASC)
- Maxar Technologies Inc
- ROSCOSMOS
- Thale
- Planet Labs Inc
- Northrop Grumman Corporation
- Indian Space Research Organisation (ISRO)
- IHI Corporation
- Spire Global Inc
Notable Milestones in Remote Sensing Technology Market Sector
- March 2023: JAXA scheduled the launch of the H3 Launch Vehicle with ALOS-3, signifying advancements in Earth observation capabilities.
- February 2023: NASA and Esri's collaboration expands access to geospatial data, boosting research and development.
- January 2023: Airbus Defence and Space secured a contract with Poland for two high-performance Earth observation satellites, indicating growing demand for geospatial intelligence.
In-Depth Remote Sensing Technology Market Market Outlook
The Remote Sensing Technology market is poised for sustained growth, driven by ongoing technological innovations, expanding applications, and increasing demand for geospatial data across various sectors. Strategic partnerships, market expansion into new geographical regions, and the development of value-added services based on remote sensing data will create significant opportunities for market players. The market's future potential is substantial, with considerable room for growth in emerging economies and new applications.
Remote Sensing Technology Market Segmentation
-
1. Satellite Mass
- 1.1. 10-100kg
- 1.2. 100-500kg
- 1.3. 500-1000kg
- 1.4. Below 10 Kg
- 1.5. above 1000kg
-
2. Orbit Class
- 2.1. GEO
- 2.2. LEO
- 2.3. MEO
-
3. Satellite Subsystem
- 3.1. Propulsion Hardware and Propellant
- 3.2. Satellite Bus & Subsystems
- 3.3. Solar Array & Power Hardware
- 3.4. Structures, Harness & Mechanisms
-
4. End User
- 4.1. Commercial
- 4.2. Military & Government
- 4.3. Other
Remote Sensing Technology Market Segmentation By Geography
-
1. North America
- 1.1. United States
- 1.2. Canada
- 1.3. Mexico
-
2. South America
- 2.1. Brazil
- 2.2. Argentina
- 2.3. Rest of South America
-
3. Europe
- 3.1. United Kingdom
- 3.2. Germany
- 3.3. France
- 3.4. Italy
- 3.5. Spain
- 3.6. Russia
- 3.7. Benelux
- 3.8. Nordics
- 3.9. Rest of Europe
-
4. Middle East & Africa
- 4.1. Turkey
- 4.2. Israel
- 4.3. GCC
- 4.4. North Africa
- 4.5. South Africa
- 4.6. Rest of Middle East & Africa
-
5. Asia Pacific
- 5.1. China
- 5.2. India
- 5.3. Japan
- 5.4. South Korea
- 5.5. ASEAN
- 5.6. Oceania
- 5.7. Rest of Asia Pacific
Remote Sensing Technology Market Regional Market Share
Geographic Coverage of Remote Sensing Technology Market
Remote Sensing Technology Market REPORT HIGHLIGHTS
| Aspects | Details |
|---|---|
| Study Period | 2020-2034 |
| Base Year | 2025 |
| Estimated Year | 2026 |
| Forecast Period | 2026-2034 |
| Historical Period | 2020-2025 |
| Growth Rate | CAGR of 11.59% from 2020-2034 |
| Segmentation |
|
Table of Contents
- 1. Introduction
- 1.1. Research Scope
- 1.2. Market Segmentation
- 1.3. Research Objective
- 1.4. Definitions and Assumptions
- 2. Executive Summary
- 2.1. Market Snapshot
- 3. Market Dynamics
- 3.1. Market Drivers
- 3.2. Market Restrains
- 3.3. Market Trends
- 3.4. Market Opportunities
- 4. Market Factor Analysis
- 4.1. Porters Five Forces
- 4.1.1. Bargaining Power of Suppliers
- 4.1.2. Bargaining Power of Buyers
- 4.1.3. Threat of New Entrants
- 4.1.4. Threat of Substitutes
- 4.1.5. Competitive Rivalry
- 4.2. PESTEL analysis
- 4.3. BCG Analysis
- 4.3.1. Stars (High Growth, High Market Share)
- 4.3.2. Cash Cows (Low Growth, High Market Share)
- 4.3.3. Question Mark (High Growth, Low Market Share)
- 4.3.4. Dogs (Low Growth, Low Market Share)
- 4.4. Ansoff Matrix Analysis
- 4.5. Supply Chain Analysis
- 4.6. Regulatory Landscape
- 4.7. Current Market Potential and Opportunity Assessment (TAM–SAM–SOM Framework)
- 4.8. VDR Analyst Note
- 4.1. Porters Five Forces
- 5. Market Analysis, Insights and Forecast 2021-2033
- 5.1. Market Analysis, Insights and Forecast - by Satellite Mass
- 5.1.1. 10-100kg
- 5.1.2. 100-500kg
- 5.1.3. 500-1000kg
- 5.1.4. Below 10 Kg
- 5.1.5. above 1000kg
- 5.2. Market Analysis, Insights and Forecast - by Orbit Class
- 5.2.1. GEO
- 5.2.2. LEO
- 5.2.3. MEO
- 5.3. Market Analysis, Insights and Forecast - by Satellite Subsystem
- 5.3.1. Propulsion Hardware and Propellant
- 5.3.2. Satellite Bus & Subsystems
- 5.3.3. Solar Array & Power Hardware
- 5.3.4. Structures, Harness & Mechanisms
- 5.4. Market Analysis, Insights and Forecast - by End User
- 5.4.1. Commercial
- 5.4.2. Military & Government
- 5.4.3. Other
- 5.5. Market Analysis, Insights and Forecast - by Region
- 5.5.1. North America
- 5.5.2. South America
- 5.5.3. Europe
- 5.5.4. Middle East & Africa
- 5.5.5. Asia Pacific
- 5.1. Market Analysis, Insights and Forecast - by Satellite Mass
- 6. Global Remote Sensing Technology Market Analysis, Insights and Forecast, 2021-2033
- 6.1. Market Analysis, Insights and Forecast - by Satellite Mass
- 6.1.1. 10-100kg
- 6.1.2. 100-500kg
- 6.1.3. 500-1000kg
- 6.1.4. Below 10 Kg
- 6.1.5. above 1000kg
- 6.2. Market Analysis, Insights and Forecast - by Orbit Class
- 6.2.1. GEO
- 6.2.2. LEO
- 6.2.3. MEO
- 6.3. Market Analysis, Insights and Forecast - by Satellite Subsystem
- 6.3.1. Propulsion Hardware and Propellant
- 6.3.2. Satellite Bus & Subsystems
- 6.3.3. Solar Array & Power Hardware
- 6.3.4. Structures, Harness & Mechanisms
- 6.4. Market Analysis, Insights and Forecast - by End User
- 6.4.1. Commercial
- 6.4.2. Military & Government
- 6.4.3. Other
- 6.1. Market Analysis, Insights and Forecast - by Satellite Mass
- 7. North America Remote Sensing Technology Market Analysis, Insights and Forecast, 2021-2033
- 7.1. Market Analysis, Insights and Forecast - by Satellite Mass
- 7.1.1. 10-100kg
- 7.1.2. 100-500kg
- 7.1.3. 500-1000kg
- 7.1.4. Below 10 Kg
- 7.1.5. above 1000kg
- 7.2. Market Analysis, Insights and Forecast - by Orbit Class
- 7.2.1. GEO
- 7.2.2. LEO
- 7.2.3. MEO
- 7.3. Market Analysis, Insights and Forecast - by Satellite Subsystem
- 7.3.1. Propulsion Hardware and Propellant
- 7.3.2. Satellite Bus & Subsystems
- 7.3.3. Solar Array & Power Hardware
- 7.3.4. Structures, Harness & Mechanisms
- 7.4. Market Analysis, Insights and Forecast - by End User
- 7.4.1. Commercial
- 7.4.2. Military & Government
- 7.4.3. Other
- 7.1. Market Analysis, Insights and Forecast - by Satellite Mass
- 8. South America Remote Sensing Technology Market Analysis, Insights and Forecast, 2021-2033
- 8.1. Market Analysis, Insights and Forecast - by Satellite Mass
- 8.1.1. 10-100kg
- 8.1.2. 100-500kg
- 8.1.3. 500-1000kg
- 8.1.4. Below 10 Kg
- 8.1.5. above 1000kg
- 8.2. Market Analysis, Insights and Forecast - by Orbit Class
- 8.2.1. GEO
- 8.2.2. LEO
- 8.2.3. MEO
- 8.3. Market Analysis, Insights and Forecast - by Satellite Subsystem
- 8.3.1. Propulsion Hardware and Propellant
- 8.3.2. Satellite Bus & Subsystems
- 8.3.3. Solar Array & Power Hardware
- 8.3.4. Structures, Harness & Mechanisms
- 8.4. Market Analysis, Insights and Forecast - by End User
- 8.4.1. Commercial
- 8.4.2. Military & Government
- 8.4.3. Other
- 8.1. Market Analysis, Insights and Forecast - by Satellite Mass
- 9. Europe Remote Sensing Technology Market Analysis, Insights and Forecast, 2021-2033
- 9.1. Market Analysis, Insights and Forecast - by Satellite Mass
- 9.1.1. 10-100kg
- 9.1.2. 100-500kg
- 9.1.3. 500-1000kg
- 9.1.4. Below 10 Kg
- 9.1.5. above 1000kg
- 9.2. Market Analysis, Insights and Forecast - by Orbit Class
- 9.2.1. GEO
- 9.2.2. LEO
- 9.2.3. MEO
- 9.3. Market Analysis, Insights and Forecast - by Satellite Subsystem
- 9.3.1. Propulsion Hardware and Propellant
- 9.3.2. Satellite Bus & Subsystems
- 9.3.3. Solar Array & Power Hardware
- 9.3.4. Structures, Harness & Mechanisms
- 9.4. Market Analysis, Insights and Forecast - by End User
- 9.4.1. Commercial
- 9.4.2. Military & Government
- 9.4.3. Other
- 9.1. Market Analysis, Insights and Forecast - by Satellite Mass
- 10. Middle East & Africa Remote Sensing Technology Market Analysis, Insights and Forecast, 2021-2033
- 10.1. Market Analysis, Insights and Forecast - by Satellite Mass
- 10.1.1. 10-100kg
- 10.1.2. 100-500kg
- 10.1.3. 500-1000kg
- 10.1.4. Below 10 Kg
- 10.1.5. above 1000kg
- 10.2. Market Analysis, Insights and Forecast - by Orbit Class
- 10.2.1. GEO
- 10.2.2. LEO
- 10.2.3. MEO
- 10.3. Market Analysis, Insights and Forecast - by Satellite Subsystem
- 10.3.1. Propulsion Hardware and Propellant
- 10.3.2. Satellite Bus & Subsystems
- 10.3.3. Solar Array & Power Hardware
- 10.3.4. Structures, Harness & Mechanisms
- 10.4. Market Analysis, Insights and Forecast - by End User
- 10.4.1. Commercial
- 10.4.2. Military & Government
- 10.4.3. Other
- 10.1. Market Analysis, Insights and Forecast - by Satellite Mass
- 11. Asia Pacific Remote Sensing Technology Market Analysis, Insights and Forecast, 2021-2033
- 11.1. Market Analysis, Insights and Forecast - by Satellite Mass
- 11.1.1. 10-100kg
- 11.1.2. 100-500kg
- 11.1.3. 500-1000kg
- 11.1.4. Below 10 Kg
- 11.1.5. above 1000kg
- 11.2. Market Analysis, Insights and Forecast - by Orbit Class
- 11.2.1. GEO
- 11.2.2. LEO
- 11.2.3. MEO
- 11.3. Market Analysis, Insights and Forecast - by Satellite Subsystem
- 11.3.1. Propulsion Hardware and Propellant
- 11.3.2. Satellite Bus & Subsystems
- 11.3.3. Solar Array & Power Hardware
- 11.3.4. Structures, Harness & Mechanisms
- 11.4. Market Analysis, Insights and Forecast - by End User
- 11.4.1. Commercial
- 11.4.2. Military & Government
- 11.4.3. Other
- 11.1. Market Analysis, Insights and Forecast - by Satellite Mass
- 12. Competitive Analysis
- 12.1. Company Profiles
- 12.1.1 GomSpaceApS
- 12.1.1.1. Company Overview
- 12.1.1.2. Products
- 12.1.1.3. Company Financials
- 12.1.1.4. SWOT Analysis
- 12.1.2 ESRI
- 12.1.2.1. Company Overview
- 12.1.2.2. Products
- 12.1.2.3. Company Financials
- 12.1.2.4. SWOT Analysis
- 12.1.3 Lockheed Martin Corporation
- 12.1.3.1. Company Overview
- 12.1.3.2. Products
- 12.1.3.3. Company Financials
- 12.1.3.4. SWOT Analysis
- 12.1.4 Airbus SE
- 12.1.4.1. Company Overview
- 12.1.4.2. Products
- 12.1.4.3. Company Financials
- 12.1.4.4. SWOT Analysis
- 12.1.5 Ball Corporation
- 12.1.5.1. Company Overview
- 12.1.5.2. Products
- 12.1.5.3. Company Financials
- 12.1.5.4. SWOT Analysis
- 12.1.6 Japan Aerospace Exploration Agency (JAXA)
- 12.1.6.1. Company Overview
- 12.1.6.2. Products
- 12.1.6.3. Company Financials
- 12.1.6.4. SWOT Analysis
- 12.1.7 China Aerospace Science and Technology Corporation (CASC)
- 12.1.7.1. Company Overview
- 12.1.7.2. Products
- 12.1.7.3. Company Financials
- 12.1.7.4. SWOT Analysis
- 12.1.8 Maxar Technologies Inc
- 12.1.8.1. Company Overview
- 12.1.8.2. Products
- 12.1.8.3. Company Financials
- 12.1.8.4. SWOT Analysis
- 12.1.9 ROSCOSMOS
- 12.1.9.1. Company Overview
- 12.1.9.2. Products
- 12.1.9.3. Company Financials
- 12.1.9.4. SWOT Analysis
- 12.1.10 Thale
- 12.1.10.1. Company Overview
- 12.1.10.2. Products
- 12.1.10.3. Company Financials
- 12.1.10.4. SWOT Analysis
- 12.1.11 Planet Labs Inc
- 12.1.11.1. Company Overview
- 12.1.11.2. Products
- 12.1.11.3. Company Financials
- 12.1.11.4. SWOT Analysis
- 12.1.12 Northrop Grumman Corporation
- 12.1.12.1. Company Overview
- 12.1.12.2. Products
- 12.1.12.3. Company Financials
- 12.1.12.4. SWOT Analysis
- 12.1.13 Indian Space Research Organisation (ISRO)
- 12.1.13.1. Company Overview
- 12.1.13.2. Products
- 12.1.13.3. Company Financials
- 12.1.13.4. SWOT Analysis
- 12.1.14 IHI Corporation
- 12.1.14.1. Company Overview
- 12.1.14.2. Products
- 12.1.14.3. Company Financials
- 12.1.14.4. SWOT Analysis
- 12.1.15 Spire Global Inc
- 12.1.15.1. Company Overview
- 12.1.15.2. Products
- 12.1.15.3. Company Financials
- 12.1.15.4. SWOT Analysis
- 12.1.1 GomSpaceApS
- 12.2. Market Entropy
- 12.2.1 Company's Key Areas Served
- 12.2.2 Recent Developments
- 12.3. Company Market Share Analysis 2025
- 12.3.1 Top 5 Companies Market Share Analysis
- 12.3.2 Top 3 Companies Market Share Analysis
- 12.4. List of Potential Customers
- 13. Research Methodology
List of Figures
- Figure 1: Global Remote Sensing Technology Market Revenue Breakdown (billion, %) by Region 2025 & 2033
- Figure 2: North America Remote Sensing Technology Market Revenue (billion), by Satellite Mass 2025 & 2033
- Figure 3: North America Remote Sensing Technology Market Revenue Share (%), by Satellite Mass 2025 & 2033
- Figure 4: North America Remote Sensing Technology Market Revenue (billion), by Orbit Class 2025 & 2033
- Figure 5: North America Remote Sensing Technology Market Revenue Share (%), by Orbit Class 2025 & 2033
- Figure 6: North America Remote Sensing Technology Market Revenue (billion), by Satellite Subsystem 2025 & 2033
- Figure 7: North America Remote Sensing Technology Market Revenue Share (%), by Satellite Subsystem 2025 & 2033
- Figure 8: North America Remote Sensing Technology Market Revenue (billion), by End User 2025 & 2033
- Figure 9: North America Remote Sensing Technology Market Revenue Share (%), by End User 2025 & 2033
- Figure 10: North America Remote Sensing Technology Market Revenue (billion), by Country 2025 & 2033
- Figure 11: North America Remote Sensing Technology Market Revenue Share (%), by Country 2025 & 2033
- Figure 12: South America Remote Sensing Technology Market Revenue (billion), by Satellite Mass 2025 & 2033
- Figure 13: South America Remote Sensing Technology Market Revenue Share (%), by Satellite Mass 2025 & 2033
- Figure 14: South America Remote Sensing Technology Market Revenue (billion), by Orbit Class 2025 & 2033
- Figure 15: South America Remote Sensing Technology Market Revenue Share (%), by Orbit Class 2025 & 2033
- Figure 16: South America Remote Sensing Technology Market Revenue (billion), by Satellite Subsystem 2025 & 2033
- Figure 17: South America Remote Sensing Technology Market Revenue Share (%), by Satellite Subsystem 2025 & 2033
- Figure 18: South America Remote Sensing Technology Market Revenue (billion), by End User 2025 & 2033
- Figure 19: South America Remote Sensing Technology Market Revenue Share (%), by End User 2025 & 2033
- Figure 20: South America Remote Sensing Technology Market Revenue (billion), by Country 2025 & 2033
- Figure 21: South America Remote Sensing Technology Market Revenue Share (%), by Country 2025 & 2033
- Figure 22: Europe Remote Sensing Technology Market Revenue (billion), by Satellite Mass 2025 & 2033
- Figure 23: Europe Remote Sensing Technology Market Revenue Share (%), by Satellite Mass 2025 & 2033
- Figure 24: Europe Remote Sensing Technology Market Revenue (billion), by Orbit Class 2025 & 2033
- Figure 25: Europe Remote Sensing Technology Market Revenue Share (%), by Orbit Class 2025 & 2033
- Figure 26: Europe Remote Sensing Technology Market Revenue (billion), by Satellite Subsystem 2025 & 2033
- Figure 27: Europe Remote Sensing Technology Market Revenue Share (%), by Satellite Subsystem 2025 & 2033
- Figure 28: Europe Remote Sensing Technology Market Revenue (billion), by End User 2025 & 2033
- Figure 29: Europe Remote Sensing Technology Market Revenue Share (%), by End User 2025 & 2033
- Figure 30: Europe Remote Sensing Technology Market Revenue (billion), by Country 2025 & 2033
- Figure 31: Europe Remote Sensing Technology Market Revenue Share (%), by Country 2025 & 2033
- Figure 32: Middle East & Africa Remote Sensing Technology Market Revenue (billion), by Satellite Mass 2025 & 2033
- Figure 33: Middle East & Africa Remote Sensing Technology Market Revenue Share (%), by Satellite Mass 2025 & 2033
- Figure 34: Middle East & Africa Remote Sensing Technology Market Revenue (billion), by Orbit Class 2025 & 2033
- Figure 35: Middle East & Africa Remote Sensing Technology Market Revenue Share (%), by Orbit Class 2025 & 2033
- Figure 36: Middle East & Africa Remote Sensing Technology Market Revenue (billion), by Satellite Subsystem 2025 & 2033
- Figure 37: Middle East & Africa Remote Sensing Technology Market Revenue Share (%), by Satellite Subsystem 2025 & 2033
- Figure 38: Middle East & Africa Remote Sensing Technology Market Revenue (billion), by End User 2025 & 2033
- Figure 39: Middle East & Africa Remote Sensing Technology Market Revenue Share (%), by End User 2025 & 2033
- Figure 40: Middle East & Africa Remote Sensing Technology Market Revenue (billion), by Country 2025 & 2033
- Figure 41: Middle East & Africa Remote Sensing Technology Market Revenue Share (%), by Country 2025 & 2033
- Figure 42: Asia Pacific Remote Sensing Technology Market Revenue (billion), by Satellite Mass 2025 & 2033
- Figure 43: Asia Pacific Remote Sensing Technology Market Revenue Share (%), by Satellite Mass 2025 & 2033
- Figure 44: Asia Pacific Remote Sensing Technology Market Revenue (billion), by Orbit Class 2025 & 2033
- Figure 45: Asia Pacific Remote Sensing Technology Market Revenue Share (%), by Orbit Class 2025 & 2033
- Figure 46: Asia Pacific Remote Sensing Technology Market Revenue (billion), by Satellite Subsystem 2025 & 2033
- Figure 47: Asia Pacific Remote Sensing Technology Market Revenue Share (%), by Satellite Subsystem 2025 & 2033
- Figure 48: Asia Pacific Remote Sensing Technology Market Revenue (billion), by End User 2025 & 2033
- Figure 49: Asia Pacific Remote Sensing Technology Market Revenue Share (%), by End User 2025 & 2033
- Figure 50: Asia Pacific Remote Sensing Technology Market Revenue (billion), by Country 2025 & 2033
- Figure 51: Asia Pacific Remote Sensing Technology Market Revenue Share (%), by Country 2025 & 2033
List of Tables
- Table 1: Global Remote Sensing Technology Market Revenue billion Forecast, by Satellite Mass 2020 & 2033
- Table 2: Global Remote Sensing Technology Market Revenue billion Forecast, by Orbit Class 2020 & 2033
- Table 3: Global Remote Sensing Technology Market Revenue billion Forecast, by Satellite Subsystem 2020 & 2033
- Table 4: Global Remote Sensing Technology Market Revenue billion Forecast, by End User 2020 & 2033
- Table 5: Global Remote Sensing Technology Market Revenue billion Forecast, by Region 2020 & 2033
- Table 6: Global Remote Sensing Technology Market Revenue billion Forecast, by Satellite Mass 2020 & 2033
- Table 7: Global Remote Sensing Technology Market Revenue billion Forecast, by Orbit Class 2020 & 2033
- Table 8: Global Remote Sensing Technology Market Revenue billion Forecast, by Satellite Subsystem 2020 & 2033
- Table 9: Global Remote Sensing Technology Market Revenue billion Forecast, by End User 2020 & 2033
- Table 10: Global Remote Sensing Technology Market Revenue billion Forecast, by Country 2020 & 2033
- Table 11: United States Remote Sensing Technology Market Revenue (billion) Forecast, by Application 2020 & 2033
- Table 12: Canada Remote Sensing Technology Market Revenue (billion) Forecast, by Application 2020 & 2033
- Table 13: Mexico Remote Sensing Technology Market Revenue (billion) Forecast, by Application 2020 & 2033
- Table 14: Global Remote Sensing Technology Market Revenue billion Forecast, by Satellite Mass 2020 & 2033
- Table 15: Global Remote Sensing Technology Market Revenue billion Forecast, by Orbit Class 2020 & 2033
- Table 16: Global Remote Sensing Technology Market Revenue billion Forecast, by Satellite Subsystem 2020 & 2033
- Table 17: Global Remote Sensing Technology Market Revenue billion Forecast, by End User 2020 & 2033
- Table 18: Global Remote Sensing Technology Market Revenue billion Forecast, by Country 2020 & 2033
- Table 19: Brazil Remote Sensing Technology Market Revenue (billion) Forecast, by Application 2020 & 2033
- Table 20: Argentina Remote Sensing Technology Market Revenue (billion) Forecast, by Application 2020 & 2033
- Table 21: Rest of South America Remote Sensing Technology Market Revenue (billion) Forecast, by Application 2020 & 2033
- Table 22: Global Remote Sensing Technology Market Revenue billion Forecast, by Satellite Mass 2020 & 2033
- Table 23: Global Remote Sensing Technology Market Revenue billion Forecast, by Orbit Class 2020 & 2033
- Table 24: Global Remote Sensing Technology Market Revenue billion Forecast, by Satellite Subsystem 2020 & 2033
- Table 25: Global Remote Sensing Technology Market Revenue billion Forecast, by End User 2020 & 2033
- Table 26: Global Remote Sensing Technology Market Revenue billion Forecast, by Country 2020 & 2033
- Table 27: United Kingdom Remote Sensing Technology Market Revenue (billion) Forecast, by Application 2020 & 2033
- Table 28: Germany Remote Sensing Technology Market Revenue (billion) Forecast, by Application 2020 & 2033
- Table 29: France Remote Sensing Technology Market Revenue (billion) Forecast, by Application 2020 & 2033
- Table 30: Italy Remote Sensing Technology Market Revenue (billion) Forecast, by Application 2020 & 2033
- Table 31: Spain Remote Sensing Technology Market Revenue (billion) Forecast, by Application 2020 & 2033
- Table 32: Russia Remote Sensing Technology Market Revenue (billion) Forecast, by Application 2020 & 2033
- Table 33: Benelux Remote Sensing Technology Market Revenue (billion) Forecast, by Application 2020 & 2033
- Table 34: Nordics Remote Sensing Technology Market Revenue (billion) Forecast, by Application 2020 & 2033
- Table 35: Rest of Europe Remote Sensing Technology Market Revenue (billion) Forecast, by Application 2020 & 2033
- Table 36: Global Remote Sensing Technology Market Revenue billion Forecast, by Satellite Mass 2020 & 2033
- Table 37: Global Remote Sensing Technology Market Revenue billion Forecast, by Orbit Class 2020 & 2033
- Table 38: Global Remote Sensing Technology Market Revenue billion Forecast, by Satellite Subsystem 2020 & 2033
- Table 39: Global Remote Sensing Technology Market Revenue billion Forecast, by End User 2020 & 2033
- Table 40: Global Remote Sensing Technology Market Revenue billion Forecast, by Country 2020 & 2033
- Table 41: Turkey Remote Sensing Technology Market Revenue (billion) Forecast, by Application 2020 & 2033
- Table 42: Israel Remote Sensing Technology Market Revenue (billion) Forecast, by Application 2020 & 2033
- Table 43: GCC Remote Sensing Technology Market Revenue (billion) Forecast, by Application 2020 & 2033
- Table 44: North Africa Remote Sensing Technology Market Revenue (billion) Forecast, by Application 2020 & 2033
- Table 45: South Africa Remote Sensing Technology Market Revenue (billion) Forecast, by Application 2020 & 2033
- Table 46: Rest of Middle East & Africa Remote Sensing Technology Market Revenue (billion) Forecast, by Application 2020 & 2033
- Table 47: Global Remote Sensing Technology Market Revenue billion Forecast, by Satellite Mass 2020 & 2033
- Table 48: Global Remote Sensing Technology Market Revenue billion Forecast, by Orbit Class 2020 & 2033
- Table 49: Global Remote Sensing Technology Market Revenue billion Forecast, by Satellite Subsystem 2020 & 2033
- Table 50: Global Remote Sensing Technology Market Revenue billion Forecast, by End User 2020 & 2033
- Table 51: Global Remote Sensing Technology Market Revenue billion Forecast, by Country 2020 & 2033
- Table 52: China Remote Sensing Technology Market Revenue (billion) Forecast, by Application 2020 & 2033
- Table 53: India Remote Sensing Technology Market Revenue (billion) Forecast, by Application 2020 & 2033
- Table 54: Japan Remote Sensing Technology Market Revenue (billion) Forecast, by Application 2020 & 2033
- Table 55: South Korea Remote Sensing Technology Market Revenue (billion) Forecast, by Application 2020 & 2033
- Table 56: ASEAN Remote Sensing Technology Market Revenue (billion) Forecast, by Application 2020 & 2033
- Table 57: Oceania Remote Sensing Technology Market Revenue (billion) Forecast, by Application 2020 & 2033
- Table 58: Rest of Asia Pacific Remote Sensing Technology Market Revenue (billion) Forecast, by Application 2020 & 2033
Frequently Asked Questions
1. What is the projected Compound Annual Growth Rate (CAGR) of the Remote Sensing Technology Market?
The projected CAGR is approximately 11.59%.
2. Which companies are prominent players in the Remote Sensing Technology Market?
Key companies in the market include GomSpaceApS, ESRI, Lockheed Martin Corporation, Airbus SE, Ball Corporation, Japan Aerospace Exploration Agency (JAXA), China Aerospace Science and Technology Corporation (CASC), Maxar Technologies Inc, ROSCOSMOS, Thale, Planet Labs Inc, Northrop Grumman Corporation, Indian Space Research Organisation (ISRO), IHI Corporation, Spire Global Inc.
3. What are the main segments of the Remote Sensing Technology Market?
The market segments include Satellite Mass, Orbit Class, Satellite Subsystem, End User.
4. Can you provide details about the market size?
The market size is estimated to be USD 25.37 billion as of 2022.
5. What are some drivers contributing to market growth?
N/A
6. What are the notable trends driving market growth?
OTHER KEY INDUSTRY TRENDS COVERED IN THE REPORT.
7. Are there any restraints impacting market growth?
N/A
8. Can you provide examples of recent developments in the market?
March 2023: The Japan Aerospace Exploration Agency (JAXA) had scheduled the launch of the first H3 Launch Vehicle with the Advanced Land Observing Satellite "Daichi 3" (ALOS-3) onboard from the Tanegashima Space Center.February 2023: NASA and geographic information service provider Esri will grant wider access to the space agency's geospatial content for research and exploration purposes through the Space Act Agreement.January 2023: Airbus Defence and Space has signed a contract with Poland to provide a geospatial intelligence system including the development, manufacture, launch and delivery in orbit of two high-performance optical Earth observation satellites.
9. What pricing options are available for accessing the report?
Pricing options include single-user, multi-user, and enterprise licenses priced at USD 3800, USD 4500, and USD 5800 respectively.
10. Is the market size provided in terms of value or volume?
The market size is provided in terms of value, measured in billion.
11. Are there any specific market keywords associated with the report?
Yes, the market keyword associated with the report is "Remote Sensing Technology Market," which aids in identifying and referencing the specific market segment covered.
12. How do I determine which pricing option suits my needs best?
The pricing options vary based on user requirements and access needs. Individual users may opt for single-user licenses, while businesses requiring broader access may choose multi-user or enterprise licenses for cost-effective access to the report.
13. Are there any additional resources or data provided in the Remote Sensing Technology Market report?
While the report offers comprehensive insights, it's advisable to review the specific contents or supplementary materials provided to ascertain if additional resources or data are available.
14. How can I stay updated on further developments or reports in the Remote Sensing Technology Market?
To stay informed about further developments, trends, and reports in the Remote Sensing Technology Market, consider subscribing to industry newsletters, following relevant companies and organizations, or regularly checking reputable industry news sources and publications.
Methodology
Step 1 - Identification of Relevant Samples Size from Population Database


Step 2 - Approaches for Defining Global Market Size (Value, Volume* & Price*)

Note*: In applicable scenarios
Step 3 - Data Sources
Primary Research
- Web Analytics
- Survey Reports
- Research Institute
- Latest Research Reports
- Opinion Leaders
Secondary Research
- Annual Reports
- White Paper
- Latest Press Release
- Industry Association
- Paid Database
- Investor Presentations

Step 4 - Data Triangulation
Involves using different sources of information in order to increase the validity of a study
These sources are likely to be stakeholders in a program - participants, other researchers, program staff, other community members, and so on.
Then we put all data in single framework & apply various statistical tools to find out the dynamic on the market.
During the analysis stage, feedback from the stakeholder groups would be compared to determine areas of agreement as well as areas of divergence