

Key Insights
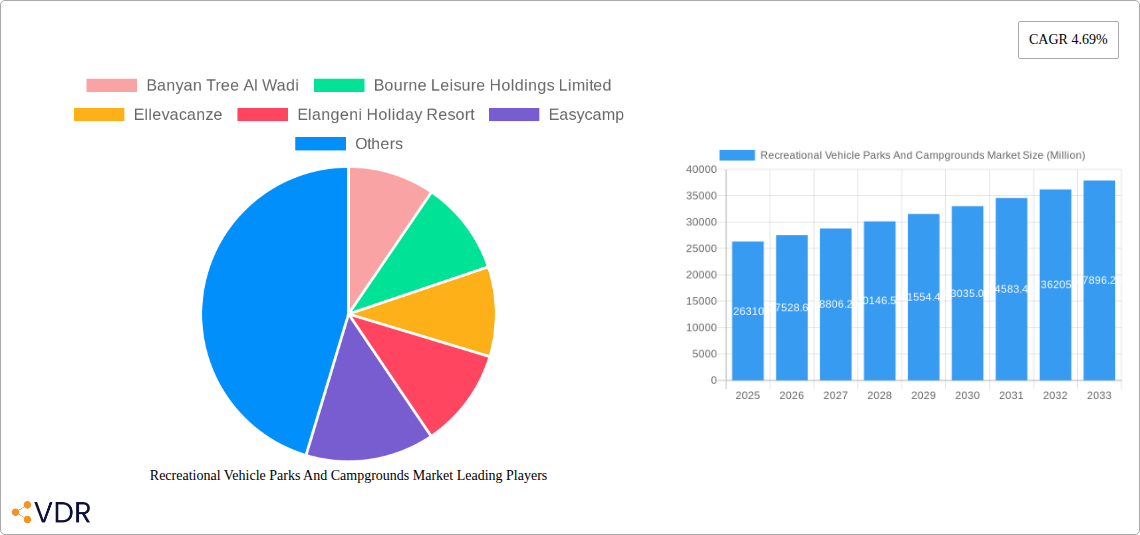
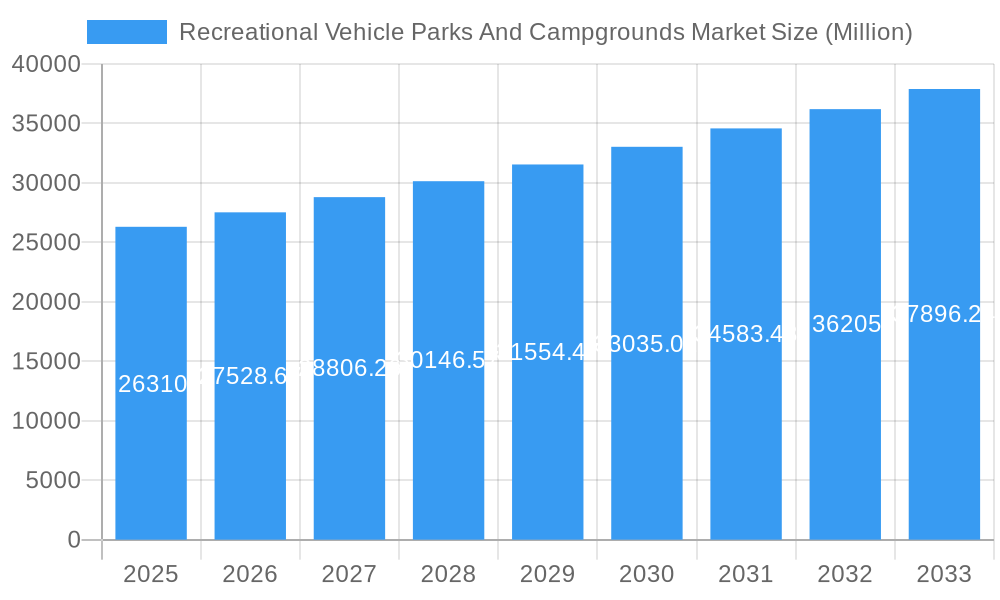
The Recreational Vehicle (RV) Parks and Campgrounds market is experiencing robust growth, projected to reach a market size of $26.31 billion in 2025, expanding at a Compound Annual Growth Rate (CAGR) of 4.69%. This growth is fueled by several key factors. Increased disposable income, particularly amongst millennials and Gen X, is driving demand for leisure activities, with RVing and camping offering an affordable and flexible vacation option. The rising popularity of outdoor recreation and "glamping" (glamorous camping) experiences further contributes to market expansion. Furthermore, continuous improvements in RV park amenities, including enhanced sanitation facilities, recreational activities, and internet access, are attracting a wider range of customers. The market is segmented by vehicle type (motorhomes and trailers), price point (standard and luxury), and end-use (individual and fleet owners). North America, particularly the United States, currently dominates the market due to established infrastructure and a large RV ownership base. However, emerging markets in Asia-Pacific and Europe show significant potential for growth as disposable incomes rise and tourism infrastructure develops. While the market faces challenges such as seasonal demand fluctuations and land scarcity, innovative business models, such as partnerships with outdoor retailers and the development of eco-friendly RV parks, are mitigating these restraints. The competitive landscape is diverse, encompassing both large publicly traded companies and smaller, privately-owned RV parks, creating a dynamic and evolving market.
Recreational Vehicle Parks And Campgrounds Market Market Size (In Billion)
The forecast period of 2025-2033 suggests continued expansion driven by several factors. The increasing popularity of sustainable and eco-friendly travel options aligns well with the RV and campground industry’s capacity to offer nature-based experiences. Advancements in technology, such as improved booking platforms and mobile applications, are enhancing customer experience and convenience. Additionally, the expanding senior population and their preference for outdoor recreation and affordable travel contribute to ongoing market growth. Strategic investments in infrastructure improvements and amenity enhancements will be crucial for park operators to attract and retain customers, ensuring that the RV parks and campgrounds sector continues its upward trajectory. Regional variations in growth will depend on economic conditions, tourism trends, and government regulations supporting the industry.
Recreational Vehicle Parks And Campgrounds Market Company Market Share
Recreational Vehicle Parks And Campgrounds Market: A Comprehensive Report (2019-2033)
This in-depth report provides a comprehensive analysis of the Recreational Vehicle (RV) Parks and Campgrounds market, encompassing market dynamics, growth trends, regional analysis, product landscape, key players, and future outlook. The study covers the period 2019-2033, with a focus on the forecast period 2025-2033 and base year 2025. The report delves into the parent market of tourism and hospitality and the child market of outdoor recreation, providing a holistic understanding of this dynamic sector. Market values are presented in million units.
Recreational Vehicle Parks And Campgrounds Market Market Dynamics & Structure
This section analyzes the competitive landscape of the RV Parks and Campgrounds market, examining market concentration, technological advancements, regulatory influences, substitute products, end-user demographics, and mergers & acquisitions (M&A) activity.
The market exhibits a moderately fragmented structure, with several large players and a multitude of smaller, regional operators. Market share is approximately distributed as follows: Large players (Equity Lifestyle Properties, Discovery Parks, etc.): xx%, Mid-size players: xx%, Small players: xx%.
- Technological Innovation: The industry is witnessing a rise in smart technologies integrated into RV parks, including online booking systems, smart energy management, and enhanced security features. However, the initial investment costs and integration complexities present significant barriers to widespread adoption.
- Regulatory Frameworks: Zoning regulations, environmental permits, and safety standards vary significantly across different regions, impacting operational costs and market expansion. Compliance costs represent an estimated xx million annually.
- Competitive Product Substitutes: Alternative accommodations like hotels, vacation rentals, and glamping options pose competitive pressure, particularly in densely populated areas. The substitution rate is estimated at xx% annually.
- End-User Demographics: The primary end-users are individuals seeking leisure activities and fleet owners providing rental services. The individual segment accounts for approximately xx% of the market.
- M&A Trends: The past five years have witnessed xx M&A deals, primarily focused on consolidating regional operators and expanding geographical reach. The total value of these deals is estimated at xx million.
Recreational Vehicle Parks And Campgrounds Market Growth Trends & Insights
The Recreational Vehicle (RV) Parks and Campgrounds market is experiencing a dynamic period of expansion, driven by a confluence of factors that are reshaping how people engage with outdoor leisure. This section delves into the evolving market size, the increasing adoption of RV travel and camping, the impact of technological advancements, and the discernible shifts in consumer behavior.
The market has witnessed robust growth, expanding from an estimated [Insert Specific Market Size from 2019 Here] million in 2019 to an estimated [Insert Specific Market Size from 2024 Here] million in 2024, demonstrating a Compound Annual Growth Rate (CAGR) of approximately [Insert Specific CAGR from 2019-2024 Here]%. This upward trajectory is largely attributable to a combination of rising disposable incomes, a pronounced resurgence in outdoor recreational pursuits, and the burgeoning appeal of the RV lifestyle as a flexible and enriching travel option. Factors contributing to increased adoption rates include significant improvements in RV design and functionality, the emergence of high-end and amenity-rich RV parks, and a broader accessibility to diverse outdoor environments. Technological innovations, such as sophisticated online booking systems, enhanced site amenities, and the integration of energy-efficient features, are further accelerating consumer uptake. Moreover, a prevailing trend towards experiential travel and a growing emphasis on sustainable tourism practices are acting as significant catalysts for sustained market expansion.
Looking ahead, the market is projected to reach an estimated [Insert Specific Market Size by 2033 Here] million by 2033, with an anticipated CAGR of approximately [Insert Specific CAGR for Forecast Period Here]% during the forecast period. Market penetration is expected to climb from an estimated [Insert Specific Market Penetration from 2024 Here]% in 2024 to an impressive [Insert Specific Market Penetration by 2033 Here]% by 2033, indicating a significant increase in the proportion of the population embracing RVing and campground stays.
Dominant Regions, Countries, or Segments in Recreational Vehicle Parks And Campgrounds Market
North America currently dominates the RV Parks and Campgrounds market, followed by Europe and Asia-Pacific. Within North America, the United States holds the largest market share due to high RV ownership rates and extensive infrastructure.
By Vehicle Type:
- Motorhomes: This segment holds the largest share, driven by increased consumer preference for greater flexibility and comfort.
- Trailers: The trailer segment is experiencing steady growth, particularly among budget-conscious travelers.
By Price:
- Luxury: The luxury segment shows significant growth potential, fueled by rising disposable incomes and increasing demand for premium amenities and services.
- Standard: The standard segment remains the largest in terms of volume, catering to a wider consumer base.
By End-Use:
- Individual: This segment accounts for the majority of the market.
- Fleet Owners: The fleet ownership segment represents a notable market segment with opportunities for growth.
Key Drivers:
- Increased Disposable Incomes: Rising income levels are driving increased spending on leisure and recreational activities.
- Government Initiatives: Investments in infrastructure development and tourism promotion contribute positively.
Recreational Vehicle Parks And Campgrounds Market Product Landscape
The RV Parks and Campgrounds market offers a diverse range of products and services, including basic campsites, fully serviced RV sites, cabins, glamping accommodations, and various amenities like swimming pools, recreational facilities, and restaurants. Technological advancements include smart reservation systems, improved waste disposal systems, and better energy efficiency within the parks themselves. The most successful parks offer unique selling propositions such as stunning locations, personalized service, and eco-friendly practices.
Key Drivers, Barriers & Challenges in Recreational Vehicle Parks And Campgrounds Market
Key Drivers:
- Growing popularity of outdoor recreation and adventure tourism.
- Increasing disposable incomes and vacation time.
- Development of new and improved RV technologies and amenities.
Key Challenges & Restraints:
- Land scarcity and rising land prices in desirable locations.
- Environmental regulations and sustainability concerns.
- Intense competition from alternative accommodation options.
- Seasonal demand fluctuations, impacting profitability.
Emerging Opportunities in Recreational Vehicle Parks And Campgrounds Market
- Glamping and Luxury RV Parks: The demand for elevated camping experiences, often termed "glamping," and the development of luxury RV parks with premium amenities are creating substantial growth avenues. These offerings cater to a segment of travelers seeking comfort and convenience without sacrificing the connection to nature.
- Sustainable and Eco-Friendly RV Parks: With a growing global consciousness around environmental impact, RV parks that adopt and promote sustainable practices, such as renewable energy sources, waste reduction programs, and preservation of natural landscapes, are attracting a dedicated and expanding customer base.
- Technological Integration for Enhanced Experiences: The seamless integration of smart technologies presents a significant opportunity to revolutionize the customer journey. This includes advanced reservation and check-in systems, personalized amenity recommendations, smart site management for utilities, and digital concierge services that improve operational efficiency and elevate the guest experience.
- Niche and Themed Campgrounds: Opportunities exist in developing specialized campgrounds catering to specific interests, such as adventure sports, pet-friendly resorts, historical reenactment sites, or locations focused on stargazing and astronomy.
- Partnerships and Alliances: Collaborations between RV manufacturers, campground operators, travel agencies, and technology providers can unlock new markets and enhance the overall offering for consumers.
Growth Accelerators in the Recreational Vehicle Parks And Campgrounds Market Industry
Technological breakthroughs in RV manufacturing and park management, strategic partnerships between RV manufacturers and park operators, and expansion into new geographic markets are key growth accelerators. Developing integrated platforms streamlining booking and management while expanding into underserved markets will also accelerate growth.
Key Players Shaping the Recreational Vehicle Parks And Campgrounds Market Market
- Equity Lifestyle Properties
- Bourne Leisure Holdings Limited
- Discovery Parks Private Limited
- Sun Communities
- Kampgrounds of America (KOA)
- Outdoor Adventures
- Thousand Trails
- Sun RV Resorts
- Campgrounds & Lodging
- Banyan Tree Al Wadi
- Ellevacanze
- Elangeni Holiday Resort
- Easycamp
- Camping Pod Lasem
- Camping Flamboyant
- Alaskan Anglers RV Park
- Thor Industries
- Forest River, Inc.
- Winnebago Industries
- Jayco, Inc.
Notable Milestones in Recreational Vehicle Parks And Campgrounds Market Sector
- December 2022: Alaskan Anglers RV Park proudly inaugurated its expansive, full-service RV park in Ninilchik, Alaska, significantly boosting the region's capacity for RV tourism.
- January 2022: Ford and Erwin Hymer Group (EHG) formalized a strategic framework agreement, paving the way for the streamlined delivery of customer-ready motorhomes and recreational vehicles built on Ford chassis, enhancing vehicle availability and innovation.
- October 2023: The launch of the "CampClean" initiative by a consortium of leading campground associations, promoting enhanced hygiene and safety protocols across North American campgrounds, fostering traveler confidence.
- March 2023: Equity Lifestyle Properties announced a significant acquisition of 15 RV resorts, expanding its footprint in key leisure destinations and strengthening its market position.
- August 2023: The introduction of a new mobile app by a major campground operator, offering integrated booking, contactless check-in, and localized activity recommendations, revolutionizing the guest experience.
In-Depth Recreational Vehicle Parks And Campgrounds Market Market Outlook
The RV Parks and Campgrounds market is poised for sustained and robust growth, propelled by a dynamic interplay of evolving consumer preferences, continuous technological innovation, and strategic infrastructure development. Success in this evolving landscape will be intricately linked to strategic investments in sustainable operational practices, the provision of premium and unique amenities, and the proactive adoption of digital technologies. A paramount focus on elevating the customer experience through personalized services, establishing distinctive selling propositions that resonate with target demographics, and leveraging sophisticated data analytics for precision-driven marketing campaigns will be instrumental in shaping future market leadership and ensuring long-term competitive advantage.
Recreational Vehicle Parks And Campgrounds Market Segmentation
-
1. Vehicle Type
-
1.1. Motorhomes
- 1.1.1. Class A
- 1.1.2. Class B
- 1.1.3. Class C
- 1.1.4. Rockstar Motorhomes
-
1.2. Trailers
- 1.2.1. 5th Wheel Trailers
- 1.2.2. Travel Trailers
- 1.2.3. Tent Trailer
- 1.2.4. Retro Trailer
-
1.1. Motorhomes
-
2. Price
- 2.1. Standard
- 2.2. Luxury
-
3. End-Use
- 3.1. Individual
- 3.2. Fleet Owners
Recreational Vehicle Parks And Campgrounds Market Segmentation By Geography
- 1. North America
- 2. Europe
- 3. Asia Pacific
- 4. Latin America
- 5. Middle East
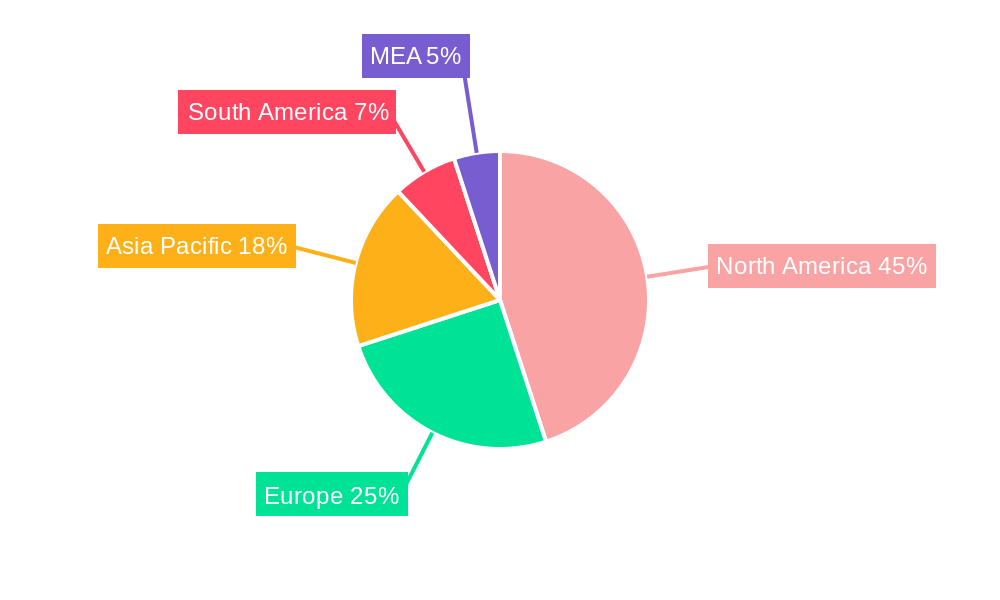
Recreational Vehicle Parks And Campgrounds Market Regional Market Share
Geographic Coverage of Recreational Vehicle Parks And Campgrounds Market
Recreational Vehicle Parks And Campgrounds Market REPORT HIGHLIGHTS
| Aspects | Details |
|---|---|
| Study Period | 2020-2034 |
| Base Year | 2025 |
| Estimated Year | 2026 |
| Forecast Period | 2026-2034 |
| Historical Period | 2020-2025 |
| Growth Rate | CAGR of 4.69% from 2020-2034 |
| Segmentation |
|
Table of Contents
- 1. Introduction
- 1.1. Research Scope
- 1.2. Market Segmentation
- 1.3. Research Objective
- 1.4. Definitions and Assumptions
- 2. Executive Summary
- 2.1. Market Snapshot
- 3. Market Dynamics
- 3.1. Market Drivers
- 3.2. Market Restrains
- 3.3. Market Trends
- 3.4. Market Opportunities
- 4. Market Factor Analysis
- 4.1. Porters Five Forces
- 4.1.1. Bargaining Power of Suppliers
- 4.1.2. Bargaining Power of Buyers
- 4.1.3. Threat of New Entrants
- 4.1.4. Threat of Substitutes
- 4.1.5. Competitive Rivalry
- 4.2. PESTEL analysis
- 4.3. BCG Analysis
- 4.3.1. Stars (High Growth, High Market Share)
- 4.3.2. Cash Cows (Low Growth, High Market Share)
- 4.3.3. Question Mark (High Growth, Low Market Share)
- 4.3.4. Dogs (Low Growth, Low Market Share)
- 4.4. Ansoff Matrix Analysis
- 4.5. Supply Chain Analysis
- 4.6. Regulatory Landscape
- 4.7. Current Market Potential and Opportunity Assessment (TAM–SAM–SOM Framework)
- 4.8. VDR Analyst Note
- 4.1. Porters Five Forces
- 5. Market Analysis, Insights and Forecast 2021-2033
- 5.1. Market Analysis, Insights and Forecast - by Vehicle Type
- 5.1.1. Motorhomes
- 5.1.1.1. Class A
- 5.1.1.2. Class B
- 5.1.1.3. Class C
- 5.1.1.4. Rockstar Motorhomes
- 5.1.2. Trailers
- 5.1.2.1. 5th Wheel Trailers
- 5.1.2.2. Travel Trailers
- 5.1.2.3. Tent Trailer
- 5.1.2.4. Retro Trailer
- 5.1.1. Motorhomes
- 5.2. Market Analysis, Insights and Forecast - by Price
- 5.2.1. Standard
- 5.2.2. Luxury
- 5.3. Market Analysis, Insights and Forecast - by End-Use
- 5.3.1. Individual
- 5.3.2. Fleet Owners
- 5.4. Market Analysis, Insights and Forecast - by Region
- 5.4.1. North America
- 5.4.2. Europe
- 5.4.3. Asia Pacific
- 5.4.4. Latin America
- 5.4.5. Middle East
- 5.1. Market Analysis, Insights and Forecast - by Vehicle Type
- 6. Global Recreational Vehicle Parks And Campgrounds Market Analysis, Insights and Forecast, 2021-2033
- 6.1. Market Analysis, Insights and Forecast - by Vehicle Type
- 6.1.1. Motorhomes
- 6.1.1.1. Class A
- 6.1.1.2. Class B
- 6.1.1.3. Class C
- 6.1.1.4. Rockstar Motorhomes
- 6.1.2. Trailers
- 6.1.2.1. 5th Wheel Trailers
- 6.1.2.2. Travel Trailers
- 6.1.2.3. Tent Trailer
- 6.1.2.4. Retro Trailer
- 6.1.1. Motorhomes
- 6.2. Market Analysis, Insights and Forecast - by Price
- 6.2.1. Standard
- 6.2.2. Luxury
- 6.3. Market Analysis, Insights and Forecast - by End-Use
- 6.3.1. Individual
- 6.3.2. Fleet Owners
- 6.1. Market Analysis, Insights and Forecast - by Vehicle Type
- 7. North America Recreational Vehicle Parks And Campgrounds Market Analysis, Insights and Forecast, 2021-2033
- 7.1. Market Analysis, Insights and Forecast - by Vehicle Type
- 7.1.1. Motorhomes
- 7.1.1.1. Class A
- 7.1.1.2. Class B
- 7.1.1.3. Class C
- 7.1.1.4. Rockstar Motorhomes
- 7.1.2. Trailers
- 7.1.2.1. 5th Wheel Trailers
- 7.1.2.2. Travel Trailers
- 7.1.2.3. Tent Trailer
- 7.1.2.4. Retro Trailer
- 7.1.1. Motorhomes
- 7.2. Market Analysis, Insights and Forecast - by Price
- 7.2.1. Standard
- 7.2.2. Luxury
- 7.3. Market Analysis, Insights and Forecast - by End-Use
- 7.3.1. Individual
- 7.3.2. Fleet Owners
- 7.1. Market Analysis, Insights and Forecast - by Vehicle Type
- 8. Europe Recreational Vehicle Parks And Campgrounds Market Analysis, Insights and Forecast, 2021-2033
- 8.1. Market Analysis, Insights and Forecast - by Vehicle Type
- 8.1.1. Motorhomes
- 8.1.1.1. Class A
- 8.1.1.2. Class B
- 8.1.1.3. Class C
- 8.1.1.4. Rockstar Motorhomes
- 8.1.2. Trailers
- 8.1.2.1. 5th Wheel Trailers
- 8.1.2.2. Travel Trailers
- 8.1.2.3. Tent Trailer
- 8.1.2.4. Retro Trailer
- 8.1.1. Motorhomes
- 8.2. Market Analysis, Insights and Forecast - by Price
- 8.2.1. Standard
- 8.2.2. Luxury
- 8.3. Market Analysis, Insights and Forecast - by End-Use
- 8.3.1. Individual
- 8.3.2. Fleet Owners
- 8.1. Market Analysis, Insights and Forecast - by Vehicle Type
- 9. Asia Pacific Recreational Vehicle Parks And Campgrounds Market Analysis, Insights and Forecast, 2021-2033
- 9.1. Market Analysis, Insights and Forecast - by Vehicle Type
- 9.1.1. Motorhomes
- 9.1.1.1. Class A
- 9.1.1.2. Class B
- 9.1.1.3. Class C
- 9.1.1.4. Rockstar Motorhomes
- 9.1.2. Trailers
- 9.1.2.1. 5th Wheel Trailers
- 9.1.2.2. Travel Trailers
- 9.1.2.3. Tent Trailer
- 9.1.2.4. Retro Trailer
- 9.1.1. Motorhomes
- 9.2. Market Analysis, Insights and Forecast - by Price
- 9.2.1. Standard
- 9.2.2. Luxury
- 9.3. Market Analysis, Insights and Forecast - by End-Use
- 9.3.1. Individual
- 9.3.2. Fleet Owners
- 9.1. Market Analysis, Insights and Forecast - by Vehicle Type
- 10. Latin America Recreational Vehicle Parks And Campgrounds Market Analysis, Insights and Forecast, 2021-2033
- 10.1. Market Analysis, Insights and Forecast - by Vehicle Type
- 10.1.1. Motorhomes
- 10.1.1.1. Class A
- 10.1.1.2. Class B
- 10.1.1.3. Class C
- 10.1.1.4. Rockstar Motorhomes
- 10.1.2. Trailers
- 10.1.2.1. 5th Wheel Trailers
- 10.1.2.2. Travel Trailers
- 10.1.2.3. Tent Trailer
- 10.1.2.4. Retro Trailer
- 10.1.1. Motorhomes
- 10.2. Market Analysis, Insights and Forecast - by Price
- 10.2.1. Standard
- 10.2.2. Luxury
- 10.3. Market Analysis, Insights and Forecast - by End-Use
- 10.3.1. Individual
- 10.3.2. Fleet Owners
- 10.1. Market Analysis, Insights and Forecast - by Vehicle Type
- 11. Middle East Recreational Vehicle Parks And Campgrounds Market Analysis, Insights and Forecast, 2021-2033
- 11.1. Market Analysis, Insights and Forecast - by Vehicle Type
- 11.1.1. Motorhomes
- 11.1.1.1. Class A
- 11.1.1.2. Class B
- 11.1.1.3. Class C
- 11.1.1.4. Rockstar Motorhomes
- 11.1.2. Trailers
- 11.1.2.1. 5th Wheel Trailers
- 11.1.2.2. Travel Trailers
- 11.1.2.3. Tent Trailer
- 11.1.2.4. Retro Trailer
- 11.1.1. Motorhomes
- 11.2. Market Analysis, Insights and Forecast - by Price
- 11.2.1. Standard
- 11.2.2. Luxury
- 11.3. Market Analysis, Insights and Forecast - by End-Use
- 11.3.1. Individual
- 11.3.2. Fleet Owners
- 11.1. Market Analysis, Insights and Forecast - by Vehicle Type
- 12. Competitive Analysis
- 12.1. Company Profiles
- 12.1.1 Banyan Tree Al Wadi
- 12.1.1.1. Company Overview
- 12.1.1.2. Products
- 12.1.1.3. Company Financials
- 12.1.1.4. SWOT Analysis
- 12.1.2 Bourne Leisure Holdings Limited
- 12.1.2.1. Company Overview
- 12.1.2.2. Products
- 12.1.2.3. Company Financials
- 12.1.2.4. SWOT Analysis
- 12.1.3 Ellevacanze
- 12.1.3.1. Company Overview
- 12.1.3.2. Products
- 12.1.3.3. Company Financials
- 12.1.3.4. SWOT Analysis
- 12.1.4 Elangeni Holiday Resort
- 12.1.4.1. Company Overview
- 12.1.4.2. Products
- 12.1.4.3. Company Financials
- 12.1.4.4. SWOT Analysis
- 12.1.5 Easycamp
- 12.1.5.1. Company Overview
- 12.1.5.2. Products
- 12.1.5.3. Company Financials
- 12.1.5.4. SWOT Analysis
- 12.1.6 Camping Pod Lasem
- 12.1.6.1. Company Overview
- 12.1.6.2. Products
- 12.1.6.3. Company Financials
- 12.1.6.4. SWOT Analysis
- 12.1.7 Equity Lifestyle Properties**List Not Exhaustive
- 12.1.7.1. Company Overview
- 12.1.7.2. Products
- 12.1.7.3. Company Financials
- 12.1.7.4. SWOT Analysis
- 12.1.8 Camping Flamboyant
- 12.1.8.1. Company Overview
- 12.1.8.2. Products
- 12.1.8.3. Company Financials
- 12.1.8.4. SWOT Analysis
- 12.1.9 Discovery Parks Private Limited
- 12.1.9.1. Company Overview
- 12.1.9.2. Products
- 12.1.9.3. Company Financials
- 12.1.9.4. SWOT Analysis
- 12.1.10 Alaskan Anglers RV Park
- 12.1.10.1. Company Overview
- 12.1.10.2. Products
- 12.1.10.3. Company Financials
- 12.1.10.4. SWOT Analysis
- 12.1.1 Banyan Tree Al Wadi
- 12.2. Market Entropy
- 12.2.1 Company's Key Areas Served
- 12.2.2 Recent Developments
- 12.3. Company Market Share Analysis 2025
- 12.3.1 Top 5 Companies Market Share Analysis
- 12.3.2 Top 3 Companies Market Share Analysis
- 12.4. List of Potential Customers
- 13. Research Methodology
List of Figures
- Figure 1: Global Recreational Vehicle Parks And Campgrounds Market Revenue Breakdown (Million, %) by Region 2025 & 2033
- Figure 2: North America Recreational Vehicle Parks And Campgrounds Market Revenue (Million), by Vehicle Type 2025 & 2033
- Figure 3: North America Recreational Vehicle Parks And Campgrounds Market Revenue Share (%), by Vehicle Type 2025 & 2033
- Figure 4: North America Recreational Vehicle Parks And Campgrounds Market Revenue (Million), by Price 2025 & 2033
- Figure 5: North America Recreational Vehicle Parks And Campgrounds Market Revenue Share (%), by Price 2025 & 2033
- Figure 6: North America Recreational Vehicle Parks And Campgrounds Market Revenue (Million), by End-Use 2025 & 2033
- Figure 7: North America Recreational Vehicle Parks And Campgrounds Market Revenue Share (%), by End-Use 2025 & 2033
- Figure 8: North America Recreational Vehicle Parks And Campgrounds Market Revenue (Million), by Country 2025 & 2033
- Figure 9: North America Recreational Vehicle Parks And Campgrounds Market Revenue Share (%), by Country 2025 & 2033
- Figure 10: Europe Recreational Vehicle Parks And Campgrounds Market Revenue (Million), by Vehicle Type 2025 & 2033
- Figure 11: Europe Recreational Vehicle Parks And Campgrounds Market Revenue Share (%), by Vehicle Type 2025 & 2033
- Figure 12: Europe Recreational Vehicle Parks And Campgrounds Market Revenue (Million), by Price 2025 & 2033
- Figure 13: Europe Recreational Vehicle Parks And Campgrounds Market Revenue Share (%), by Price 2025 & 2033
- Figure 14: Europe Recreational Vehicle Parks And Campgrounds Market Revenue (Million), by End-Use 2025 & 2033
- Figure 15: Europe Recreational Vehicle Parks And Campgrounds Market Revenue Share (%), by End-Use 2025 & 2033
- Figure 16: Europe Recreational Vehicle Parks And Campgrounds Market Revenue (Million), by Country 2025 & 2033
- Figure 17: Europe Recreational Vehicle Parks And Campgrounds Market Revenue Share (%), by Country 2025 & 2033
- Figure 18: Asia Pacific Recreational Vehicle Parks And Campgrounds Market Revenue (Million), by Vehicle Type 2025 & 2033
- Figure 19: Asia Pacific Recreational Vehicle Parks And Campgrounds Market Revenue Share (%), by Vehicle Type 2025 & 2033
- Figure 20: Asia Pacific Recreational Vehicle Parks And Campgrounds Market Revenue (Million), by Price 2025 & 2033
- Figure 21: Asia Pacific Recreational Vehicle Parks And Campgrounds Market Revenue Share (%), by Price 2025 & 2033
- Figure 22: Asia Pacific Recreational Vehicle Parks And Campgrounds Market Revenue (Million), by End-Use 2025 & 2033
- Figure 23: Asia Pacific Recreational Vehicle Parks And Campgrounds Market Revenue Share (%), by End-Use 2025 & 2033
- Figure 24: Asia Pacific Recreational Vehicle Parks And Campgrounds Market Revenue (Million), by Country 2025 & 2033
- Figure 25: Asia Pacific Recreational Vehicle Parks And Campgrounds Market Revenue Share (%), by Country 2025 & 2033
- Figure 26: Latin America Recreational Vehicle Parks And Campgrounds Market Revenue (Million), by Vehicle Type 2025 & 2033
- Figure 27: Latin America Recreational Vehicle Parks And Campgrounds Market Revenue Share (%), by Vehicle Type 2025 & 2033
- Figure 28: Latin America Recreational Vehicle Parks And Campgrounds Market Revenue (Million), by Price 2025 & 2033
- Figure 29: Latin America Recreational Vehicle Parks And Campgrounds Market Revenue Share (%), by Price 2025 & 2033
- Figure 30: Latin America Recreational Vehicle Parks And Campgrounds Market Revenue (Million), by End-Use 2025 & 2033
- Figure 31: Latin America Recreational Vehicle Parks And Campgrounds Market Revenue Share (%), by End-Use 2025 & 2033
- Figure 32: Latin America Recreational Vehicle Parks And Campgrounds Market Revenue (Million), by Country 2025 & 2033
- Figure 33: Latin America Recreational Vehicle Parks And Campgrounds Market Revenue Share (%), by Country 2025 & 2033
- Figure 34: Middle East Recreational Vehicle Parks And Campgrounds Market Revenue (Million), by Vehicle Type 2025 & 2033
- Figure 35: Middle East Recreational Vehicle Parks And Campgrounds Market Revenue Share (%), by Vehicle Type 2025 & 2033
- Figure 36: Middle East Recreational Vehicle Parks And Campgrounds Market Revenue (Million), by Price 2025 & 2033
- Figure 37: Middle East Recreational Vehicle Parks And Campgrounds Market Revenue Share (%), by Price 2025 & 2033
- Figure 38: Middle East Recreational Vehicle Parks And Campgrounds Market Revenue (Million), by End-Use 2025 & 2033
- Figure 39: Middle East Recreational Vehicle Parks And Campgrounds Market Revenue Share (%), by End-Use 2025 & 2033
- Figure 40: Middle East Recreational Vehicle Parks And Campgrounds Market Revenue (Million), by Country 2025 & 2033
- Figure 41: Middle East Recreational Vehicle Parks And Campgrounds Market Revenue Share (%), by Country 2025 & 2033
List of Tables
- Table 1: Global Recreational Vehicle Parks And Campgrounds Market Revenue Million Forecast, by Vehicle Type 2020 & 2033
- Table 2: Global Recreational Vehicle Parks And Campgrounds Market Revenue Million Forecast, by Price 2020 & 2033
- Table 3: Global Recreational Vehicle Parks And Campgrounds Market Revenue Million Forecast, by End-Use 2020 & 2033
- Table 4: Global Recreational Vehicle Parks And Campgrounds Market Revenue Million Forecast, by Region 2020 & 2033
- Table 5: Global Recreational Vehicle Parks And Campgrounds Market Revenue Million Forecast, by Vehicle Type 2020 & 2033
- Table 6: Global Recreational Vehicle Parks And Campgrounds Market Revenue Million Forecast, by Price 2020 & 2033
- Table 7: Global Recreational Vehicle Parks And Campgrounds Market Revenue Million Forecast, by End-Use 2020 & 2033
- Table 8: Global Recreational Vehicle Parks And Campgrounds Market Revenue Million Forecast, by Country 2020 & 2033
- Table 9: Global Recreational Vehicle Parks And Campgrounds Market Revenue Million Forecast, by Vehicle Type 2020 & 2033
- Table 10: Global Recreational Vehicle Parks And Campgrounds Market Revenue Million Forecast, by Price 2020 & 2033
- Table 11: Global Recreational Vehicle Parks And Campgrounds Market Revenue Million Forecast, by End-Use 2020 & 2033
- Table 12: Global Recreational Vehicle Parks And Campgrounds Market Revenue Million Forecast, by Country 2020 & 2033
- Table 13: Global Recreational Vehicle Parks And Campgrounds Market Revenue Million Forecast, by Vehicle Type 2020 & 2033
- Table 14: Global Recreational Vehicle Parks And Campgrounds Market Revenue Million Forecast, by Price 2020 & 2033
- Table 15: Global Recreational Vehicle Parks And Campgrounds Market Revenue Million Forecast, by End-Use 2020 & 2033
- Table 16: Global Recreational Vehicle Parks And Campgrounds Market Revenue Million Forecast, by Country 2020 & 2033
- Table 17: Global Recreational Vehicle Parks And Campgrounds Market Revenue Million Forecast, by Vehicle Type 2020 & 2033
- Table 18: Global Recreational Vehicle Parks And Campgrounds Market Revenue Million Forecast, by Price 2020 & 2033
- Table 19: Global Recreational Vehicle Parks And Campgrounds Market Revenue Million Forecast, by End-Use 2020 & 2033
- Table 20: Global Recreational Vehicle Parks And Campgrounds Market Revenue Million Forecast, by Country 2020 & 2033
- Table 21: Global Recreational Vehicle Parks And Campgrounds Market Revenue Million Forecast, by Vehicle Type 2020 & 2033
- Table 22: Global Recreational Vehicle Parks And Campgrounds Market Revenue Million Forecast, by Price 2020 & 2033
- Table 23: Global Recreational Vehicle Parks And Campgrounds Market Revenue Million Forecast, by End-Use 2020 & 2033
- Table 24: Global Recreational Vehicle Parks And Campgrounds Market Revenue Million Forecast, by Country 2020 & 2033
Frequently Asked Questions
1. What is the projected Compound Annual Growth Rate (CAGR) of the Recreational Vehicle Parks And Campgrounds Market?
The projected CAGR is approximately 4.69%.
2. Which companies are prominent players in the Recreational Vehicle Parks And Campgrounds Market?
Key companies in the market include Banyan Tree Al Wadi, Bourne Leisure Holdings Limited, Ellevacanze, Elangeni Holiday Resort, Easycamp, Camping Pod Lasem, Equity Lifestyle Properties**List Not Exhaustive, Camping Flamboyant, Discovery Parks Private Limited, Alaskan Anglers RV Park.
3. What are the main segments of the Recreational Vehicle Parks And Campgrounds Market?
The market segments include Vehicle Type, Price, End-Use.
4. Can you provide details about the market size?
The market size is estimated to be USD 26.31 Million as of 2022.
5. What are some drivers contributing to market growth?
Increase in the Number of Restaurants and Bars in the Industry; Increase in the Number of Tourist Attractions and Activities.
6. What are the notable trends driving market growth?
Operating Overnight Recreational Camps Segment Booming the Market.
7. Are there any restraints impacting market growth?
Inadequate Research and Development. Unpredictability of the Market.
8. Can you provide examples of recent developments in the market?
December 2022: The company unveiled the largest full-service RV park in Ninilchik, Alaskan Angler. Spacious, flat sites with helpful staff and all the necessary support services are nearby rivers and beaches.,
9. What pricing options are available for accessing the report?
Pricing options include single-user, multi-user, and enterprise licenses priced at USD 4750, USD 5250, and USD 8750 respectively.
10. Is the market size provided in terms of value or volume?
The market size is provided in terms of value, measured in Million.
11. Are there any specific market keywords associated with the report?
Yes, the market keyword associated with the report is "Recreational Vehicle Parks And Campgrounds Market," which aids in identifying and referencing the specific market segment covered.
12. How do I determine which pricing option suits my needs best?
The pricing options vary based on user requirements and access needs. Individual users may opt for single-user licenses, while businesses requiring broader access may choose multi-user or enterprise licenses for cost-effective access to the report.
13. Are there any additional resources or data provided in the Recreational Vehicle Parks And Campgrounds Market report?
While the report offers comprehensive insights, it's advisable to review the specific contents or supplementary materials provided to ascertain if additional resources or data are available.
14. How can I stay updated on further developments or reports in the Recreational Vehicle Parks And Campgrounds Market?
To stay informed about further developments, trends, and reports in the Recreational Vehicle Parks And Campgrounds Market, consider subscribing to industry newsletters, following relevant companies and organizations, or regularly checking reputable industry news sources and publications.
Methodology
Step 1 - Identification of Relevant Samples Size from Population Database


Step 2 - Approaches for Defining Global Market Size (Value, Volume* & Price*)

Note*: In applicable scenarios
Step 3 - Data Sources
Primary Research
- Web Analytics
- Survey Reports
- Research Institute
- Latest Research Reports
- Opinion Leaders
Secondary Research
- Annual Reports
- White Paper
- Latest Press Release
- Industry Association
- Paid Database
- Investor Presentations

Step 4 - Data Triangulation
Involves using different sources of information in order to increase the validity of a study
These sources are likely to be stakeholders in a program - participants, other researchers, program staff, other community members, and so on.
Then we put all data in single framework & apply various statistical tools to find out the dynamic on the market.
During the analysis stage, feedback from the stakeholder groups would be compared to determine areas of agreement as well as areas of divergence