

Key Insights
The Recovered Carbon Black (RCB) market is poised for significant expansion, driven by escalating environmental mandates and stringent waste tire management policies. Projected to grow at a Compound Annual Growth Rate (CAGR) of 4.8%, the market is anticipated to reach a size of $14.5 billion by 2025. Key application areas, including tires, plastics, and batteries, are experiencing robust demand as industries increasingly adopt sustainable alternatives to virgin carbon black. The automotive and industrial sectors are principal end-users, contributing substantially to the market's overall value. Geographically, the Asia-Pacific region, particularly China and India, leads market growth due to substantial tire production, waste generation, and a strong emphasis on recycling. North America and Europe also represent significant markets, characterized by rigorous environmental regulations and the presence of key industry players. Key restraints include substantial capital investment for RCB production facilities and the ongoing technological challenges in maintaining consistent product quality.
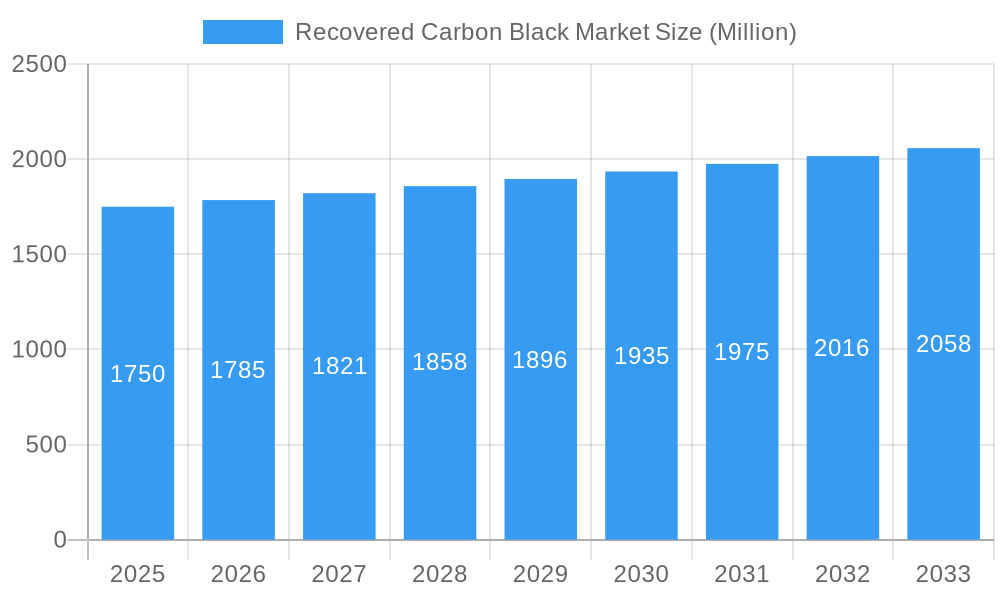
Recovered Carbon Black Market Market Size (In Billion)
The competitive environment is dynamic, featuring both established leaders and innovative new entrants. Companies such as Enrestec Inc, Bolder Industries, and Scandinavian Enviro Systems AB are at the forefront of technological advancements and capacity expansion to address the burgeoning RCB demand. Continuous research and development efforts are focused on enhancing RCB quality and consistency, thereby increasing its appeal as a viable substitute for virgin carbon black across various applications. Future market trajectory will be shaped by ongoing technological innovation, governmental support for recycling initiatives, and the further reinforcement of global environmental regulations. The diversification of RCB applications into emerging sectors like energy storage (batteries) and construction materials presents promising growth avenues. Overall, the RCB market outlook is highly positive, underpinned by the convergence of sustainability imperatives and technological progress.
Recovered Carbon Black Market Company Market Share
Recovered Carbon Black Market: A Comprehensive Report (2019-2033)
This in-depth report provides a comprehensive analysis of the Recovered Carbon Black (rCB) market, encompassing market dynamics, growth trends, regional analysis, and key player profiles. With a focus on the parent market of recycled materials and the child market of carbon black alternatives, this report offers invaluable insights for industry professionals, investors, and strategic decision-makers. The study period covers 2019-2033, with 2025 as the base and estimated year.
Recovered Carbon Black Market Dynamics & Structure
The rCB market is experiencing significant growth driven by increasing environmental concerns and stringent regulations regarding waste tire management. Market concentration is currently moderate, with several key players vying for market share. Technological innovation, particularly in pyrolysis and other advanced recycling techniques, is a major driver. Regulatory frameworks, including policies promoting circular economy initiatives, are further accelerating adoption. Competition from virgin carbon black remains a challenge, but rCB’s cost-effectiveness and sustainability advantages are proving increasingly persuasive. Mergers and acquisitions (M&A) activity is expected to increase as larger players consolidate their positions and seek to acquire innovative technologies.
- Market Concentration: Moderately concentrated, with top 5 players holding xx% market share in 2025.
- Technological Innovation: Pyrolysis and gasification are leading technologies, with ongoing advancements in efficiency and quality.
- Regulatory Framework: Government incentives and regulations for waste tire management are creating a favorable environment for rCB.
- Competitive Substitutes: Virgin carbon black remains the primary competitor, although rCB is gaining traction due to its sustainability and cost benefits.
- M&A Activity: An estimated xx M&A deals are projected between 2025 and 2033 in the rCB sector, driven by consolidation and technology acquisition.
- Innovation Barriers: High capital investment required for advanced recycling plants, lack of standardization in rCB quality, and scalability issues.
Recovered Carbon Black Market Growth Trends & Insights
The global Recovered Carbon Black (rCB) market is experiencing robust expansion, projected to achieve a significant Compound Annual Growth Rate (CAGR) of [Insert Specific CAGR Here, e.g., 12.5%] during the forecast period of 2025-2033. The market size is anticipated to reach approximately [Insert Specific Value Here, e.g., $850] Million by 2025 and further surge to an estimated [Insert Specific Value Here, e.g., $2,100] Million by 2033. This upward trajectory is primarily propelled by the escalating demand from pivotal end-use sectors, most notably the automotive and tire manufacturing industries. These sectors are increasingly prioritizing sustainable material sourcing and are actively integrating rCB as a viable and environmentally responsible alternative to virgin carbon black. Continuous advancements in recycling technologies are significantly enhancing the quality and performance characteristics of rCB, solidifying its position as a competitive substitute. Furthermore, a discernible shift in consumer preferences towards eco-conscious products is acting as a powerful catalyst, driving broader market adoption. The market penetration of rCB is expected to witness substantial growth, climbing from an estimated [Insert Specific Percentage Here, e.g., 8%] in 2025 to an impressive [Insert Specific Percentage Here, e.g., 25%] by 2033.
Dominant Regions, Countries, or Segments in Recovered Carbon Black Market
The European region is expected to be the dominant market for rCB during the forecast period, driven by robust environmental regulations, stringent waste management policies, and a high concentration of automotive and tire manufacturing industries. Within applications, the tire segment will continue to dominate, accounting for the largest market share due to high volumes of end-of-life tires. The automotive industry will represent a key end-user driving market expansion.
- Key Drivers (Europe): Stringent environmental regulations, well-established recycling infrastructure, and a high concentration of key players.
- Key Drivers (Asia-Pacific): Growing automotive sector, increasing environmental awareness, and government support for waste management initiatives.
- Dominant Application Segment: Tires (xx% market share in 2025), followed by plastics and non-tire rubber.
- Dominant End-user Industry: Automotive (xx% market share in 2025), followed by building and construction.
- Growth Potential: High growth potential is anticipated in the Asia-Pacific region due to increasing vehicle production and waste generation.
Recovered Carbon Black Market Product Landscape
Recovered carbon black products are available in various forms, including powder, pellets, and masterbatches, to meet specific application requirements. Continuous improvements in pyrolysis and other processing technologies are enhancing the quality and consistency of rCB, enabling its use in high-performance applications. Recent innovations focus on increasing the surface area and improving the dispersion properties of rCB, ensuring its compatibility in various formulations. Unique selling propositions include environmental sustainability, cost-effectiveness, and performance comparable to virgin carbon black in certain applications.
Key Drivers, Barriers & Challenges in Recovered Carbon Black Market
Key Drivers:
- Growing demand for sustainable materials.
- Stringent environmental regulations and policies.
- Increasing cost of virgin carbon black.
- Technological advancements in rCB production.
Challenges & Restraints:
- High capital investment required for rCB production facilities.
- Inconsistent quality and standardization issues.
- Scalability challenges in production volume.
- Competition from existing virgin carbon black manufacturers. This creates price pressure and impacts market share (estimated xx% impact on market growth by 2033).
Emerging Opportunities in Recovered Carbon Black Market
The rCB market is ripe with emerging opportunities, particularly in the exploration and development of novel applications beyond traditional tire manufacturing. This includes expanding into specialized sectors such as high-performance inks, advanced coatings, and conductive plastics, where rCB can offer unique material properties. Significant potential also lies in the refinement of existing and the development of new rCB production technologies. These advancements aim to further improve the quality and consistency of rCB, while simultaneously driving down production costs, making it even more attractive to a wider range of industries. Untapped markets in developing economies, characterized by substantial volumes of waste tire accumulation, present a particularly lucrative avenue for growth. Establishing strategic partnerships with leading tire manufacturers, automotive OEMs, and major players in the plastics industry is paramount. These collaborations will be instrumental in securing consistent raw material streams and optimizing complex supply chains, thereby facilitating broader market penetration and sustainable expansion.
Growth Accelerators in the Recovered Carbon Black Market Industry
The industry's growth is significantly propelled by ongoing technological breakthroughs in pyrolysis and other advanced recycling methodologies. These innovations are instrumental in producing rCB of superior quality with enhanced properties, while concurrently reducing manufacturing costs, thereby increasing its competitiveness against virgin carbon black. Strategic alliances and robust partnerships formed between rCB producers and major end-users are crucial. These collaborations foster a stable and predictable supply chain for rCB and simultaneously create a consistent demand, mitigating market volatility. Furthermore, the strategic expansion into new and emerging geographical markets, with a particular focus on developing economies that possess high volumes of end-of-life tires, represents a substantial avenue for accelerated growth and market diversification.
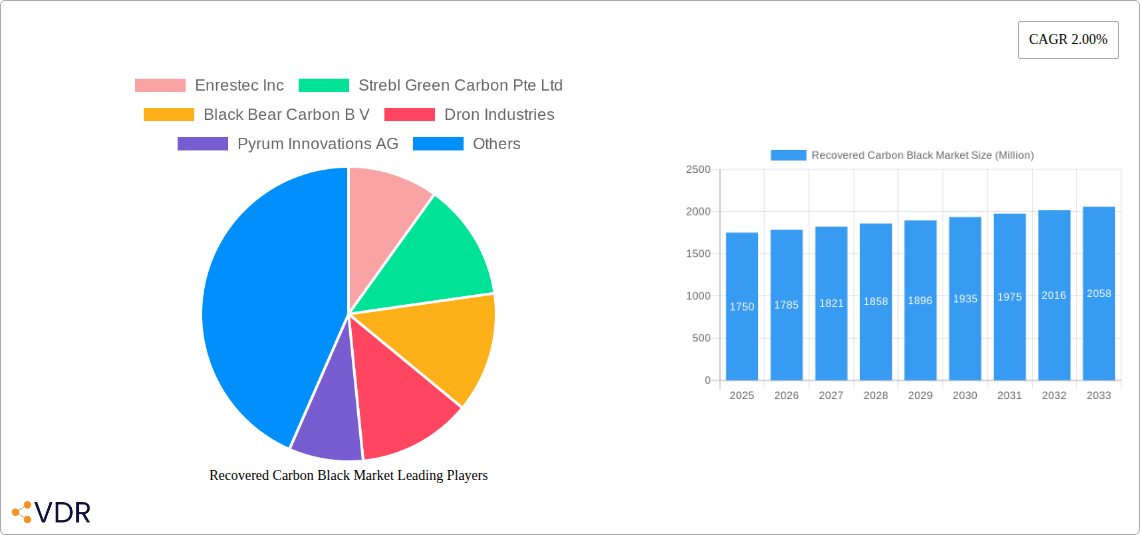
Key Players Shaping the Recovered Carbon Black Market Market
- Enrestec Inc
- Strebl Green Carbon Pte Ltd
- Black Bear Carbon B V
- Dron Industries
- Pyrum Innovations AG
- Carbon Recovery GmbH
- DVA Renewable Energy JSC
- SR2O Holdings LLC
- Klean Industries Inc
- Polimix
- Delta Energy LLC
- Reoil Sp z o o
- Bolder Industries
- Scandinavian Enviro Systems AB
- Alpha Carbone
- [Consider adding more key players if available]
Notable Milestones in Recovered Carbon Black Market Sector
- April 2020: Scandinavian Enviro Systems AB and Michelin initiated a significant collaboration to advance and innovate rCB technology, focusing on enhanced performance and sustainability.
- March 2022: Continental AG strengthened its commitment to sustainable materials by expanding its strategic partnership with Pyrum Innovations AG for the reliable production of high-quality rCB.
- May 2022: Pyrum Innovations AG marked a crucial step in optimizing its operations with the commencement of test operations for a new pelletizer. This innovation is designed to significantly improve the transportability and processing efficiency of rCB, further enhancing its market viability.
- [Consider adding more recent milestones or recent news if available]
In-Depth Recovered Carbon Black Market Market Outlook
The future of the rCB market looks promising, with continued growth driven by technological advancements, increasing environmental awareness, and supportive government policies. Strategic partnerships, market expansion into new geographical regions, and the development of innovative applications will be essential for realizing the full potential of this sustainable material. The market is poised for significant expansion, offering attractive opportunities for both established players and new entrants.
Recovered Carbon Black Market Segmentation
-
1. Application
- 1.1. Tires
- 1.2. Batteries
- 1.3. Plastics
- 1.4. Non-Tire Rubber
- 1.5. Dyes and Pigments
-
2. End-user Industry
- 2.1. Printing and Packaging
- 2.2. Industrial
- 2.3. Building and Construction
- 2.4. Electronics
- 2.5. Automotive
- 2.6. Other End-user Industries
Recovered Carbon Black Market Segmentation By Geography
-
1. Asia Pacific
- 1.1. China
- 1.2. India
- 1.3. Japan
- 1.4. South Korea
- 1.5. Rest of Asia Pacific
-
2. North America
- 2.1. United States
- 2.2. Canada
- 2.3. Mexico
-
3. Europe
- 3.1. Germany
- 3.2. United Kingdom
- 3.3. Italy
- 3.4. France
- 3.5. Rest of Europe
-
4. South America
- 4.1. Brazil
- 4.2. Argentina
- 4.3. Rest of South America
-
5. Middle East and Africa
- 5.1. Saudi Arabia
- 5.2. South Africa
- 5.3. Rest of Middle East and Africa
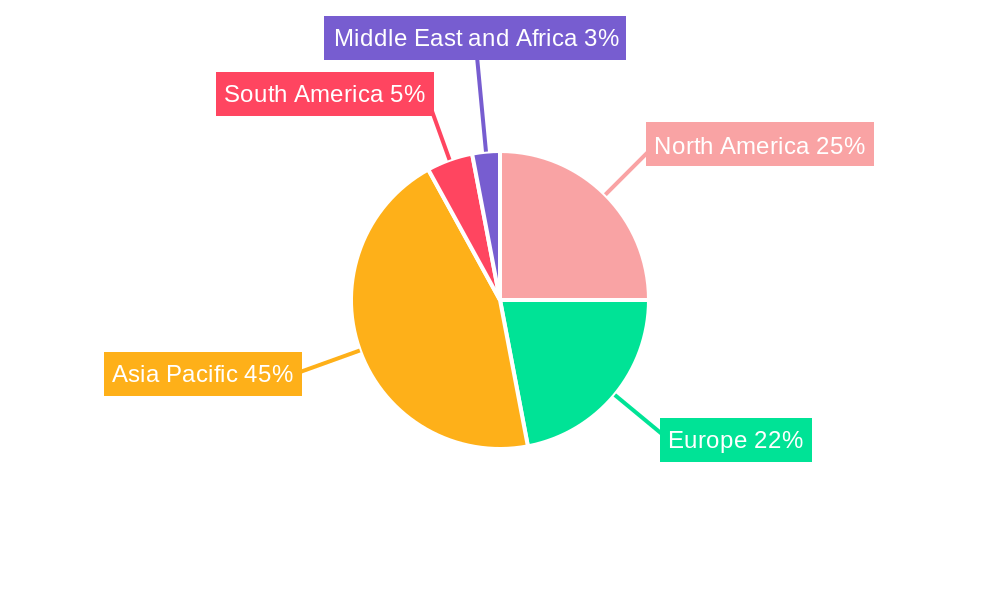
Recovered Carbon Black Market Regional Market Share
Geographic Coverage of Recovered Carbon Black Market
Recovered Carbon Black Market REPORT HIGHLIGHTS
| Aspects | Details |
|---|---|
| Study Period | 2020-2034 |
| Base Year | 2025 |
| Estimated Year | 2026 |
| Forecast Period | 2026-2034 |
| Historical Period | 2020-2025 |
| Growth Rate | CAGR of 4.8% from 2020-2034 |
| Segmentation |
|
Table of Contents
- 1. Introduction
- 1.1. Research Scope
- 1.2. Market Segmentation
- 1.3. Research Objective
- 1.4. Definitions and Assumptions
- 2. Executive Summary
- 2.1. Market Snapshot
- 3. Market Dynamics
- 3.1. Market Drivers
- 3.2. Market Restrains
- 3.3. Market Trends
- 3.4. Market Opportunities
- 4. Market Factor Analysis
- 4.1. Porters Five Forces
- 4.1.1. Bargaining Power of Suppliers
- 4.1.2. Bargaining Power of Buyers
- 4.1.3. Threat of New Entrants
- 4.1.4. Threat of Substitutes
- 4.1.5. Competitive Rivalry
- 4.2. PESTEL analysis
- 4.3. BCG Analysis
- 4.3.1. Stars (High Growth, High Market Share)
- 4.3.2. Cash Cows (Low Growth, High Market Share)
- 4.3.3. Question Mark (High Growth, Low Market Share)
- 4.3.4. Dogs (Low Growth, Low Market Share)
- 4.4. Ansoff Matrix Analysis
- 4.5. Supply Chain Analysis
- 4.6. Regulatory Landscape
- 4.7. Current Market Potential and Opportunity Assessment (TAM–SAM–SOM Framework)
- 4.8. VDR Analyst Note
- 4.1. Porters Five Forces
- 5. Market Analysis, Insights and Forecast 2021-2033
- 5.1. Market Analysis, Insights and Forecast - by Application
- 5.1.1. Tires
- 5.1.2. Batteries
- 5.1.3. Plastics
- 5.1.4. Non-Tire Rubber
- 5.1.5. Dyes and Pigments
- 5.2. Market Analysis, Insights and Forecast - by End-user Industry
- 5.2.1. Printing and Packaging
- 5.2.2. Industrial
- 5.2.3. Building and Construction
- 5.2.4. Electronics
- 5.2.5. Automotive
- 5.2.6. Other End-user Industries
- 5.3. Market Analysis, Insights and Forecast - by Region
- 5.3.1. Asia Pacific
- 5.3.2. North America
- 5.3.3. Europe
- 5.3.4. South America
- 5.3.5. Middle East and Africa
- 5.1. Market Analysis, Insights and Forecast - by Application
- 6. Global Recovered Carbon Black Market Analysis, Insights and Forecast, 2021-2033
- 6.1. Market Analysis, Insights and Forecast - by Application
- 6.1.1. Tires
- 6.1.2. Batteries
- 6.1.3. Plastics
- 6.1.4. Non-Tire Rubber
- 6.1.5. Dyes and Pigments
- 6.2. Market Analysis, Insights and Forecast - by End-user Industry
- 6.2.1. Printing and Packaging
- 6.2.2. Industrial
- 6.2.3. Building and Construction
- 6.2.4. Electronics
- 6.2.5. Automotive
- 6.2.6. Other End-user Industries
- 6.1. Market Analysis, Insights and Forecast - by Application
- 7. Asia Pacific Recovered Carbon Black Market Analysis, Insights and Forecast, 2021-2033
- 7.1. Market Analysis, Insights and Forecast - by Application
- 7.1.1. Tires
- 7.1.2. Batteries
- 7.1.3. Plastics
- 7.1.4. Non-Tire Rubber
- 7.1.5. Dyes and Pigments
- 7.2. Market Analysis, Insights and Forecast - by End-user Industry
- 7.2.1. Printing and Packaging
- 7.2.2. Industrial
- 7.2.3. Building and Construction
- 7.2.4. Electronics
- 7.2.5. Automotive
- 7.2.6. Other End-user Industries
- 7.1. Market Analysis, Insights and Forecast - by Application
- 8. North America Recovered Carbon Black Market Analysis, Insights and Forecast, 2021-2033
- 8.1. Market Analysis, Insights and Forecast - by Application
- 8.1.1. Tires
- 8.1.2. Batteries
- 8.1.3. Plastics
- 8.1.4. Non-Tire Rubber
- 8.1.5. Dyes and Pigments
- 8.2. Market Analysis, Insights and Forecast - by End-user Industry
- 8.2.1. Printing and Packaging
- 8.2.2. Industrial
- 8.2.3. Building and Construction
- 8.2.4. Electronics
- 8.2.5. Automotive
- 8.2.6. Other End-user Industries
- 8.1. Market Analysis, Insights and Forecast - by Application
- 9. Europe Recovered Carbon Black Market Analysis, Insights and Forecast, 2021-2033
- 9.1. Market Analysis, Insights and Forecast - by Application
- 9.1.1. Tires
- 9.1.2. Batteries
- 9.1.3. Plastics
- 9.1.4. Non-Tire Rubber
- 9.1.5. Dyes and Pigments
- 9.2. Market Analysis, Insights and Forecast - by End-user Industry
- 9.2.1. Printing and Packaging
- 9.2.2. Industrial
- 9.2.3. Building and Construction
- 9.2.4. Electronics
- 9.2.5. Automotive
- 9.2.6. Other End-user Industries
- 9.1. Market Analysis, Insights and Forecast - by Application
- 10. South America Recovered Carbon Black Market Analysis, Insights and Forecast, 2021-2033
- 10.1. Market Analysis, Insights and Forecast - by Application
- 10.1.1. Tires
- 10.1.2. Batteries
- 10.1.3. Plastics
- 10.1.4. Non-Tire Rubber
- 10.1.5. Dyes and Pigments
- 10.2. Market Analysis, Insights and Forecast - by End-user Industry
- 10.2.1. Printing and Packaging
- 10.2.2. Industrial
- 10.2.3. Building and Construction
- 10.2.4. Electronics
- 10.2.5. Automotive
- 10.2.6. Other End-user Industries
- 10.1. Market Analysis, Insights and Forecast - by Application
- 11. Middle East and Africa Recovered Carbon Black Market Analysis, Insights and Forecast, 2021-2033
- 11.1. Market Analysis, Insights and Forecast - by Application
- 11.1.1. Tires
- 11.1.2. Batteries
- 11.1.3. Plastics
- 11.1.4. Non-Tire Rubber
- 11.1.5. Dyes and Pigments
- 11.2. Market Analysis, Insights and Forecast - by End-user Industry
- 11.2.1. Printing and Packaging
- 11.2.2. Industrial
- 11.2.3. Building and Construction
- 11.2.4. Electronics
- 11.2.5. Automotive
- 11.2.6. Other End-user Industries
- 11.1. Market Analysis, Insights and Forecast - by Application
- 12. Competitive Analysis
- 12.1. Company Profiles
- 12.1.1 Enrestec Inc
- 12.1.1.1. Company Overview
- 12.1.1.2. Products
- 12.1.1.3. Company Financials
- 12.1.1.4. SWOT Analysis
- 12.1.2 Strebl Green Carbon Pte Ltd
- 12.1.2.1. Company Overview
- 12.1.2.2. Products
- 12.1.2.3. Company Financials
- 12.1.2.4. SWOT Analysis
- 12.1.3 Black Bear Carbon B V
- 12.1.3.1. Company Overview
- 12.1.3.2. Products
- 12.1.3.3. Company Financials
- 12.1.3.4. SWOT Analysis
- 12.1.4 Dron Industries
- 12.1.4.1. Company Overview
- 12.1.4.2. Products
- 12.1.4.3. Company Financials
- 12.1.4.4. SWOT Analysis
- 12.1.5 Pyrum Innovations AG
- 12.1.5.1. Company Overview
- 12.1.5.2. Products
- 12.1.5.3. Company Financials
- 12.1.5.4. SWOT Analysis
- 12.1.6 Carbon Recovery GmbH
- 12.1.6.1. Company Overview
- 12.1.6.2. Products
- 12.1.6.3. Company Financials
- 12.1.6.4. SWOT Analysis
- 12.1.7 DVA Renewable Energy JSC
- 12.1.7.1. Company Overview
- 12.1.7.2. Products
- 12.1.7.3. Company Financials
- 12.1.7.4. SWOT Analysis
- 12.1.8 SR2O Holdings LLC
- 12.1.8.1. Company Overview
- 12.1.8.2. Products
- 12.1.8.3. Company Financials
- 12.1.8.4. SWOT Analysis
- 12.1.9 Klean Industries Inc
- 12.1.9.1. Company Overview
- 12.1.9.2. Products
- 12.1.9.3. Company Financials
- 12.1.9.4. SWOT Analysis
- 12.1.10 Polimix
- 12.1.10.1. Company Overview
- 12.1.10.2. Products
- 12.1.10.3. Company Financials
- 12.1.10.4. SWOT Analysis
- 12.1.11 Delta Energy LLC
- 12.1.11.1. Company Overview
- 12.1.11.2. Products
- 12.1.11.3. Company Financials
- 12.1.11.4. SWOT Analysis
- 12.1.12 Reoil Sp z o o
- 12.1.12.1. Company Overview
- 12.1.12.2. Products
- 12.1.12.3. Company Financials
- 12.1.12.4. SWOT Analysis
- 12.1.13 Bolder Industries
- 12.1.13.1. Company Overview
- 12.1.13.2. Products
- 12.1.13.3. Company Financials
- 12.1.13.4. SWOT Analysis
- 12.1.14 Scandinavian Enviro Systems AB
- 12.1.14.1. Company Overview
- 12.1.14.2. Products
- 12.1.14.3. Company Financials
- 12.1.14.4. SWOT Analysis
- 12.1.15 Alpha Carbone
- 12.1.15.1. Company Overview
- 12.1.15.2. Products
- 12.1.15.3. Company Financials
- 12.1.15.4. SWOT Analysis
- 12.1.1 Enrestec Inc
- 12.2. Market Entropy
- 12.2.1 Company's Key Areas Served
- 12.2.2 Recent Developments
- 12.3. Company Market Share Analysis 2025
- 12.3.1 Top 5 Companies Market Share Analysis
- 12.3.2 Top 3 Companies Market Share Analysis
- 12.4. List of Potential Customers
- 13. Research Methodology
List of Figures
- Figure 1: Global Recovered Carbon Black Market Revenue Breakdown (billion, %) by Region 2025 & 2033
- Figure 2: Global Recovered Carbon Black Market Volume Breakdown (K Tons, %) by Region 2025 & 2033
- Figure 3: Asia Pacific Recovered Carbon Black Market Revenue (billion), by Application 2025 & 2033
- Figure 4: Asia Pacific Recovered Carbon Black Market Volume (K Tons), by Application 2025 & 2033
- Figure 5: Asia Pacific Recovered Carbon Black Market Revenue Share (%), by Application 2025 & 2033
- Figure 6: Asia Pacific Recovered Carbon Black Market Volume Share (%), by Application 2025 & 2033
- Figure 7: Asia Pacific Recovered Carbon Black Market Revenue (billion), by End-user Industry 2025 & 2033
- Figure 8: Asia Pacific Recovered Carbon Black Market Volume (K Tons), by End-user Industry 2025 & 2033
- Figure 9: Asia Pacific Recovered Carbon Black Market Revenue Share (%), by End-user Industry 2025 & 2033
- Figure 10: Asia Pacific Recovered Carbon Black Market Volume Share (%), by End-user Industry 2025 & 2033
- Figure 11: Asia Pacific Recovered Carbon Black Market Revenue (billion), by Country 2025 & 2033
- Figure 12: Asia Pacific Recovered Carbon Black Market Volume (K Tons), by Country 2025 & 2033
- Figure 13: Asia Pacific Recovered Carbon Black Market Revenue Share (%), by Country 2025 & 2033
- Figure 14: Asia Pacific Recovered Carbon Black Market Volume Share (%), by Country 2025 & 2033
- Figure 15: North America Recovered Carbon Black Market Revenue (billion), by Application 2025 & 2033
- Figure 16: North America Recovered Carbon Black Market Volume (K Tons), by Application 2025 & 2033
- Figure 17: North America Recovered Carbon Black Market Revenue Share (%), by Application 2025 & 2033
- Figure 18: North America Recovered Carbon Black Market Volume Share (%), by Application 2025 & 2033
- Figure 19: North America Recovered Carbon Black Market Revenue (billion), by End-user Industry 2025 & 2033
- Figure 20: North America Recovered Carbon Black Market Volume (K Tons), by End-user Industry 2025 & 2033
- Figure 21: North America Recovered Carbon Black Market Revenue Share (%), by End-user Industry 2025 & 2033
- Figure 22: North America Recovered Carbon Black Market Volume Share (%), by End-user Industry 2025 & 2033
- Figure 23: North America Recovered Carbon Black Market Revenue (billion), by Country 2025 & 2033
- Figure 24: North America Recovered Carbon Black Market Volume (K Tons), by Country 2025 & 2033
- Figure 25: North America Recovered Carbon Black Market Revenue Share (%), by Country 2025 & 2033
- Figure 26: North America Recovered Carbon Black Market Volume Share (%), by Country 2025 & 2033
- Figure 27: Europe Recovered Carbon Black Market Revenue (billion), by Application 2025 & 2033
- Figure 28: Europe Recovered Carbon Black Market Volume (K Tons), by Application 2025 & 2033
- Figure 29: Europe Recovered Carbon Black Market Revenue Share (%), by Application 2025 & 2033
- Figure 30: Europe Recovered Carbon Black Market Volume Share (%), by Application 2025 & 2033
- Figure 31: Europe Recovered Carbon Black Market Revenue (billion), by End-user Industry 2025 & 2033
- Figure 32: Europe Recovered Carbon Black Market Volume (K Tons), by End-user Industry 2025 & 2033
- Figure 33: Europe Recovered Carbon Black Market Revenue Share (%), by End-user Industry 2025 & 2033
- Figure 34: Europe Recovered Carbon Black Market Volume Share (%), by End-user Industry 2025 & 2033
- Figure 35: Europe Recovered Carbon Black Market Revenue (billion), by Country 2025 & 2033
- Figure 36: Europe Recovered Carbon Black Market Volume (K Tons), by Country 2025 & 2033
- Figure 37: Europe Recovered Carbon Black Market Revenue Share (%), by Country 2025 & 2033
- Figure 38: Europe Recovered Carbon Black Market Volume Share (%), by Country 2025 & 2033
- Figure 39: South America Recovered Carbon Black Market Revenue (billion), by Application 2025 & 2033
- Figure 40: South America Recovered Carbon Black Market Volume (K Tons), by Application 2025 & 2033
- Figure 41: South America Recovered Carbon Black Market Revenue Share (%), by Application 2025 & 2033
- Figure 42: South America Recovered Carbon Black Market Volume Share (%), by Application 2025 & 2033
- Figure 43: South America Recovered Carbon Black Market Revenue (billion), by End-user Industry 2025 & 2033
- Figure 44: South America Recovered Carbon Black Market Volume (K Tons), by End-user Industry 2025 & 2033
- Figure 45: South America Recovered Carbon Black Market Revenue Share (%), by End-user Industry 2025 & 2033
- Figure 46: South America Recovered Carbon Black Market Volume Share (%), by End-user Industry 2025 & 2033
- Figure 47: South America Recovered Carbon Black Market Revenue (billion), by Country 2025 & 2033
- Figure 48: South America Recovered Carbon Black Market Volume (K Tons), by Country 2025 & 2033
- Figure 49: South America Recovered Carbon Black Market Revenue Share (%), by Country 2025 & 2033
- Figure 50: South America Recovered Carbon Black Market Volume Share (%), by Country 2025 & 2033
- Figure 51: Middle East and Africa Recovered Carbon Black Market Revenue (billion), by Application 2025 & 2033
- Figure 52: Middle East and Africa Recovered Carbon Black Market Volume (K Tons), by Application 2025 & 2033
- Figure 53: Middle East and Africa Recovered Carbon Black Market Revenue Share (%), by Application 2025 & 2033
- Figure 54: Middle East and Africa Recovered Carbon Black Market Volume Share (%), by Application 2025 & 2033
- Figure 55: Middle East and Africa Recovered Carbon Black Market Revenue (billion), by End-user Industry 2025 & 2033
- Figure 56: Middle East and Africa Recovered Carbon Black Market Volume (K Tons), by End-user Industry 2025 & 2033
- Figure 57: Middle East and Africa Recovered Carbon Black Market Revenue Share (%), by End-user Industry 2025 & 2033
- Figure 58: Middle East and Africa Recovered Carbon Black Market Volume Share (%), by End-user Industry 2025 & 2033
- Figure 59: Middle East and Africa Recovered Carbon Black Market Revenue (billion), by Country 2025 & 2033
- Figure 60: Middle East and Africa Recovered Carbon Black Market Volume (K Tons), by Country 2025 & 2033
- Figure 61: Middle East and Africa Recovered Carbon Black Market Revenue Share (%), by Country 2025 & 2033
- Figure 62: Middle East and Africa Recovered Carbon Black Market Volume Share (%), by Country 2025 & 2033
List of Tables
- Table 1: Global Recovered Carbon Black Market Revenue billion Forecast, by Application 2020 & 2033
- Table 2: Global Recovered Carbon Black Market Volume K Tons Forecast, by Application 2020 & 2033
- Table 3: Global Recovered Carbon Black Market Revenue billion Forecast, by End-user Industry 2020 & 2033
- Table 4: Global Recovered Carbon Black Market Volume K Tons Forecast, by End-user Industry 2020 & 2033
- Table 5: Global Recovered Carbon Black Market Revenue billion Forecast, by Region 2020 & 2033
- Table 6: Global Recovered Carbon Black Market Volume K Tons Forecast, by Region 2020 & 2033
- Table 7: Global Recovered Carbon Black Market Revenue billion Forecast, by Application 2020 & 2033
- Table 8: Global Recovered Carbon Black Market Volume K Tons Forecast, by Application 2020 & 2033
- Table 9: Global Recovered Carbon Black Market Revenue billion Forecast, by End-user Industry 2020 & 2033
- Table 10: Global Recovered Carbon Black Market Volume K Tons Forecast, by End-user Industry 2020 & 2033
- Table 11: Global Recovered Carbon Black Market Revenue billion Forecast, by Country 2020 & 2033
- Table 12: Global Recovered Carbon Black Market Volume K Tons Forecast, by Country 2020 & 2033
- Table 13: China Recovered Carbon Black Market Revenue (billion) Forecast, by Application 2020 & 2033
- Table 14: China Recovered Carbon Black Market Volume (K Tons) Forecast, by Application 2020 & 2033
- Table 15: India Recovered Carbon Black Market Revenue (billion) Forecast, by Application 2020 & 2033
- Table 16: India Recovered Carbon Black Market Volume (K Tons) Forecast, by Application 2020 & 2033
- Table 17: Japan Recovered Carbon Black Market Revenue (billion) Forecast, by Application 2020 & 2033
- Table 18: Japan Recovered Carbon Black Market Volume (K Tons) Forecast, by Application 2020 & 2033
- Table 19: South Korea Recovered Carbon Black Market Revenue (billion) Forecast, by Application 2020 & 2033
- Table 20: South Korea Recovered Carbon Black Market Volume (K Tons) Forecast, by Application 2020 & 2033
- Table 21: Rest of Asia Pacific Recovered Carbon Black Market Revenue (billion) Forecast, by Application 2020 & 2033
- Table 22: Rest of Asia Pacific Recovered Carbon Black Market Volume (K Tons) Forecast, by Application 2020 & 2033
- Table 23: Global Recovered Carbon Black Market Revenue billion Forecast, by Application 2020 & 2033
- Table 24: Global Recovered Carbon Black Market Volume K Tons Forecast, by Application 2020 & 2033
- Table 25: Global Recovered Carbon Black Market Revenue billion Forecast, by End-user Industry 2020 & 2033
- Table 26: Global Recovered Carbon Black Market Volume K Tons Forecast, by End-user Industry 2020 & 2033
- Table 27: Global Recovered Carbon Black Market Revenue billion Forecast, by Country 2020 & 2033
- Table 28: Global Recovered Carbon Black Market Volume K Tons Forecast, by Country 2020 & 2033
- Table 29: United States Recovered Carbon Black Market Revenue (billion) Forecast, by Application 2020 & 2033
- Table 30: United States Recovered Carbon Black Market Volume (K Tons) Forecast, by Application 2020 & 2033
- Table 31: Canada Recovered Carbon Black Market Revenue (billion) Forecast, by Application 2020 & 2033
- Table 32: Canada Recovered Carbon Black Market Volume (K Tons) Forecast, by Application 2020 & 2033
- Table 33: Mexico Recovered Carbon Black Market Revenue (billion) Forecast, by Application 2020 & 2033
- Table 34: Mexico Recovered Carbon Black Market Volume (K Tons) Forecast, by Application 2020 & 2033
- Table 35: Global Recovered Carbon Black Market Revenue billion Forecast, by Application 2020 & 2033
- Table 36: Global Recovered Carbon Black Market Volume K Tons Forecast, by Application 2020 & 2033
- Table 37: Global Recovered Carbon Black Market Revenue billion Forecast, by End-user Industry 2020 & 2033
- Table 38: Global Recovered Carbon Black Market Volume K Tons Forecast, by End-user Industry 2020 & 2033
- Table 39: Global Recovered Carbon Black Market Revenue billion Forecast, by Country 2020 & 2033
- Table 40: Global Recovered Carbon Black Market Volume K Tons Forecast, by Country 2020 & 2033
- Table 41: Germany Recovered Carbon Black Market Revenue (billion) Forecast, by Application 2020 & 2033
- Table 42: Germany Recovered Carbon Black Market Volume (K Tons) Forecast, by Application 2020 & 2033
- Table 43: United Kingdom Recovered Carbon Black Market Revenue (billion) Forecast, by Application 2020 & 2033
- Table 44: United Kingdom Recovered Carbon Black Market Volume (K Tons) Forecast, by Application 2020 & 2033
- Table 45: Italy Recovered Carbon Black Market Revenue (billion) Forecast, by Application 2020 & 2033
- Table 46: Italy Recovered Carbon Black Market Volume (K Tons) Forecast, by Application 2020 & 2033
- Table 47: France Recovered Carbon Black Market Revenue (billion) Forecast, by Application 2020 & 2033
- Table 48: France Recovered Carbon Black Market Volume (K Tons) Forecast, by Application 2020 & 2033
- Table 49: Rest of Europe Recovered Carbon Black Market Revenue (billion) Forecast, by Application 2020 & 2033
- Table 50: Rest of Europe Recovered Carbon Black Market Volume (K Tons) Forecast, by Application 2020 & 2033
- Table 51: Global Recovered Carbon Black Market Revenue billion Forecast, by Application 2020 & 2033
- Table 52: Global Recovered Carbon Black Market Volume K Tons Forecast, by Application 2020 & 2033
- Table 53: Global Recovered Carbon Black Market Revenue billion Forecast, by End-user Industry 2020 & 2033
- Table 54: Global Recovered Carbon Black Market Volume K Tons Forecast, by End-user Industry 2020 & 2033
- Table 55: Global Recovered Carbon Black Market Revenue billion Forecast, by Country 2020 & 2033
- Table 56: Global Recovered Carbon Black Market Volume K Tons Forecast, by Country 2020 & 2033
- Table 57: Brazil Recovered Carbon Black Market Revenue (billion) Forecast, by Application 2020 & 2033
- Table 58: Brazil Recovered Carbon Black Market Volume (K Tons) Forecast, by Application 2020 & 2033
- Table 59: Argentina Recovered Carbon Black Market Revenue (billion) Forecast, by Application 2020 & 2033
- Table 60: Argentina Recovered Carbon Black Market Volume (K Tons) Forecast, by Application 2020 & 2033
- Table 61: Rest of South America Recovered Carbon Black Market Revenue (billion) Forecast, by Application 2020 & 2033
- Table 62: Rest of South America Recovered Carbon Black Market Volume (K Tons) Forecast, by Application 2020 & 2033
- Table 63: Global Recovered Carbon Black Market Revenue billion Forecast, by Application 2020 & 2033
- Table 64: Global Recovered Carbon Black Market Volume K Tons Forecast, by Application 2020 & 2033
- Table 65: Global Recovered Carbon Black Market Revenue billion Forecast, by End-user Industry 2020 & 2033
- Table 66: Global Recovered Carbon Black Market Volume K Tons Forecast, by End-user Industry 2020 & 2033
- Table 67: Global Recovered Carbon Black Market Revenue billion Forecast, by Country 2020 & 2033
- Table 68: Global Recovered Carbon Black Market Volume K Tons Forecast, by Country 2020 & 2033
- Table 69: Saudi Arabia Recovered Carbon Black Market Revenue (billion) Forecast, by Application 2020 & 2033
- Table 70: Saudi Arabia Recovered Carbon Black Market Volume (K Tons) Forecast, by Application 2020 & 2033
- Table 71: South Africa Recovered Carbon Black Market Revenue (billion) Forecast, by Application 2020 & 2033
- Table 72: South Africa Recovered Carbon Black Market Volume (K Tons) Forecast, by Application 2020 & 2033
- Table 73: Rest of Middle East and Africa Recovered Carbon Black Market Revenue (billion) Forecast, by Application 2020 & 2033
- Table 74: Rest of Middle East and Africa Recovered Carbon Black Market Volume (K Tons) Forecast, by Application 2020 & 2033
Frequently Asked Questions
1. What is the projected Compound Annual Growth Rate (CAGR) of the Recovered Carbon Black Market?
The projected CAGR is approximately 4.8%.
2. Which companies are prominent players in the Recovered Carbon Black Market?
Key companies in the market include Enrestec Inc, Strebl Green Carbon Pte Ltd, Black Bear Carbon B V, Dron Industries, Pyrum Innovations AG, Carbon Recovery GmbH, DVA Renewable Energy JSC, SR2O Holdings LLC, Klean Industries Inc, Polimix, Delta Energy LLC, Reoil Sp z o o, Bolder Industries, Scandinavian Enviro Systems AB, Alpha Carbone.
3. What are the main segments of the Recovered Carbon Black Market?
The market segments include Application, End-user Industry.
4. Can you provide details about the market size?
The market size is estimated to be USD 14.5 billion as of 2022.
5. What are some drivers contributing to market growth?
Rising Demand for Recycled and Recovered Products; Increasing Usages as Sustainable Filler in Tire and Non-tire Rubber Applications.
6. What are the notable trends driving market growth?
Increasing Usage in the Tire Industry.
7. Are there any restraints impacting market growth?
Lack of Infrastructure and Technologies for Recovered Carbon Black; Providing Consistent Quality of Recovered Carbon Black.
8. Can you provide examples of recent developments in the market?
In May 2022, Pyrum Innovations AG started the test operation of a new pelletizer at its plant site in Germany, which will enable the recovered carbon black (rCB) obtained via the pyrolysis process to be bonded into pellets, to increase their transportability and facilitates the further processing of the raw material.
9. What pricing options are available for accessing the report?
Pricing options include single-user, multi-user, and enterprise licenses priced at USD 4750, USD 5250, and USD 8750 respectively.
10. Is the market size provided in terms of value or volume?
The market size is provided in terms of value, measured in billion and volume, measured in K Tons.
11. Are there any specific market keywords associated with the report?
Yes, the market keyword associated with the report is "Recovered Carbon Black Market," which aids in identifying and referencing the specific market segment covered.
12. How do I determine which pricing option suits my needs best?
The pricing options vary based on user requirements and access needs. Individual users may opt for single-user licenses, while businesses requiring broader access may choose multi-user or enterprise licenses for cost-effective access to the report.
13. Are there any additional resources or data provided in the Recovered Carbon Black Market report?
While the report offers comprehensive insights, it's advisable to review the specific contents or supplementary materials provided to ascertain if additional resources or data are available.
14. How can I stay updated on further developments or reports in the Recovered Carbon Black Market?
To stay informed about further developments, trends, and reports in the Recovered Carbon Black Market, consider subscribing to industry newsletters, following relevant companies and organizations, or regularly checking reputable industry news sources and publications.
Methodology
Step 1 - Identification of Relevant Samples Size from Population Database


Step 2 - Approaches for Defining Global Market Size (Value, Volume* & Price*)

Note*: In applicable scenarios
Step 3 - Data Sources
Primary Research
- Web Analytics
- Survey Reports
- Research Institute
- Latest Research Reports
- Opinion Leaders
Secondary Research
- Annual Reports
- White Paper
- Latest Press Release
- Industry Association
- Paid Database
- Investor Presentations

Step 4 - Data Triangulation
Involves using different sources of information in order to increase the validity of a study
These sources are likely to be stakeholders in a program - participants, other researchers, program staff, other community members, and so on.
Then we put all data in single framework & apply various statistical tools to find out the dynamic on the market.
During the analysis stage, feedback from the stakeholder groups would be compared to determine areas of agreement as well as areas of divergence