
Key Insights
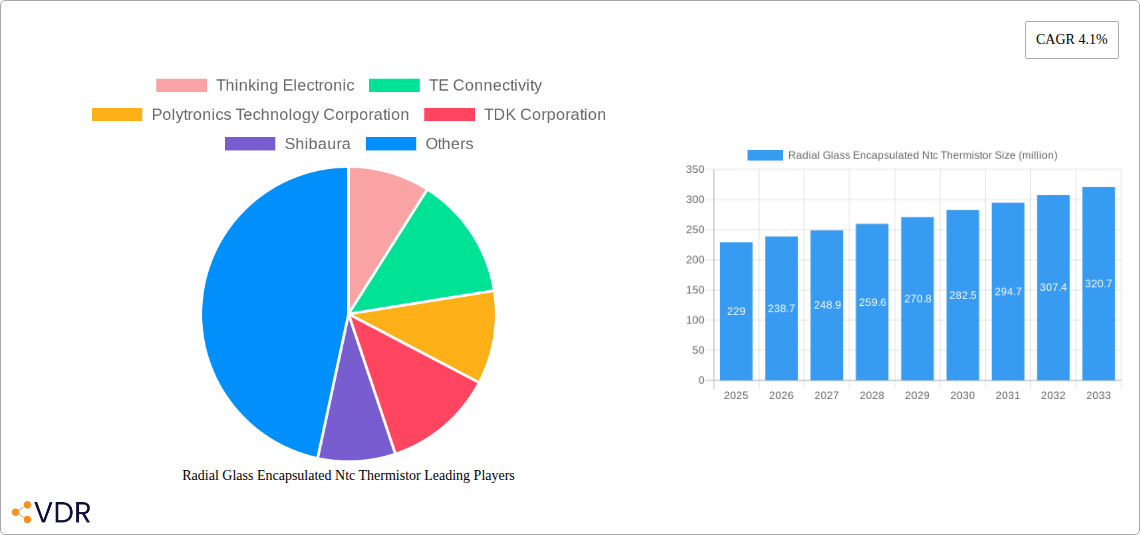
The global market for Radial Glass Encapsulated NTC Thermistors is experiencing steady growth, projected to reach $229 million in 2025 with a compound annual growth rate (CAGR) of 4.1%. This growth is driven by increasing demand across diverse sectors, including automotive, consumer electronics, and industrial automation. Miniaturization trends in electronics, coupled with the inherent advantages of NTC thermistors – like high accuracy, stability, and compact size – are fueling market expansion. The automotive industry, in particular, is a significant contributor, fueled by the growth of advanced driver-assistance systems (ADAS) and electric vehicles (EVs) requiring precise temperature sensing for battery management and other critical functions. Furthermore, the increasing adoption of IoT devices and smart home technologies further bolsters demand. While competitive pricing pressures and the potential emergence of alternative sensing technologies could pose challenges, the overall market outlook remains positive, driven by technological advancements and the enduring need for reliable and accurate temperature measurement in a vast array of applications. Key players like Thinking Electronic, TE Connectivity, Vishay, and Murata are actively driving innovation and market penetration through product diversification and strategic partnerships.
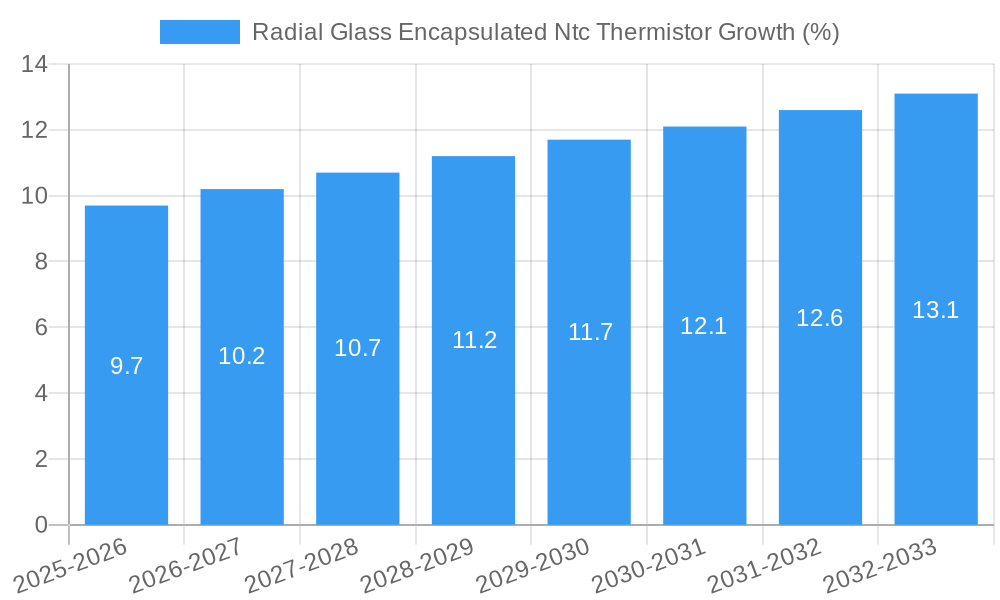
The forecast period (2025-2033) anticipates continued growth, though potentially at a slightly moderated pace as the market matures. Factors influencing future growth include the pace of technological innovation within the sensing technologies market, global economic conditions, and evolving regulatory frameworks concerning energy efficiency and safety standards. The segmentation of the market based on applications (automotive, industrial, consumer electronics, etc.) and geographic regions will reveal distinct growth patterns, offering further insights for strategic market players and investors. Companies are focusing on enhanced product features, including improved accuracy, faster response times, and wider operating temperature ranges to maintain their competitive edge and cater to the specific requirements of different applications.
Radial Glass Encapsulated NTC Thermistor Market Report: 2019-2033
This comprehensive report provides a detailed analysis of the global radial glass encapsulated NTC thermistor market, covering market dynamics, growth trends, key players, and future outlook. The study period spans from 2019 to 2033, with 2025 serving as the base and estimated year. This report is essential for industry professionals, investors, and anyone seeking a deep understanding of this crucial component in various electronic applications. The parent market is the temperature sensor market (valued at xx million units in 2025), and the child market is the automotive and industrial sensors segment.
Radial Glass Encapsulated NTC Thermistor Market Dynamics & Structure
The radial glass encapsulated NTC thermistor market is characterized by moderate concentration, with several key players holding significant market share. The market is driven by technological advancements leading to improved accuracy, miniaturization, and enhanced reliability. Stringent regulatory frameworks, particularly concerning safety and performance standards in automotive and industrial applications, significantly influence market growth. Competitive substitutes, such as other temperature sensing technologies (e.g., thermocouples, RTDs), pose a challenge, but NTC thermistors maintain their dominance due to cost-effectiveness and ease of integration. End-user demographics are diverse, encompassing automotive, industrial, consumer electronics, and healthcare sectors. M&A activity in the past five years has been moderate, with approximately xx deals recorded, primarily focused on expanding product portfolios and geographic reach.
- Market Concentration: Moderately concentrated, with top 5 players holding approximately xx% of the market share in 2025.
- Technological Innovation: Focus on miniaturization, improved accuracy (<0.1°C), and enhanced stability over wider temperature ranges.
- Regulatory Frameworks: Stringent safety and performance standards (e.g., ISO, IEC) particularly in automotive and industrial applications.
- Competitive Substitutes: Thermocouples, RTDs, but NTC thermistors retain cost and integration advantages.
- End-User Demographics: Automotive, industrial automation, consumer electronics, healthcare, and white goods.
- M&A Trends: Approximately xx M&A deals between 2019 and 2024, primarily for portfolio expansion and geographic reach.
Radial Glass Encapsulated NTC Thermistor Growth Trends & Insights
The global radial glass encapsulated NTC thermistor market witnessed substantial growth during the historical period (2019-2024), expanding from xx million units in 2019 to xx million units in 2024. This growth is primarily attributed to the increasing demand from the automotive and industrial sectors, fueled by the adoption of advanced driver-assistance systems (ADAS) and the rise of Industry 4.0. Technological disruptions, such as the integration of smart sensors and the development of high-precision thermistors, further propelled market expansion. Shifting consumer preferences towards energy-efficient and technologically advanced products also contributed to growth. The market is expected to continue its growth trajectory, with a projected CAGR of xx% during the forecast period (2025-2033), reaching xx million units by 2033. Market penetration in emerging economies is expected to significantly contribute to this growth.
Dominant Regions, Countries, or Segments in Radial Glass Encapsulated NTC Thermistor
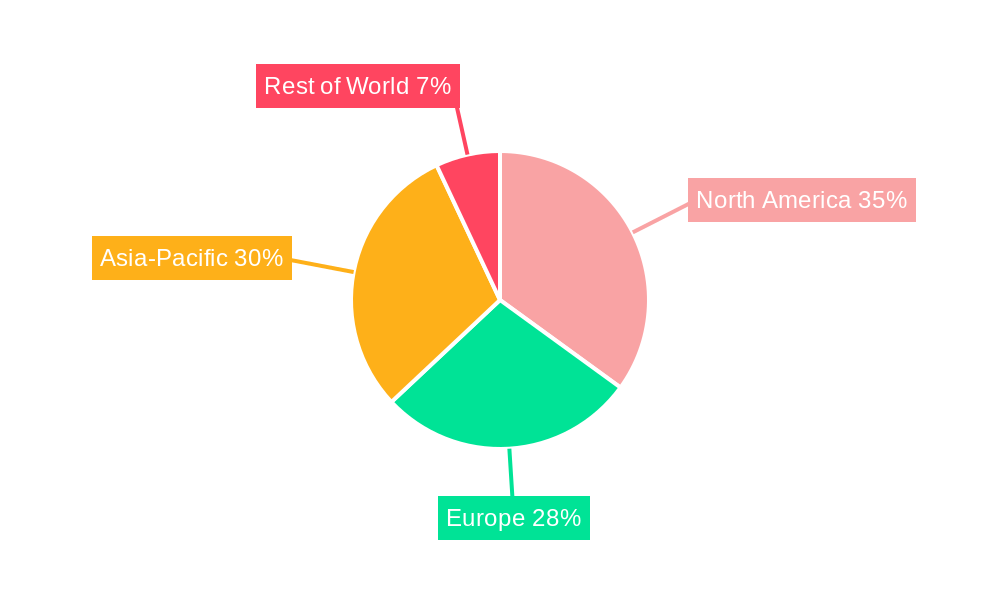
Asia-Pacific holds the dominant position in the global radial glass encapsulated NTC thermistor market, driven by robust manufacturing capabilities, a significant presence of key players, and rapidly expanding electronics manufacturing sectors in countries like China, Japan, and South Korea. North America and Europe follow as major markets, characterized by high technological advancements and stringent quality standards. The automotive and industrial segments are the key drivers of market growth in these regions.
- Asia-Pacific: Dominance due to manufacturing hubs, presence of key players, and high growth in electronics manufacturing.
- North America: High technological advancements, stringent regulations, and strong demand from the automotive sector.
- Europe: Strong demand from industrial automation and focus on high-precision sensor applications.
- Key Drivers: Government incentives for automation, increasing investments in R&D, and strong demand from end-user industries.
Radial Glass Encapsulated NTC Thermistor Product Landscape
Radial glass encapsulated NTC thermistors are available in a wide range of sizes, tolerances, and resistance values to cater to diverse application needs. Recent innovations include improved packaging for enhanced durability and miniaturization for space-constrained applications. These thermistors offer high accuracy, fast response times, and excellent stability, making them ideal for various temperature sensing applications across different industries. Unique selling propositions focus on cost-effectiveness, reliability, and ease of integration into existing systems.
Key Drivers, Barriers & Challenges in Radial Glass Encapsulated NTC Thermistor
Key Drivers: The rising demand for precise temperature measurement in diverse applications, particularly within automotive and industrial automation, drives market growth. Technological advancements resulting in smaller, more accurate, and reliable sensors are key catalysts. Government regulations emphasizing safety and efficiency further propel the market.
Challenges: Fluctuations in raw material prices, particularly precious metals used in some manufacturing processes, impact production costs. Intense competition from alternative temperature sensing technologies and the emergence of new players in the market create pressure on pricing and margins. Supply chain disruptions due to geopolitical instability or natural disasters can affect the availability of components and impact manufacturing timelines.
Emerging Opportunities in Radial Glass Encapsulated NTC Thermistor
The expanding Internet of Things (IoT) presents significant opportunities for radial glass encapsulated NTC thermistors, as these sensors are crucial for monitoring temperature in numerous connected devices. Growth in the healthcare sector, requiring precise temperature monitoring for medical devices, is another key area for market expansion. The development of new materials and manufacturing techniques that further improve accuracy and reduce costs will unlock additional market opportunities. Untapped markets in developing economies, particularly in sectors such as renewable energy and smart infrastructure, offer significant potential.
Growth Accelerators in the Radial Glass Encapsulated NTC Thermistor Industry
Technological breakthroughs in materials science and manufacturing processes will lead to cost reductions and enhanced performance of radial glass encapsulated NTC thermistors. Strategic partnerships between sensor manufacturers and system integrators will streamline the integration process and expand market access. Market expansion strategies targeting emerging economies with growing electronics manufacturing bases will contribute to long-term growth.
Key Players Shaping the Radial Glass Encapsulated NTC Thermistor Market
- Thinking Electronic
- TE Connectivity
- Polytronics Technology Corporation
- TDK Corporation
- Shibaura
- Shiheng Electronic
- Semitec Corporation
- Vishay
- Amphenol Corporation
- Mitsubishi Materials Corporation
- Murata
- WAYON
- KYOCERA AVX Components Corporation
- Bourns
- Panasonic
- Fuzetec Technology
- Sea & Land Electronic
- Ametherm
- ShangHai Keter New Materials
Notable Milestones in Radial Glass Encapsulated NTC Thermistor Sector
- 2020: Introduction of a new generation of high-precision thermistors by TDK Corporation.
- 2021: Vishay announced a new miniaturized thermistor for wearables applications.
- 2022: Strategic partnership between TE Connectivity and a major automotive manufacturer for sensor supply.
- 2023: Acquisition of a smaller sensor manufacturer by Murata.
- 2024: Launch of a new range of automotive-grade thermistors by Amphenol.
In-Depth Radial Glass Encapsulated NTC Thermistor Market Outlook
The radial glass encapsulated NTC thermistor market is poised for continued strong growth, driven by technological innovation and expanding application areas. Strategic partnerships, investments in R&D, and market expansion into emerging economies will create significant opportunities for key players. The increasing integration of sensors in various industries and the growing demand for accurate temperature measurement will ensure the sustained market growth throughout the forecast period. Companies focusing on innovation, cost optimization, and strategic alliances are likely to dominate the market in the coming years.
Radial Glass Encapsulated Ntc Thermistor Segmentation
-
1. Application
- 1.1. Consumer Electronics
- 1.2. Medical Equipment
- 1.3. Automobile
- 1.4. Home Appliances
- 1.5. Industrial Equipment
- 1.6. Aerospace and Defense
-
2. Type
- 2.1. Leaded
- 2.2. Lead-free
Radial Glass Encapsulated Ntc Thermistor Segmentation By Geography
-
1. North America
- 1.1. United States
- 1.2. Canada
- 1.3. Mexico
-
2. South America
- 2.1. Brazil
- 2.2. Argentina
- 2.3. Rest of South America
-
3. Europe
- 3.1. United Kingdom
- 3.2. Germany
- 3.3. France
- 3.4. Italy
- 3.5. Spain
- 3.6. Russia
- 3.7. Benelux
- 3.8. Nordics
- 3.9. Rest of Europe
-
4. Middle East & Africa
- 4.1. Turkey
- 4.2. Israel
- 4.3. GCC
- 4.4. North Africa
- 4.5. South Africa
- 4.6. Rest of Middle East & Africa
-
5. Asia Pacific
- 5.1. China
- 5.2. India
- 5.3. Japan
- 5.4. South Korea
- 5.5. ASEAN
- 5.6. Oceania
- 5.7. Rest of Asia Pacific
Radial Glass Encapsulated Ntc Thermistor REPORT HIGHLIGHTS
| Aspects | Details |
|---|---|
| Study Period | 2019-2033 |
| Base Year | 2024 |
| Estimated Year | 2025 |
| Forecast Period | 2025-2033 |
| Historical Period | 2019-2024 |
| Growth Rate | CAGR of 4.1% from 2019-2033 |
| Segmentation |
|
Table of Contents
- 1. Introduction
- 1.1. Research Scope
- 1.2. Market Segmentation
- 1.3. Research Methodology
- 1.4. Definitions and Assumptions
- 2. Executive Summary
- 2.1. Introduction
- 3. Market Dynamics
- 3.1. Introduction
- 3.2. Market Drivers
- 3.3. Market Restrains
- 3.4. Market Trends
- 4. Market Factor Analysis
- 4.1. Porters Five Forces
- 4.2. Supply/Value Chain
- 4.3. PESTEL analysis
- 4.4. Market Entropy
- 4.5. Patent/Trademark Analysis
- 5. Global Radial Glass Encapsulated Ntc Thermistor Analysis, Insights and Forecast, 2019-2031
- 5.1. Market Analysis, Insights and Forecast - by Application
- 5.1.1. Consumer Electronics
- 5.1.2. Medical Equipment
- 5.1.3. Automobile
- 5.1.4. Home Appliances
- 5.1.5. Industrial Equipment
- 5.1.6. Aerospace and Defense
- 5.2. Market Analysis, Insights and Forecast - by Type
- 5.2.1. Leaded
- 5.2.2. Lead-free
- 5.3. Market Analysis, Insights and Forecast - by Region
- 5.3.1. North America
- 5.3.2. South America
- 5.3.3. Europe
- 5.3.4. Middle East & Africa
- 5.3.5. Asia Pacific
- 5.1. Market Analysis, Insights and Forecast - by Application
- 6. North America Radial Glass Encapsulated Ntc Thermistor Analysis, Insights and Forecast, 2019-2031
- 6.1. Market Analysis, Insights and Forecast - by Application
- 6.1.1. Consumer Electronics
- 6.1.2. Medical Equipment
- 6.1.3. Automobile
- 6.1.4. Home Appliances
- 6.1.5. Industrial Equipment
- 6.1.6. Aerospace and Defense
- 6.2. Market Analysis, Insights and Forecast - by Type
- 6.2.1. Leaded
- 6.2.2. Lead-free
- 6.1. Market Analysis, Insights and Forecast - by Application
- 7. South America Radial Glass Encapsulated Ntc Thermistor Analysis, Insights and Forecast, 2019-2031
- 7.1. Market Analysis, Insights and Forecast - by Application
- 7.1.1. Consumer Electronics
- 7.1.2. Medical Equipment
- 7.1.3. Automobile
- 7.1.4. Home Appliances
- 7.1.5. Industrial Equipment
- 7.1.6. Aerospace and Defense
- 7.2. Market Analysis, Insights and Forecast - by Type
- 7.2.1. Leaded
- 7.2.2. Lead-free
- 7.1. Market Analysis, Insights and Forecast - by Application
- 8. Europe Radial Glass Encapsulated Ntc Thermistor Analysis, Insights and Forecast, 2019-2031
- 8.1. Market Analysis, Insights and Forecast - by Application
- 8.1.1. Consumer Electronics
- 8.1.2. Medical Equipment
- 8.1.3. Automobile
- 8.1.4. Home Appliances
- 8.1.5. Industrial Equipment
- 8.1.6. Aerospace and Defense
- 8.2. Market Analysis, Insights and Forecast - by Type
- 8.2.1. Leaded
- 8.2.2. Lead-free
- 8.1. Market Analysis, Insights and Forecast - by Application
- 9. Middle East & Africa Radial Glass Encapsulated Ntc Thermistor Analysis, Insights and Forecast, 2019-2031
- 9.1. Market Analysis, Insights and Forecast - by Application
- 9.1.1. Consumer Electronics
- 9.1.2. Medical Equipment
- 9.1.3. Automobile
- 9.1.4. Home Appliances
- 9.1.5. Industrial Equipment
- 9.1.6. Aerospace and Defense
- 9.2. Market Analysis, Insights and Forecast - by Type
- 9.2.1. Leaded
- 9.2.2. Lead-free
- 9.1. Market Analysis, Insights and Forecast - by Application
- 10. Asia Pacific Radial Glass Encapsulated Ntc Thermistor Analysis, Insights and Forecast, 2019-2031
- 10.1. Market Analysis, Insights and Forecast - by Application
- 10.1.1. Consumer Electronics
- 10.1.2. Medical Equipment
- 10.1.3. Automobile
- 10.1.4. Home Appliances
- 10.1.5. Industrial Equipment
- 10.1.6. Aerospace and Defense
- 10.2. Market Analysis, Insights and Forecast - by Type
- 10.2.1. Leaded
- 10.2.2. Lead-free
- 10.1. Market Analysis, Insights and Forecast - by Application
- 11. Competitive Analysis
- 11.1. Global Market Share Analysis 2024
- 11.2. Company Profiles
- 11.2.1 Thinking Electronic
- 11.2.1.1. Overview
- 11.2.1.2. Products
- 11.2.1.3. SWOT Analysis
- 11.2.1.4. Recent Developments
- 11.2.1.5. Financials (Based on Availability)
- 11.2.2 TE Connectivity
- 11.2.2.1. Overview
- 11.2.2.2. Products
- 11.2.2.3. SWOT Analysis
- 11.2.2.4. Recent Developments
- 11.2.2.5. Financials (Based on Availability)
- 11.2.3 Polytronics Technology Corporation
- 11.2.3.1. Overview
- 11.2.3.2. Products
- 11.2.3.3. SWOT Analysis
- 11.2.3.4. Recent Developments
- 11.2.3.5. Financials (Based on Availability)
- 11.2.4 TDK Corporation
- 11.2.4.1. Overview
- 11.2.4.2. Products
- 11.2.4.3. SWOT Analysis
- 11.2.4.4. Recent Developments
- 11.2.4.5. Financials (Based on Availability)
- 11.2.5 Shibaura
- 11.2.5.1. Overview
- 11.2.5.2. Products
- 11.2.5.3. SWOT Analysis
- 11.2.5.4. Recent Developments
- 11.2.5.5. Financials (Based on Availability)
- 11.2.6 Shiheng Electronic
- 11.2.6.1. Overview
- 11.2.6.2. Products
- 11.2.6.3. SWOT Analysis
- 11.2.6.4. Recent Developments
- 11.2.6.5. Financials (Based on Availability)
- 11.2.7 Semitec Corporation
- 11.2.7.1. Overview
- 11.2.7.2. Products
- 11.2.7.3. SWOT Analysis
- 11.2.7.4. Recent Developments
- 11.2.7.5. Financials (Based on Availability)
- 11.2.8 Vishay
- 11.2.8.1. Overview
- 11.2.8.2. Products
- 11.2.8.3. SWOT Analysis
- 11.2.8.4. Recent Developments
- 11.2.8.5. Financials (Based on Availability)
- 11.2.9 Amphenol Corporation
- 11.2.9.1. Overview
- 11.2.9.2. Products
- 11.2.9.3. SWOT Analysis
- 11.2.9.4. Recent Developments
- 11.2.9.5. Financials (Based on Availability)
- 11.2.10 Mitsubishi Materials Corporation
- 11.2.10.1. Overview
- 11.2.10.2. Products
- 11.2.10.3. SWOT Analysis
- 11.2.10.4. Recent Developments
- 11.2.10.5. Financials (Based on Availability)
- 11.2.11 Murata
- 11.2.11.1. Overview
- 11.2.11.2. Products
- 11.2.11.3. SWOT Analysis
- 11.2.11.4. Recent Developments
- 11.2.11.5. Financials (Based on Availability)
- 11.2.12 WAYON
- 11.2.12.1. Overview
- 11.2.12.2. Products
- 11.2.12.3. SWOT Analysis
- 11.2.12.4. Recent Developments
- 11.2.12.5. Financials (Based on Availability)
- 11.2.13 KYOCERA AVX Components Corporation
- 11.2.13.1. Overview
- 11.2.13.2. Products
- 11.2.13.3. SWOT Analysis
- 11.2.13.4. Recent Developments
- 11.2.13.5. Financials (Based on Availability)
- 11.2.14 Bourns
- 11.2.14.1. Overview
- 11.2.14.2. Products
- 11.2.14.3. SWOT Analysis
- 11.2.14.4. Recent Developments
- 11.2.14.5. Financials (Based on Availability)
- 11.2.15 Panasonic
- 11.2.15.1. Overview
- 11.2.15.2. Products
- 11.2.15.3. SWOT Analysis
- 11.2.15.4. Recent Developments
- 11.2.15.5. Financials (Based on Availability)
- 11.2.16 Fuzetec Technology
- 11.2.16.1. Overview
- 11.2.16.2. Products
- 11.2.16.3. SWOT Analysis
- 11.2.16.4. Recent Developments
- 11.2.16.5. Financials (Based on Availability)
- 11.2.17 Sea & Land Electronic
- 11.2.17.1. Overview
- 11.2.17.2. Products
- 11.2.17.3. SWOT Analysis
- 11.2.17.4. Recent Developments
- 11.2.17.5. Financials (Based on Availability)
- 11.2.18 Ametherm
- 11.2.18.1. Overview
- 11.2.18.2. Products
- 11.2.18.3. SWOT Analysis
- 11.2.18.4. Recent Developments
- 11.2.18.5. Financials (Based on Availability)
- 11.2.19 ShangHai Keter New Materials
- 11.2.19.1. Overview
- 11.2.19.2. Products
- 11.2.19.3. SWOT Analysis
- 11.2.19.4. Recent Developments
- 11.2.19.5. Financials (Based on Availability)
- 11.2.1 Thinking Electronic
List of Figures
- Figure 1: Global Radial Glass Encapsulated Ntc Thermistor Revenue Breakdown (million, %) by Region 2024 & 2032
- Figure 2: North America Radial Glass Encapsulated Ntc Thermistor Revenue (million), by Application 2024 & 2032
- Figure 3: North America Radial Glass Encapsulated Ntc Thermistor Revenue Share (%), by Application 2024 & 2032
- Figure 4: North America Radial Glass Encapsulated Ntc Thermistor Revenue (million), by Type 2024 & 2032
- Figure 5: North America Radial Glass Encapsulated Ntc Thermistor Revenue Share (%), by Type 2024 & 2032
- Figure 6: North America Radial Glass Encapsulated Ntc Thermistor Revenue (million), by Country 2024 & 2032
- Figure 7: North America Radial Glass Encapsulated Ntc Thermistor Revenue Share (%), by Country 2024 & 2032
- Figure 8: South America Radial Glass Encapsulated Ntc Thermistor Revenue (million), by Application 2024 & 2032
- Figure 9: South America Radial Glass Encapsulated Ntc Thermistor Revenue Share (%), by Application 2024 & 2032
- Figure 10: South America Radial Glass Encapsulated Ntc Thermistor Revenue (million), by Type 2024 & 2032
- Figure 11: South America Radial Glass Encapsulated Ntc Thermistor Revenue Share (%), by Type 2024 & 2032
- Figure 12: South America Radial Glass Encapsulated Ntc Thermistor Revenue (million), by Country 2024 & 2032
- Figure 13: South America Radial Glass Encapsulated Ntc Thermistor Revenue Share (%), by Country 2024 & 2032
- Figure 14: Europe Radial Glass Encapsulated Ntc Thermistor Revenue (million), by Application 2024 & 2032
- Figure 15: Europe Radial Glass Encapsulated Ntc Thermistor Revenue Share (%), by Application 2024 & 2032
- Figure 16: Europe Radial Glass Encapsulated Ntc Thermistor Revenue (million), by Type 2024 & 2032
- Figure 17: Europe Radial Glass Encapsulated Ntc Thermistor Revenue Share (%), by Type 2024 & 2032
- Figure 18: Europe Radial Glass Encapsulated Ntc Thermistor Revenue (million), by Country 2024 & 2032
- Figure 19: Europe Radial Glass Encapsulated Ntc Thermistor Revenue Share (%), by Country 2024 & 2032
- Figure 20: Middle East & Africa Radial Glass Encapsulated Ntc Thermistor Revenue (million), by Application 2024 & 2032
- Figure 21: Middle East & Africa Radial Glass Encapsulated Ntc Thermistor Revenue Share (%), by Application 2024 & 2032
- Figure 22: Middle East & Africa Radial Glass Encapsulated Ntc Thermistor Revenue (million), by Type 2024 & 2032
- Figure 23: Middle East & Africa Radial Glass Encapsulated Ntc Thermistor Revenue Share (%), by Type 2024 & 2032
- Figure 24: Middle East & Africa Radial Glass Encapsulated Ntc Thermistor Revenue (million), by Country 2024 & 2032
- Figure 25: Middle East & Africa Radial Glass Encapsulated Ntc Thermistor Revenue Share (%), by Country 2024 & 2032
- Figure 26: Asia Pacific Radial Glass Encapsulated Ntc Thermistor Revenue (million), by Application 2024 & 2032
- Figure 27: Asia Pacific Radial Glass Encapsulated Ntc Thermistor Revenue Share (%), by Application 2024 & 2032
- Figure 28: Asia Pacific Radial Glass Encapsulated Ntc Thermistor Revenue (million), by Type 2024 & 2032
- Figure 29: Asia Pacific Radial Glass Encapsulated Ntc Thermistor Revenue Share (%), by Type 2024 & 2032
- Figure 30: Asia Pacific Radial Glass Encapsulated Ntc Thermistor Revenue (million), by Country 2024 & 2032
- Figure 31: Asia Pacific Radial Glass Encapsulated Ntc Thermistor Revenue Share (%), by Country 2024 & 2032
List of Tables
- Table 1: Global Radial Glass Encapsulated Ntc Thermistor Revenue million Forecast, by Region 2019 & 2032
- Table 2: Global Radial Glass Encapsulated Ntc Thermistor Revenue million Forecast, by Application 2019 & 2032
- Table 3: Global Radial Glass Encapsulated Ntc Thermistor Revenue million Forecast, by Type 2019 & 2032
- Table 4: Global Radial Glass Encapsulated Ntc Thermistor Revenue million Forecast, by Region 2019 & 2032
- Table 5: Global Radial Glass Encapsulated Ntc Thermistor Revenue million Forecast, by Application 2019 & 2032
- Table 6: Global Radial Glass Encapsulated Ntc Thermistor Revenue million Forecast, by Type 2019 & 2032
- Table 7: Global Radial Glass Encapsulated Ntc Thermistor Revenue million Forecast, by Country 2019 & 2032
- Table 8: United States Radial Glass Encapsulated Ntc Thermistor Revenue (million) Forecast, by Application 2019 & 2032
- Table 9: Canada Radial Glass Encapsulated Ntc Thermistor Revenue (million) Forecast, by Application 2019 & 2032
- Table 10: Mexico Radial Glass Encapsulated Ntc Thermistor Revenue (million) Forecast, by Application 2019 & 2032
- Table 11: Global Radial Glass Encapsulated Ntc Thermistor Revenue million Forecast, by Application 2019 & 2032
- Table 12: Global Radial Glass Encapsulated Ntc Thermistor Revenue million Forecast, by Type 2019 & 2032
- Table 13: Global Radial Glass Encapsulated Ntc Thermistor Revenue million Forecast, by Country 2019 & 2032
- Table 14: Brazil Radial Glass Encapsulated Ntc Thermistor Revenue (million) Forecast, by Application 2019 & 2032
- Table 15: Argentina Radial Glass Encapsulated Ntc Thermistor Revenue (million) Forecast, by Application 2019 & 2032
- Table 16: Rest of South America Radial Glass Encapsulated Ntc Thermistor Revenue (million) Forecast, by Application 2019 & 2032
- Table 17: Global Radial Glass Encapsulated Ntc Thermistor Revenue million Forecast, by Application 2019 & 2032
- Table 18: Global Radial Glass Encapsulated Ntc Thermistor Revenue million Forecast, by Type 2019 & 2032
- Table 19: Global Radial Glass Encapsulated Ntc Thermistor Revenue million Forecast, by Country 2019 & 2032
- Table 20: United Kingdom Radial Glass Encapsulated Ntc Thermistor Revenue (million) Forecast, by Application 2019 & 2032
- Table 21: Germany Radial Glass Encapsulated Ntc Thermistor Revenue (million) Forecast, by Application 2019 & 2032
- Table 22: France Radial Glass Encapsulated Ntc Thermistor Revenue (million) Forecast, by Application 2019 & 2032
- Table 23: Italy Radial Glass Encapsulated Ntc Thermistor Revenue (million) Forecast, by Application 2019 & 2032
- Table 24: Spain Radial Glass Encapsulated Ntc Thermistor Revenue (million) Forecast, by Application 2019 & 2032
- Table 25: Russia Radial Glass Encapsulated Ntc Thermistor Revenue (million) Forecast, by Application 2019 & 2032
- Table 26: Benelux Radial Glass Encapsulated Ntc Thermistor Revenue (million) Forecast, by Application 2019 & 2032
- Table 27: Nordics Radial Glass Encapsulated Ntc Thermistor Revenue (million) Forecast, by Application 2019 & 2032
- Table 28: Rest of Europe Radial Glass Encapsulated Ntc Thermistor Revenue (million) Forecast, by Application 2019 & 2032
- Table 29: Global Radial Glass Encapsulated Ntc Thermistor Revenue million Forecast, by Application 2019 & 2032
- Table 30: Global Radial Glass Encapsulated Ntc Thermistor Revenue million Forecast, by Type 2019 & 2032
- Table 31: Global Radial Glass Encapsulated Ntc Thermistor Revenue million Forecast, by Country 2019 & 2032
- Table 32: Turkey Radial Glass Encapsulated Ntc Thermistor Revenue (million) Forecast, by Application 2019 & 2032
- Table 33: Israel Radial Glass Encapsulated Ntc Thermistor Revenue (million) Forecast, by Application 2019 & 2032
- Table 34: GCC Radial Glass Encapsulated Ntc Thermistor Revenue (million) Forecast, by Application 2019 & 2032
- Table 35: North Africa Radial Glass Encapsulated Ntc Thermistor Revenue (million) Forecast, by Application 2019 & 2032
- Table 36: South Africa Radial Glass Encapsulated Ntc Thermistor Revenue (million) Forecast, by Application 2019 & 2032
- Table 37: Rest of Middle East & Africa Radial Glass Encapsulated Ntc Thermistor Revenue (million) Forecast, by Application 2019 & 2032
- Table 38: Global Radial Glass Encapsulated Ntc Thermistor Revenue million Forecast, by Application 2019 & 2032
- Table 39: Global Radial Glass Encapsulated Ntc Thermistor Revenue million Forecast, by Type 2019 & 2032
- Table 40: Global Radial Glass Encapsulated Ntc Thermistor Revenue million Forecast, by Country 2019 & 2032
- Table 41: China Radial Glass Encapsulated Ntc Thermistor Revenue (million) Forecast, by Application 2019 & 2032
- Table 42: India Radial Glass Encapsulated Ntc Thermistor Revenue (million) Forecast, by Application 2019 & 2032
- Table 43: Japan Radial Glass Encapsulated Ntc Thermistor Revenue (million) Forecast, by Application 2019 & 2032
- Table 44: South Korea Radial Glass Encapsulated Ntc Thermistor Revenue (million) Forecast, by Application 2019 & 2032
- Table 45: ASEAN Radial Glass Encapsulated Ntc Thermistor Revenue (million) Forecast, by Application 2019 & 2032
- Table 46: Oceania Radial Glass Encapsulated Ntc Thermistor Revenue (million) Forecast, by Application 2019 & 2032
- Table 47: Rest of Asia Pacific Radial Glass Encapsulated Ntc Thermistor Revenue (million) Forecast, by Application 2019 & 2032
Frequently Asked Questions
1. What is the projected Compound Annual Growth Rate (CAGR) of the Radial Glass Encapsulated Ntc Thermistor?
The projected CAGR is approximately 4.1%.
2. Which companies are prominent players in the Radial Glass Encapsulated Ntc Thermistor?
Key companies in the market include Thinking Electronic, TE Connectivity, Polytronics Technology Corporation, TDK Corporation, Shibaura, Shiheng Electronic, Semitec Corporation, Vishay, Amphenol Corporation, Mitsubishi Materials Corporation, Murata, WAYON, KYOCERA AVX Components Corporation, Bourns, Panasonic, Fuzetec Technology, Sea & Land Electronic, Ametherm, ShangHai Keter New Materials.
3. What are the main segments of the Radial Glass Encapsulated Ntc Thermistor?
The market segments include Application, Type.
4. Can you provide details about the market size?
The market size is estimated to be USD 229 million as of 2022.
5. What are some drivers contributing to market growth?
N/A
6. What are the notable trends driving market growth?
N/A
7. Are there any restraints impacting market growth?
N/A
8. Can you provide examples of recent developments in the market?
N/A
9. What pricing options are available for accessing the report?
Pricing options include single-user, multi-user, and enterprise licenses priced at USD 4250.00, USD 6375.00, and USD 8500.00 respectively.
10. Is the market size provided in terms of value or volume?
The market size is provided in terms of value, measured in million.
11. Are there any specific market keywords associated with the report?
Yes, the market keyword associated with the report is "Radial Glass Encapsulated Ntc Thermistor," which aids in identifying and referencing the specific market segment covered.
12. How do I determine which pricing option suits my needs best?
The pricing options vary based on user requirements and access needs. Individual users may opt for single-user licenses, while businesses requiring broader access may choose multi-user or enterprise licenses for cost-effective access to the report.
13. Are there any additional resources or data provided in the Radial Glass Encapsulated Ntc Thermistor report?
While the report offers comprehensive insights, it's advisable to review the specific contents or supplementary materials provided to ascertain if additional resources or data are available.
14. How can I stay updated on further developments or reports in the Radial Glass Encapsulated Ntc Thermistor?
To stay informed about further developments, trends, and reports in the Radial Glass Encapsulated Ntc Thermistor, consider subscribing to industry newsletters, following relevant companies and organizations, or regularly checking reputable industry news sources and publications.
Methodology
Step 1 - Identification of Relevant Samples Size from Population Database


Step 2 - Approaches for Defining Global Market Size (Value, Volume* & Price*)

Note*: In applicable scenarios
Step 3 - Data Sources
Primary Research
- Web Analytics
- Survey Reports
- Research Institute
- Latest Research Reports
- Opinion Leaders
Secondary Research
- Annual Reports
- White Paper
- Latest Press Release
- Industry Association
- Paid Database
- Investor Presentations

Step 4 - Data Triangulation
Involves using different sources of information in order to increase the validity of a study
These sources are likely to be stakeholders in a program - participants, other researchers, program staff, other community members, and so on.
Then we put all data in single framework & apply various statistical tools to find out the dynamic on the market.
During the analysis stage, feedback from the stakeholder groups would be compared to determine areas of agreement as well as areas of divergence


