


Key Insights
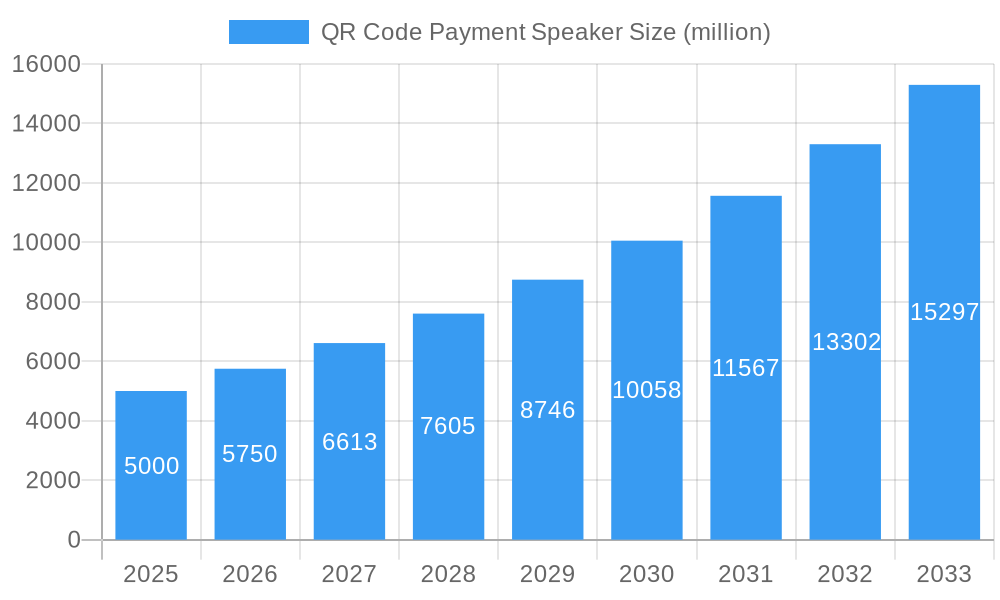
The QR Code Payment Speaker market is poised for significant expansion, projected to reach a substantial market size of $5,000 million by 2025, with a robust Compound Annual Growth Rate (CAGR) of 15% anticipated through 2033. This dynamic growth is primarily fueled by the increasing adoption of cashless transactions across diverse retail environments, particularly in convenience stores and restaurants. The inherent convenience and cost-effectiveness of QR code payment systems, coupled with advancements in device capabilities like integrated Wi-Fi and 4G connectivity, are driving this surge. Mobile vendors and even clothing stores are recognizing the efficiency gains and improved customer experience offered by these integrated payment solutions, further propelling market penetration. The proliferation of smartphones and the growing comfort level of consumers with mobile payments worldwide are fundamental enablers of this trend.
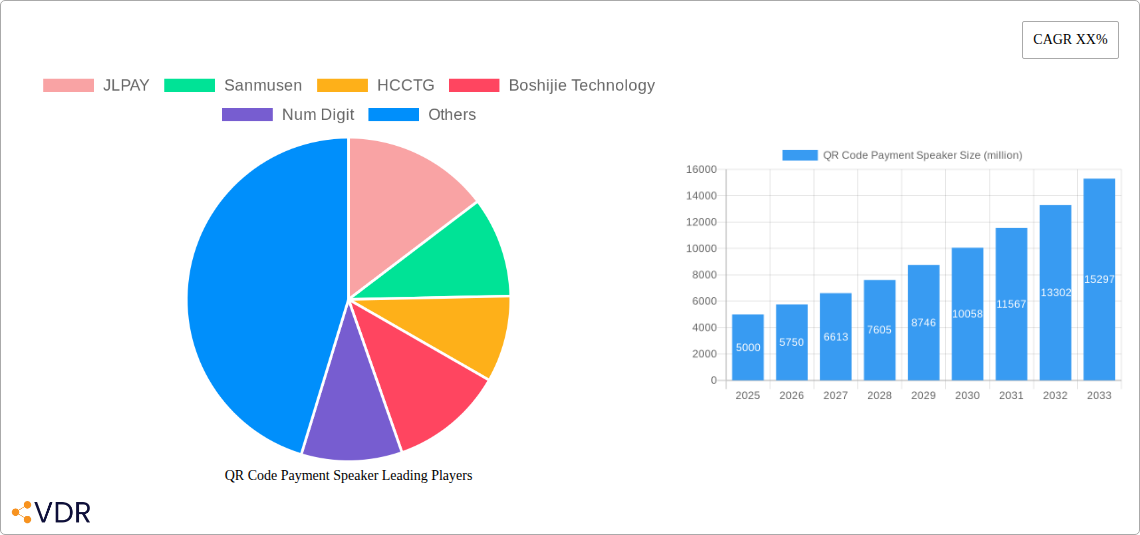
QR Code Payment Speaker Market Size (In Billion)

The market's expansion is further supported by several key drivers, including government initiatives promoting digital payments and a rising demand for streamlined point-of-sale (POS) solutions. Companies like JLPAY, Lakala International, and PAX Technology are at the forefront, innovating and expanding their offerings to cater to this growing demand. However, the market is not without its restraints. Concerns surrounding data security and privacy, coupled with the initial investment costs for businesses, particularly smaller enterprises, could pose challenges to rapid adoption. Despite these hurdles, the overarching trend towards digitalization and the increasing necessity for efficient payment processing in an evolving retail landscape strongly indicate a very positive future for the QR Code Payment Speaker market. The integration of Wi-Fi and 4G functionalities addresses the need for reliable and fast transaction processing, making these devices indispensable for modern businesses.
QR Code Payment Speaker Company Market Share
Unlock the future of contactless transactions with our in-depth report on the QR Code Payment Speaker Market. This essential analysis, covering the period from 2019 to 2033 with a base year of 2025, provides critical insights for industry professionals navigating the dynamic landscape of payment technology. Discover market-defining trends, growth drivers, and strategic opportunities within the parent and child markets.
QR Code Payment Speaker Market Dynamics & Structure
The global QR Code Payment Speaker market is characterized by a dynamic interplay of technological innovation and evolving consumer behavior. Market concentration is currently moderate, with key players like JLPAY, Sanmusen, HCCTG, Boshijie Technology, Num Digit, Lakala International, PosPal, Hangzhou Firstshow Technology, Beijing Shenzhou Anfu Technology, Newland Payment Technology, Wiseasy, and PAX Technology actively competing. Technological innovation is a significant driver, with advancements in NFC integration, voice recognition for payment confirmation, and enhanced security protocols shaping product development. Regulatory frameworks, particularly those concerning data privacy and payment security standards, are increasingly influencing market entry and operational strategies. Competitive product substitutes include traditional POS terminals and purely app-based payment solutions, though the convenience and tactile feedback of QR code payment speakers offer a unique value proposition. End-user demographics are expanding beyond early adopters to include a broader range of small and medium-sized businesses seeking efficient payment solutions. Mergers and Acquisitions (M&A) trends are anticipated to increase as larger entities seek to consolidate market share and acquire innovative technologies, with an estimated XX deal volumes projected within the forecast period.
- Market Concentration: Moderate, with a growing number of specialized players.
- Technological Innovation Drivers: Enhanced security, voice integration, NFC capabilities.
- Regulatory Frameworks: Focus on data privacy (e.g., GDPR, CCPA) and payment security certifications.
- Competitive Product Substitutes: Traditional POS systems, mobile payment apps.
- End-User Demographics: Small businesses, micro-enterprises, mobile vendors.
- M&A Trends: Expected to rise for technology acquisition and market consolidation.
QR Code Payment Speaker Growth Trends & Insights
The QR Code Payment Speaker market is poised for robust expansion, driven by the accelerating global adoption of digital payments and the increasing demand for seamless, contactless transaction experiences. The market size is projected to grow significantly, moving from an estimated XX million units in the historical period to over XXX million units by 2033. Adoption rates are escalating across various sectors, fueled by the inherent simplicity and cost-effectiveness of QR code payment solutions for businesses of all sizes. Technological disruptions, such as the integration of AI for personalized marketing messages during transactions and the development of more sophisticated fraud detection mechanisms, are further enhancing the value proposition of these devices. Consumer behavior is demonstrably shifting towards mobile-first payment methods, with a growing preference for speed, convenience, and security. This shift is particularly evident in emerging economies where smartphone penetration is high and traditional banking infrastructure may be less developed. The convenience store segment, for instance, is witnessing a rapid uptake due to the high transaction volume and the need for quick checkout processes. Restaurants are benefiting from reduced order errors and improved table turnover. Mobile vendors are empowered with portable and affordable payment solutions, expanding their reach and revenue streams. Clothing stores are leveraging these devices for frictionless in-store purchases. The "Others" segment, encompassing everything from street performers to event organizers, also presents substantial, often overlooked, growth potential. The pervasive influence of WiFi and 4G/5G connectivity underpins the operational efficiency of these devices, with hybrid WIFI+4G solutions offering unparalleled reliability. The CAGR for this market is projected to be approximately XX% during the forecast period, indicating a sustained and strong growth trajectory. This market penetration is not merely about transaction processing; it's about creating a more integrated and efficient commerce ecosystem.
Dominant Regions, Countries, or Segments in QR Code Payment Speaker
The global QR Code Payment Speaker market's dominance is intricately linked to regions and countries exhibiting high mobile payment adoption, robust digital infrastructure, and supportive government initiatives. Asia Pacific, particularly China, has historically been and continues to be a frontrunner in QR code payment adoption, largely driven by super-apps like WeChat Pay and Alipay. This dominance is set to continue, fueled by the vast consumer base and the rapid evolution of payment technologies in countries like India and Southeast Asian nations. North America and Europe are experiencing accelerated growth, driven by increasing consumer demand for contactless solutions and a more mature fintech ecosystem.
Within the application segments, Convenience Stores are emerging as a significant growth driver. Their high foot traffic and the need for rapid transaction processing make QR code payment speakers an ideal solution for minimizing queues and enhancing customer satisfaction. The projected market share for this segment is expected to reach XX% by 2033. Restaurants follow closely, where these devices streamline order-and-pay processes, improve accuracy, and offer opportunities for digital menu integration. Mobile Vendors represent a rapidly expanding segment, as these portable and affordable devices empower street vendors, food trucks, and market stalls to accept digital payments, significantly increasing their revenue potential and customer base. The Clothing Store segment is also witnessing substantial adoption, facilitating faster checkout and providing opportunities for integrated loyalty programs. The "Others" segment, encompassing diverse small businesses and service providers, is also a significant contributor to market growth due to its scalability and adaptability.
In terms of product types, WIFI+4G solutions are anticipated to dominate the market. This hybrid approach offers the best of both worlds: the cost-effectiveness and ubiquitous presence of WiFi, combined with the reliability and mobility of 4G/5G networks, ensuring uninterrupted transactions in various environments. The growth potential of WIFI+4G solutions is driven by their ability to cater to both fixed locations and mobile operations, making them highly versatile.
- Dominant Region: Asia Pacific, led by China, followed by emerging markets in India and Southeast Asia.
- Leading Application Segment: Convenience Stores, driven by high transaction volumes and the need for speed.
- Key Growth Drivers in Convenience Stores: Reduced queues, improved customer experience, operational efficiency.
- Strong Contenders: Restaurants and Mobile Vendors, capitalizing on efficiency and accessibility.
- Dominant Product Type: WIFI+4G, offering a blend of connectivity and reliability.
- Market Share Projection for Convenience Stores: XX% by 2033.
QR Code Payment Speaker Product Landscape
The QR Code Payment Speaker product landscape is characterized by continuous innovation focused on enhancing user experience, security, and functionality. Modern devices often feature integrated thermal printers for receipts, high-resolution touchscreens for interactive interfaces, and robust payment security modules compliant with industry standards. Unique selling propositions include built-in speakers that provide audio confirmation of transactions, reducing errors and enhancing customer confidence. Advanced models are incorporating NFC capabilities for contactless card payments alongside QR code scanning, offering a more comprehensive payment acceptance solution. Furthermore, integration with cloud-based POS systems and inventory management software is becoming a standard feature, enabling businesses to manage their operations more effectively through a single platform. The technological advancements prioritize durability, battery life for mobile vendors, and a user-friendly interface for both merchants and customers, solidifying their position as an indispensable tool in modern commerce.
Key Drivers, Barriers & Challenges in QR Code Payment Speaker
Key Drivers:
The primary forces propelling the QR Code Payment Speaker market are the pervasive global shift towards digital payments, fueled by government initiatives promoting financial inclusion and cashless economies. Technological advancements in payment processing and connectivity, coupled with the growing demand for contactless and convenient transaction methods from consumers, are major catalysts. The cost-effectiveness and ease of deployment for small and medium-sized businesses, especially in emerging markets, further drive adoption.
- Digital Payment Adoption: Increasing consumer preference for cashless transactions.
- Technological Advancements: Improved security, faster processing, and enhanced connectivity.
- Cost-Effectiveness for SMEs: Affordable and accessible payment solutions.
- Government Initiatives: Policies promoting cashless societies and financial inclusion.
Barriers & Challenges:
Despite the strong growth trajectory, the market faces several barriers and challenges. The reliance on stable internet connectivity can be a constraint in certain regions, impacting the reliability of payment processing. Evolving cybersecurity threats and the need for continuous security updates pose a significant challenge, requiring substantial investment in R&D. Intense competition from existing payment providers and the potential for rapid technological obsolescence necessitate constant innovation and adaptation. Furthermore, varying regulatory landscapes across different countries can create compliance hurdles for manufacturers and service providers. Supply chain disruptions, as experienced in recent years, can also impact production and availability, leading to potential cost increases and delays. The estimated impact of supply chain issues on market growth is approximately XX%.
- Connectivity Dependence: Reliance on stable internet for seamless operation.
- Cybersecurity Threats: Evolving threats require continuous security upgrades.
- Intense Competition: Pressure from established payment providers.
- Regulatory Variations: Navigating diverse legal frameworks across regions.
- Supply Chain Disruptions: Potential for production delays and cost escalations.
Emerging Opportunities in QR Code Payment Speaker
Emerging opportunities in the QR Code Payment Speaker sector lie in the integration of advanced analytics and personalization capabilities. Devices can leverage transaction data to offer targeted marketing messages and loyalty programs directly at the point of sale, enhancing customer engagement and driving repeat business. The expansion into emerging markets with a large unbanked population presents a significant untapped potential, as these devices provide an accessible entry point into the digital economy. Furthermore, the development of specialized solutions for niche industries, such as event ticketing, public transportation fare collection, and vending machines, offers avenues for market diversification and specialized revenue streams. The increasing adoption of IoT devices also opens doors for seamless integration and data sharing, creating a more connected commerce ecosystem.
Growth Accelerators in the QR Code Payment Speaker Industry
The long-term growth of the QR Code Payment Speaker industry will be significantly accelerated by continuous technological breakthroughs, particularly in areas like biometric authentication for enhanced security and AI-driven fraud detection. Strategic partnerships between hardware manufacturers, software developers, and financial institutions will be crucial for creating integrated payment ecosystems and expanding service offerings. Market expansion strategies focusing on underserved regions and the development of localized payment solutions will unlock new customer bases. The increasing demand for omnichannel retail experiences will also drive the adoption of these devices as they bridge the gap between online and offline transactions, providing a unified customer journey.
Key Players Shaping the QR Code Payment Speaker Market
- JLPAY
- Sanmusen
- HCCTG
- Boshijie Technology
- Num Digit
- Lakala International
- PosPal
- Hangzhou Firstshow Technology
- Beijing Shenzhou Anfu Technology
- Newland Payment Technology
- Wiseasy
- PAX Technology
Notable Milestones in QR Code Payment Speaker Sector
- 2019: Increased adoption of contactless payments post-pandemic accelerated R&D in voice-enabled payment devices.
- 2020: Introduction of enhanced security protocols and encryption standards for QR code transactions.
- 2021: Expansion of WiFi+4G integrated solutions to cater to diverse connectivity needs.
- 2022: Growing integration with mobile POS systems and inventory management software.
- 2023: Focus on AI-driven fraud detection and personalized customer engagement features.
- 2024: Significant growth in adoption by mobile vendors and small businesses globally.
In-Depth QR Code Payment Speaker Market Outlook
The future of the QR Code Payment Speaker market is exceptionally promising, fueled by sustained growth accelerators such as technological breakthroughs in AI and biometrics, and strategic partnerships forming integrated payment ecosystems. The relentless push towards digital and contactless transactions, coupled with the expansion into previously underserved markets, will continue to propel market growth. The increasing demand for unified commerce solutions, bridging online and offline experiences, positions these devices as central to the future of retail and services. Businesses can anticipate further innovation leading to more secure, efficient, and customer-centric payment experiences, unlocking substantial opportunities for revenue growth and market leadership.
QR Code Payment Speaker Segmentation
-
1. Application
- 1.1. Convenience Stores
- 1.2. Restaurants
- 1.3. Mobile Vendors
- 1.4. Clothing Store
- 1.5. Others
-
2. Types
- 2.1. WIFI
- 2.2. 4G
- 2.3. WIFI+4G
QR Code Payment Speaker Segmentation By Geography
-
1. North America
- 1.1. United States
- 1.2. Canada
- 1.3. Mexico
-
2. South America
- 2.1. Brazil
- 2.2. Argentina
- 2.3. Rest of South America
-
3. Europe
- 3.1. United Kingdom
- 3.2. Germany
- 3.3. France
- 3.4. Italy
- 3.5. Spain
- 3.6. Russia
- 3.7. Benelux
- 3.8. Nordics
- 3.9. Rest of Europe
-
4. Middle East & Africa
- 4.1. Turkey
- 4.2. Israel
- 4.3. GCC
- 4.4. North Africa
- 4.5. South Africa
- 4.6. Rest of Middle East & Africa
-
5. Asia Pacific
- 5.1. China
- 5.2. India
- 5.3. Japan
- 5.4. South Korea
- 5.5. ASEAN
- 5.6. Oceania
- 5.7. Rest of Asia Pacific
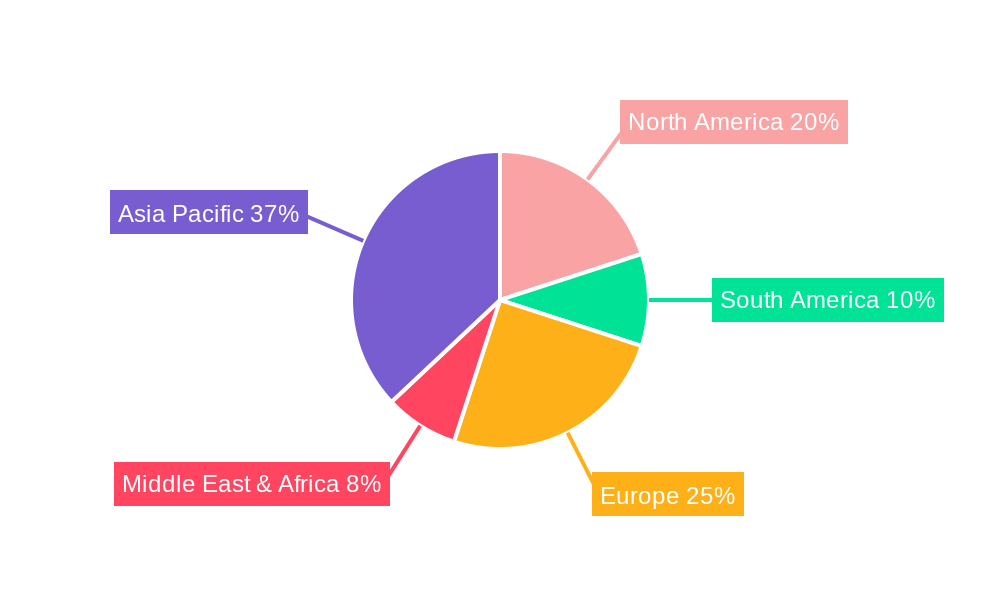
QR Code Payment Speaker Regional Market Share
Geographic Coverage of QR Code Payment Speaker
QR Code Payment Speaker REPORT HIGHLIGHTS
| Aspects | Details |
|---|---|
| Study Period | 2020-2034 |
| Base Year | 2025 |
| Estimated Year | 2026 |
| Forecast Period | 2026-2034 |
| Historical Period | 2020-2025 |
| Growth Rate | CAGR of 18.7% from 2020-2034 |
| Segmentation |
|
Table of Contents
- 1. Introduction
- 1.1. Research Scope
- 1.2. Market Segmentation
- 1.3. Research Objective
- 1.4. Definitions and Assumptions
- 2. Executive Summary
- 2.1. Market Snapshot
- 3. Market Dynamics
- 3.1. Market Drivers
- 3.2. Market Restrains
- 3.3. Market Trends
- 3.4. Market Opportunities
- 4. Market Factor Analysis
- 4.1. Porters Five Forces
- 4.1.1. Bargaining Power of Suppliers
- 4.1.2. Bargaining Power of Buyers
- 4.1.3. Threat of New Entrants
- 4.1.4. Threat of Substitutes
- 4.1.5. Competitive Rivalry
- 4.2. PESTEL analysis
- 4.3. BCG Analysis
- 4.3.1. Stars (High Growth, High Market Share)
- 4.3.2. Cash Cows (Low Growth, High Market Share)
- 4.3.3. Question Mark (High Growth, Low Market Share)
- 4.3.4. Dogs (Low Growth, Low Market Share)
- 4.4. Ansoff Matrix Analysis
- 4.5. Supply Chain Analysis
- 4.6. Regulatory Landscape
- 4.7. Current Market Potential and Opportunity Assessment (TAM–SAM–SOM Framework)
- 4.8. VDR Analyst Note
- 4.1. Porters Five Forces
- 5. Market Analysis, Insights and Forecast 2021-2033
- 5.1. Market Analysis, Insights and Forecast - by Application
- 5.1.1. Convenience Stores
- 5.1.2. Restaurants
- 5.1.3. Mobile Vendors
- 5.1.4. Clothing Store
- 5.1.5. Others
- 5.2. Market Analysis, Insights and Forecast - by Types
- 5.2.1. WIFI
- 5.2.2. 4G
- 5.2.3. WIFI+4G
- 5.3. Market Analysis, Insights and Forecast - by Region
- 5.3.1. North America
- 5.3.2. South America
- 5.3.3. Europe
- 5.3.4. Middle East & Africa
- 5.3.5. Asia Pacific
- 5.1. Market Analysis, Insights and Forecast - by Application
- 6. Global QR Code Payment Speaker Analysis, Insights and Forecast, 2021-2033
- 6.1. Market Analysis, Insights and Forecast - by Application
- 6.1.1. Convenience Stores
- 6.1.2. Restaurants
- 6.1.3. Mobile Vendors
- 6.1.4. Clothing Store
- 6.1.5. Others
- 6.2. Market Analysis, Insights and Forecast - by Types
- 6.2.1. WIFI
- 6.2.2. 4G
- 6.2.3. WIFI+4G
- 6.1. Market Analysis, Insights and Forecast - by Application
- 7. North America QR Code Payment Speaker Analysis, Insights and Forecast, 2021-2033
- 7.1. Market Analysis, Insights and Forecast - by Application
- 7.1.1. Convenience Stores
- 7.1.2. Restaurants
- 7.1.3. Mobile Vendors
- 7.1.4. Clothing Store
- 7.1.5. Others
- 7.2. Market Analysis, Insights and Forecast - by Types
- 7.2.1. WIFI
- 7.2.2. 4G
- 7.2.3. WIFI+4G
- 7.1. Market Analysis, Insights and Forecast - by Application
- 8. South America QR Code Payment Speaker Analysis, Insights and Forecast, 2021-2033
- 8.1. Market Analysis, Insights and Forecast - by Application
- 8.1.1. Convenience Stores
- 8.1.2. Restaurants
- 8.1.3. Mobile Vendors
- 8.1.4. Clothing Store
- 8.1.5. Others
- 8.2. Market Analysis, Insights and Forecast - by Types
- 8.2.1. WIFI
- 8.2.2. 4G
- 8.2.3. WIFI+4G
- 8.1. Market Analysis, Insights and Forecast - by Application
- 9. Europe QR Code Payment Speaker Analysis, Insights and Forecast, 2021-2033
- 9.1. Market Analysis, Insights and Forecast - by Application
- 9.1.1. Convenience Stores
- 9.1.2. Restaurants
- 9.1.3. Mobile Vendors
- 9.1.4. Clothing Store
- 9.1.5. Others
- 9.2. Market Analysis, Insights and Forecast - by Types
- 9.2.1. WIFI
- 9.2.2. 4G
- 9.2.3. WIFI+4G
- 9.1. Market Analysis, Insights and Forecast - by Application
- 10. Middle East & Africa QR Code Payment Speaker Analysis, Insights and Forecast, 2021-2033
- 10.1. Market Analysis, Insights and Forecast - by Application
- 10.1.1. Convenience Stores
- 10.1.2. Restaurants
- 10.1.3. Mobile Vendors
- 10.1.4. Clothing Store
- 10.1.5. Others
- 10.2. Market Analysis, Insights and Forecast - by Types
- 10.2.1. WIFI
- 10.2.2. 4G
- 10.2.3. WIFI+4G
- 10.1. Market Analysis, Insights and Forecast - by Application
- 11. Asia Pacific QR Code Payment Speaker Analysis, Insights and Forecast, 2021-2033
- 11.1. Market Analysis, Insights and Forecast - by Application
- 11.1.1. Convenience Stores
- 11.1.2. Restaurants
- 11.1.3. Mobile Vendors
- 11.1.4. Clothing Store
- 11.1.5. Others
- 11.2. Market Analysis, Insights and Forecast - by Types
- 11.2.1. WIFI
- 11.2.2. 4G
- 11.2.3. WIFI+4G
- 11.1. Market Analysis, Insights and Forecast - by Application
- 12. Competitive Analysis
- 12.1. Company Profiles
- 12.1.1 JLPAY
- 12.1.1.1. Company Overview
- 12.1.1.2. Products
- 12.1.1.3. Company Financials
- 12.1.1.4. SWOT Analysis
- 12.1.2 Sanmusen
- 12.1.2.1. Company Overview
- 12.1.2.2. Products
- 12.1.2.3. Company Financials
- 12.1.2.4. SWOT Analysis
- 12.1.3 HCCTG
- 12.1.3.1. Company Overview
- 12.1.3.2. Products
- 12.1.3.3. Company Financials
- 12.1.3.4. SWOT Analysis
- 12.1.4 Boshijie Technology
- 12.1.4.1. Company Overview
- 12.1.4.2. Products
- 12.1.4.3. Company Financials
- 12.1.4.4. SWOT Analysis
- 12.1.5 Num Digit
- 12.1.5.1. Company Overview
- 12.1.5.2. Products
- 12.1.5.3. Company Financials
- 12.1.5.4. SWOT Analysis
- 12.1.6 Lakala International
- 12.1.6.1. Company Overview
- 12.1.6.2. Products
- 12.1.6.3. Company Financials
- 12.1.6.4. SWOT Analysis
- 12.1.7 PosPal
- 12.1.7.1. Company Overview
- 12.1.7.2. Products
- 12.1.7.3. Company Financials
- 12.1.7.4. SWOT Analysis
- 12.1.8 Hangzhou Firstshow Technology
- 12.1.8.1. Company Overview
- 12.1.8.2. Products
- 12.1.8.3. Company Financials
- 12.1.8.4. SWOT Analysis
- 12.1.9 Beijing Shenzhou Anfu Technology
- 12.1.9.1. Company Overview
- 12.1.9.2. Products
- 12.1.9.3. Company Financials
- 12.1.9.4. SWOT Analysis
- 12.1.10 Newland Payment Technology
- 12.1.10.1. Company Overview
- 12.1.10.2. Products
- 12.1.10.3. Company Financials
- 12.1.10.4. SWOT Analysis
- 12.1.11 Wiseasy
- 12.1.11.1. Company Overview
- 12.1.11.2. Products
- 12.1.11.3. Company Financials
- 12.1.11.4. SWOT Analysis
- 12.1.12 PAX Technology
- 12.1.12.1. Company Overview
- 12.1.12.2. Products
- 12.1.12.3. Company Financials
- 12.1.12.4. SWOT Analysis
- 12.1.1 JLPAY
- 12.2. Market Entropy
- 12.2.1 Company's Key Areas Served
- 12.2.2 Recent Developments
- 12.3. Company Market Share Analysis 2025
- 12.3.1 Top 5 Companies Market Share Analysis
- 12.3.2 Top 3 Companies Market Share Analysis
- 12.4. List of Potential Customers
- 13. Research Methodology
List of Figures
- Figure 1: Global QR Code Payment Speaker Revenue Breakdown (billion, %) by Region 2025 & 2033
- Figure 2: Global QR Code Payment Speaker Volume Breakdown (K, %) by Region 2025 & 2033
- Figure 3: North America QR Code Payment Speaker Revenue (billion), by Application 2025 & 2033
- Figure 4: North America QR Code Payment Speaker Volume (K), by Application 2025 & 2033
- Figure 5: North America QR Code Payment Speaker Revenue Share (%), by Application 2025 & 2033
- Figure 6: North America QR Code Payment Speaker Volume Share (%), by Application 2025 & 2033
- Figure 7: North America QR Code Payment Speaker Revenue (billion), by Types 2025 & 2033
- Figure 8: North America QR Code Payment Speaker Volume (K), by Types 2025 & 2033
- Figure 9: North America QR Code Payment Speaker Revenue Share (%), by Types 2025 & 2033
- Figure 10: North America QR Code Payment Speaker Volume Share (%), by Types 2025 & 2033
- Figure 11: North America QR Code Payment Speaker Revenue (billion), by Country 2025 & 2033
- Figure 12: North America QR Code Payment Speaker Volume (K), by Country 2025 & 2033
- Figure 13: North America QR Code Payment Speaker Revenue Share (%), by Country 2025 & 2033
- Figure 14: North America QR Code Payment Speaker Volume Share (%), by Country 2025 & 2033
- Figure 15: South America QR Code Payment Speaker Revenue (billion), by Application 2025 & 2033
- Figure 16: South America QR Code Payment Speaker Volume (K), by Application 2025 & 2033
- Figure 17: South America QR Code Payment Speaker Revenue Share (%), by Application 2025 & 2033
- Figure 18: South America QR Code Payment Speaker Volume Share (%), by Application 2025 & 2033
- Figure 19: South America QR Code Payment Speaker Revenue (billion), by Types 2025 & 2033
- Figure 20: South America QR Code Payment Speaker Volume (K), by Types 2025 & 2033
- Figure 21: South America QR Code Payment Speaker Revenue Share (%), by Types 2025 & 2033
- Figure 22: South America QR Code Payment Speaker Volume Share (%), by Types 2025 & 2033
- Figure 23: South America QR Code Payment Speaker Revenue (billion), by Country 2025 & 2033
- Figure 24: South America QR Code Payment Speaker Volume (K), by Country 2025 & 2033
- Figure 25: South America QR Code Payment Speaker Revenue Share (%), by Country 2025 & 2033
- Figure 26: South America QR Code Payment Speaker Volume Share (%), by Country 2025 & 2033
- Figure 27: Europe QR Code Payment Speaker Revenue (billion), by Application 2025 & 2033
- Figure 28: Europe QR Code Payment Speaker Volume (K), by Application 2025 & 2033
- Figure 29: Europe QR Code Payment Speaker Revenue Share (%), by Application 2025 & 2033
- Figure 30: Europe QR Code Payment Speaker Volume Share (%), by Application 2025 & 2033
- Figure 31: Europe QR Code Payment Speaker Revenue (billion), by Types 2025 & 2033
- Figure 32: Europe QR Code Payment Speaker Volume (K), by Types 2025 & 2033
- Figure 33: Europe QR Code Payment Speaker Revenue Share (%), by Types 2025 & 2033
- Figure 34: Europe QR Code Payment Speaker Volume Share (%), by Types 2025 & 2033
- Figure 35: Europe QR Code Payment Speaker Revenue (billion), by Country 2025 & 2033
- Figure 36: Europe QR Code Payment Speaker Volume (K), by Country 2025 & 2033
- Figure 37: Europe QR Code Payment Speaker Revenue Share (%), by Country 2025 & 2033
- Figure 38: Europe QR Code Payment Speaker Volume Share (%), by Country 2025 & 2033
- Figure 39: Middle East & Africa QR Code Payment Speaker Revenue (billion), by Application 2025 & 2033
- Figure 40: Middle East & Africa QR Code Payment Speaker Volume (K), by Application 2025 & 2033
- Figure 41: Middle East & Africa QR Code Payment Speaker Revenue Share (%), by Application 2025 & 2033
- Figure 42: Middle East & Africa QR Code Payment Speaker Volume Share (%), by Application 2025 & 2033
- Figure 43: Middle East & Africa QR Code Payment Speaker Revenue (billion), by Types 2025 & 2033
- Figure 44: Middle East & Africa QR Code Payment Speaker Volume (K), by Types 2025 & 2033
- Figure 45: Middle East & Africa QR Code Payment Speaker Revenue Share (%), by Types 2025 & 2033
- Figure 46: Middle East & Africa QR Code Payment Speaker Volume Share (%), by Types 2025 & 2033
- Figure 47: Middle East & Africa QR Code Payment Speaker Revenue (billion), by Country 2025 & 2033
- Figure 48: Middle East & Africa QR Code Payment Speaker Volume (K), by Country 2025 & 2033
- Figure 49: Middle East & Africa QR Code Payment Speaker Revenue Share (%), by Country 2025 & 2033
- Figure 50: Middle East & Africa QR Code Payment Speaker Volume Share (%), by Country 2025 & 2033
- Figure 51: Asia Pacific QR Code Payment Speaker Revenue (billion), by Application 2025 & 2033
- Figure 52: Asia Pacific QR Code Payment Speaker Volume (K), by Application 2025 & 2033
- Figure 53: Asia Pacific QR Code Payment Speaker Revenue Share (%), by Application 2025 & 2033
- Figure 54: Asia Pacific QR Code Payment Speaker Volume Share (%), by Application 2025 & 2033
- Figure 55: Asia Pacific QR Code Payment Speaker Revenue (billion), by Types 2025 & 2033
- Figure 56: Asia Pacific QR Code Payment Speaker Volume (K), by Types 2025 & 2033
- Figure 57: Asia Pacific QR Code Payment Speaker Revenue Share (%), by Types 2025 & 2033
- Figure 58: Asia Pacific QR Code Payment Speaker Volume Share (%), by Types 2025 & 2033
- Figure 59: Asia Pacific QR Code Payment Speaker Revenue (billion), by Country 2025 & 2033
- Figure 60: Asia Pacific QR Code Payment Speaker Volume (K), by Country 2025 & 2033
- Figure 61: Asia Pacific QR Code Payment Speaker Revenue Share (%), by Country 2025 & 2033
- Figure 62: Asia Pacific QR Code Payment Speaker Volume Share (%), by Country 2025 & 2033
List of Tables
- Table 1: Global QR Code Payment Speaker Revenue billion Forecast, by Application 2020 & 2033
- Table 2: Global QR Code Payment Speaker Volume K Forecast, by Application 2020 & 2033
- Table 3: Global QR Code Payment Speaker Revenue billion Forecast, by Types 2020 & 2033
- Table 4: Global QR Code Payment Speaker Volume K Forecast, by Types 2020 & 2033
- Table 5: Global QR Code Payment Speaker Revenue billion Forecast, by Region 2020 & 2033
- Table 6: Global QR Code Payment Speaker Volume K Forecast, by Region 2020 & 2033
- Table 7: Global QR Code Payment Speaker Revenue billion Forecast, by Application 2020 & 2033
- Table 8: Global QR Code Payment Speaker Volume K Forecast, by Application 2020 & 2033
- Table 9: Global QR Code Payment Speaker Revenue billion Forecast, by Types 2020 & 2033
- Table 10: Global QR Code Payment Speaker Volume K Forecast, by Types 2020 & 2033
- Table 11: Global QR Code Payment Speaker Revenue billion Forecast, by Country 2020 & 2033
- Table 12: Global QR Code Payment Speaker Volume K Forecast, by Country 2020 & 2033
- Table 13: United States QR Code Payment Speaker Revenue (billion) Forecast, by Application 2020 & 2033
- Table 14: United States QR Code Payment Speaker Volume (K) Forecast, by Application 2020 & 2033
- Table 15: Canada QR Code Payment Speaker Revenue (billion) Forecast, by Application 2020 & 2033
- Table 16: Canada QR Code Payment Speaker Volume (K) Forecast, by Application 2020 & 2033
- Table 17: Mexico QR Code Payment Speaker Revenue (billion) Forecast, by Application 2020 & 2033
- Table 18: Mexico QR Code Payment Speaker Volume (K) Forecast, by Application 2020 & 2033
- Table 19: Global QR Code Payment Speaker Revenue billion Forecast, by Application 2020 & 2033
- Table 20: Global QR Code Payment Speaker Volume K Forecast, by Application 2020 & 2033
- Table 21: Global QR Code Payment Speaker Revenue billion Forecast, by Types 2020 & 2033
- Table 22: Global QR Code Payment Speaker Volume K Forecast, by Types 2020 & 2033
- Table 23: Global QR Code Payment Speaker Revenue billion Forecast, by Country 2020 & 2033
- Table 24: Global QR Code Payment Speaker Volume K Forecast, by Country 2020 & 2033
- Table 25: Brazil QR Code Payment Speaker Revenue (billion) Forecast, by Application 2020 & 2033
- Table 26: Brazil QR Code Payment Speaker Volume (K) Forecast, by Application 2020 & 2033
- Table 27: Argentina QR Code Payment Speaker Revenue (billion) Forecast, by Application 2020 & 2033
- Table 28: Argentina QR Code Payment Speaker Volume (K) Forecast, by Application 2020 & 2033
- Table 29: Rest of South America QR Code Payment Speaker Revenue (billion) Forecast, by Application 2020 & 2033
- Table 30: Rest of South America QR Code Payment Speaker Volume (K) Forecast, by Application 2020 & 2033
- Table 31: Global QR Code Payment Speaker Revenue billion Forecast, by Application 2020 & 2033
- Table 32: Global QR Code Payment Speaker Volume K Forecast, by Application 2020 & 2033
- Table 33: Global QR Code Payment Speaker Revenue billion Forecast, by Types 2020 & 2033
- Table 34: Global QR Code Payment Speaker Volume K Forecast, by Types 2020 & 2033
- Table 35: Global QR Code Payment Speaker Revenue billion Forecast, by Country 2020 & 2033
- Table 36: Global QR Code Payment Speaker Volume K Forecast, by Country 2020 & 2033
- Table 37: United Kingdom QR Code Payment Speaker Revenue (billion) Forecast, by Application 2020 & 2033
- Table 38: United Kingdom QR Code Payment Speaker Volume (K) Forecast, by Application 2020 & 2033
- Table 39: Germany QR Code Payment Speaker Revenue (billion) Forecast, by Application 2020 & 2033
- Table 40: Germany QR Code Payment Speaker Volume (K) Forecast, by Application 2020 & 2033
- Table 41: France QR Code Payment Speaker Revenue (billion) Forecast, by Application 2020 & 2033
- Table 42: France QR Code Payment Speaker Volume (K) Forecast, by Application 2020 & 2033
- Table 43: Italy QR Code Payment Speaker Revenue (billion) Forecast, by Application 2020 & 2033
- Table 44: Italy QR Code Payment Speaker Volume (K) Forecast, by Application 2020 & 2033
- Table 45: Spain QR Code Payment Speaker Revenue (billion) Forecast, by Application 2020 & 2033
- Table 46: Spain QR Code Payment Speaker Volume (K) Forecast, by Application 2020 & 2033
- Table 47: Russia QR Code Payment Speaker Revenue (billion) Forecast, by Application 2020 & 2033
- Table 48: Russia QR Code Payment Speaker Volume (K) Forecast, by Application 2020 & 2033
- Table 49: Benelux QR Code Payment Speaker Revenue (billion) Forecast, by Application 2020 & 2033
- Table 50: Benelux QR Code Payment Speaker Volume (K) Forecast, by Application 2020 & 2033
- Table 51: Nordics QR Code Payment Speaker Revenue (billion) Forecast, by Application 2020 & 2033
- Table 52: Nordics QR Code Payment Speaker Volume (K) Forecast, by Application 2020 & 2033
- Table 53: Rest of Europe QR Code Payment Speaker Revenue (billion) Forecast, by Application 2020 & 2033
- Table 54: Rest of Europe QR Code Payment Speaker Volume (K) Forecast, by Application 2020 & 2033
- Table 55: Global QR Code Payment Speaker Revenue billion Forecast, by Application 2020 & 2033
- Table 56: Global QR Code Payment Speaker Volume K Forecast, by Application 2020 & 2033
- Table 57: Global QR Code Payment Speaker Revenue billion Forecast, by Types 2020 & 2033
- Table 58: Global QR Code Payment Speaker Volume K Forecast, by Types 2020 & 2033
- Table 59: Global QR Code Payment Speaker Revenue billion Forecast, by Country 2020 & 2033
- Table 60: Global QR Code Payment Speaker Volume K Forecast, by Country 2020 & 2033
- Table 61: Turkey QR Code Payment Speaker Revenue (billion) Forecast, by Application 2020 & 2033
- Table 62: Turkey QR Code Payment Speaker Volume (K) Forecast, by Application 2020 & 2033
- Table 63: Israel QR Code Payment Speaker Revenue (billion) Forecast, by Application 2020 & 2033
- Table 64: Israel QR Code Payment Speaker Volume (K) Forecast, by Application 2020 & 2033
- Table 65: GCC QR Code Payment Speaker Revenue (billion) Forecast, by Application 2020 & 2033
- Table 66: GCC QR Code Payment Speaker Volume (K) Forecast, by Application 2020 & 2033
- Table 67: North Africa QR Code Payment Speaker Revenue (billion) Forecast, by Application 2020 & 2033
- Table 68: North Africa QR Code Payment Speaker Volume (K) Forecast, by Application 2020 & 2033
- Table 69: South Africa QR Code Payment Speaker Revenue (billion) Forecast, by Application 2020 & 2033
- Table 70: South Africa QR Code Payment Speaker Volume (K) Forecast, by Application 2020 & 2033
- Table 71: Rest of Middle East & Africa QR Code Payment Speaker Revenue (billion) Forecast, by Application 2020 & 2033
- Table 72: Rest of Middle East & Africa QR Code Payment Speaker Volume (K) Forecast, by Application 2020 & 2033
- Table 73: Global QR Code Payment Speaker Revenue billion Forecast, by Application 2020 & 2033
- Table 74: Global QR Code Payment Speaker Volume K Forecast, by Application 2020 & 2033
- Table 75: Global QR Code Payment Speaker Revenue billion Forecast, by Types 2020 & 2033
- Table 76: Global QR Code Payment Speaker Volume K Forecast, by Types 2020 & 2033
- Table 77: Global QR Code Payment Speaker Revenue billion Forecast, by Country 2020 & 2033
- Table 78: Global QR Code Payment Speaker Volume K Forecast, by Country 2020 & 2033
- Table 79: China QR Code Payment Speaker Revenue (billion) Forecast, by Application 2020 & 2033
- Table 80: China QR Code Payment Speaker Volume (K) Forecast, by Application 2020 & 2033
- Table 81: India QR Code Payment Speaker Revenue (billion) Forecast, by Application 2020 & 2033
- Table 82: India QR Code Payment Speaker Volume (K) Forecast, by Application 2020 & 2033
- Table 83: Japan QR Code Payment Speaker Revenue (billion) Forecast, by Application 2020 & 2033
- Table 84: Japan QR Code Payment Speaker Volume (K) Forecast, by Application 2020 & 2033
- Table 85: South Korea QR Code Payment Speaker Revenue (billion) Forecast, by Application 2020 & 2033
- Table 86: South Korea QR Code Payment Speaker Volume (K) Forecast, by Application 2020 & 2033
- Table 87: ASEAN QR Code Payment Speaker Revenue (billion) Forecast, by Application 2020 & 2033
- Table 88: ASEAN QR Code Payment Speaker Volume (K) Forecast, by Application 2020 & 2033
- Table 89: Oceania QR Code Payment Speaker Revenue (billion) Forecast, by Application 2020 & 2033
- Table 90: Oceania QR Code Payment Speaker Volume (K) Forecast, by Application 2020 & 2033
- Table 91: Rest of Asia Pacific QR Code Payment Speaker Revenue (billion) Forecast, by Application 2020 & 2033
- Table 92: Rest of Asia Pacific QR Code Payment Speaker Volume (K) Forecast, by Application 2020 & 2033
Frequently Asked Questions
1. What is the projected Compound Annual Growth Rate (CAGR) of the QR Code Payment Speaker?
The projected CAGR is approximately 18.7%.
2. Which companies are prominent players in the QR Code Payment Speaker?
Key companies in the market include JLPAY, Sanmusen, HCCTG, Boshijie Technology, Num Digit, Lakala International, PosPal, Hangzhou Firstshow Technology, Beijing Shenzhou Anfu Technology, Newland Payment Technology, Wiseasy, PAX Technology.
3. What are the main segments of the QR Code Payment Speaker?
The market segments include Application, Types.
4. Can you provide details about the market size?
The market size is estimated to be USD 12.2 billion as of 2022.
5. What are some drivers contributing to market growth?
N/A
6. What are the notable trends driving market growth?
N/A
7. Are there any restraints impacting market growth?
N/A
8. Can you provide examples of recent developments in the market?
N/A
9. What pricing options are available for accessing the report?
Pricing options include single-user, multi-user, and enterprise licenses priced at USD 4350.00, USD 6525.00, and USD 8700.00 respectively.
10. Is the market size provided in terms of value or volume?
The market size is provided in terms of value, measured in billion and volume, measured in K.
11. Are there any specific market keywords associated with the report?
Yes, the market keyword associated with the report is "QR Code Payment Speaker," which aids in identifying and referencing the specific market segment covered.
12. How do I determine which pricing option suits my needs best?
The pricing options vary based on user requirements and access needs. Individual users may opt for single-user licenses, while businesses requiring broader access may choose multi-user or enterprise licenses for cost-effective access to the report.
13. Are there any additional resources or data provided in the QR Code Payment Speaker report?
While the report offers comprehensive insights, it's advisable to review the specific contents or supplementary materials provided to ascertain if additional resources or data are available.
14. How can I stay updated on further developments or reports in the QR Code Payment Speaker?
To stay informed about further developments, trends, and reports in the QR Code Payment Speaker, consider subscribing to industry newsletters, following relevant companies and organizations, or regularly checking reputable industry news sources and publications.
Methodology
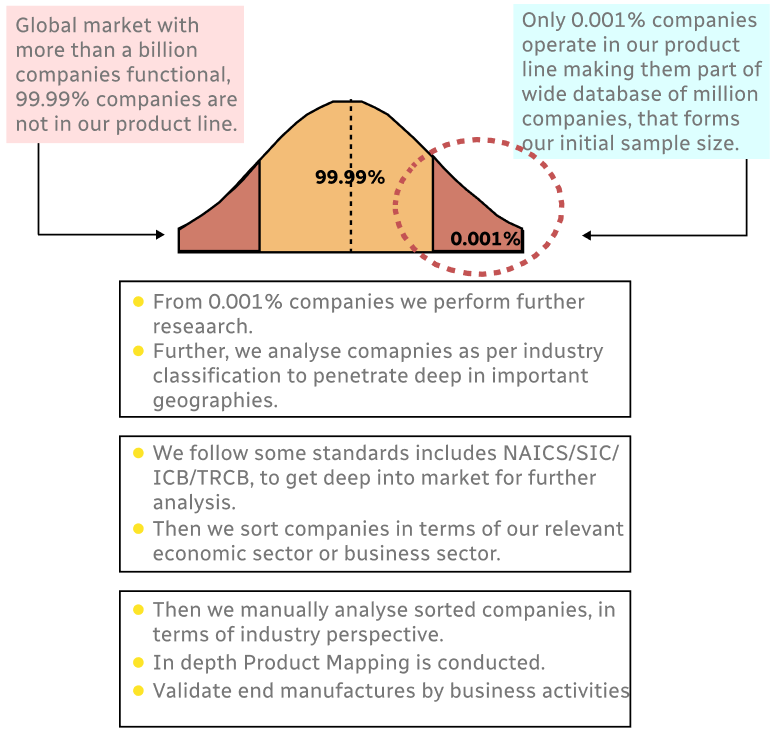
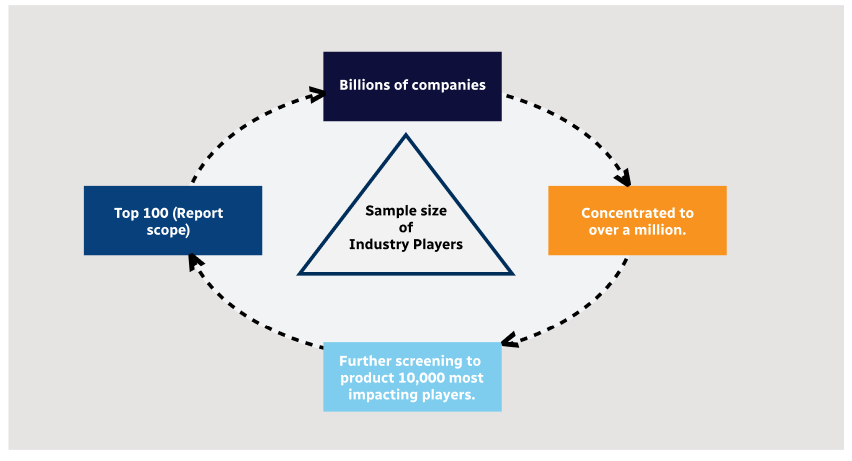
Step 1 - Identification of Relevant Samples Size from Population Database
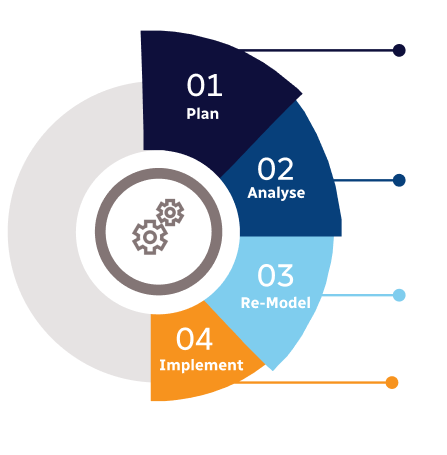
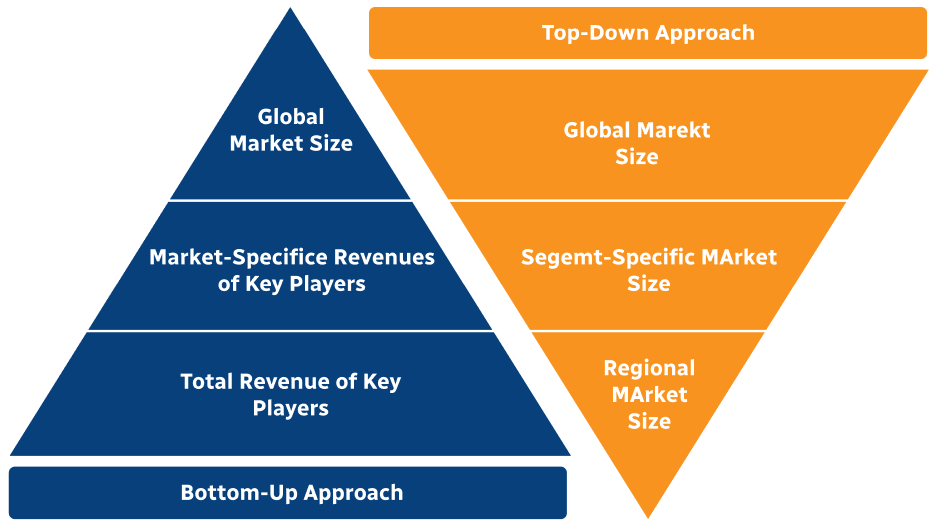
Step 2 - Approaches for Defining Global Market Size (Value, Volume* & Price*)
Note*: In applicable scenarios
Step 3 - Data Sources
Primary Research
- Web Analytics
- Survey Reports
- Research Institute
- Latest Research Reports
- Opinion Leaders
Secondary Research
- Annual Reports
- White Paper
- Latest Press Release
- Industry Association
- Paid Database
- Investor Presentations
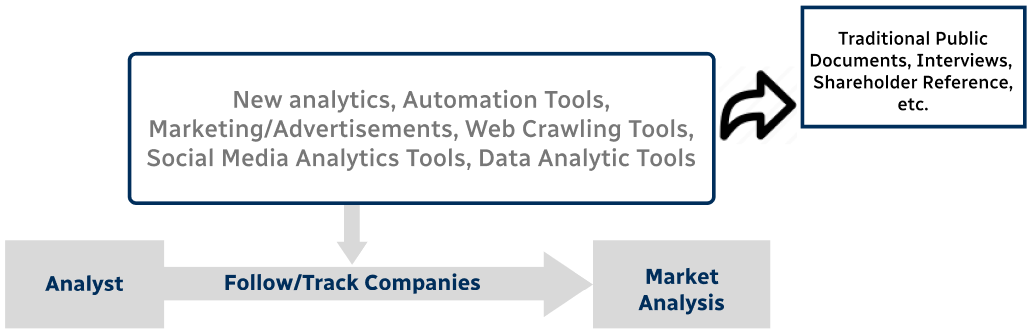
Step 4 - Data Triangulation
Involves using different sources of information in order to increase the validity of a study
These sources are likely to be stakeholders in a program - participants, other researchers, program staff, other community members, and so on.
Then we put all data in single framework & apply various statistical tools to find out the dynamic on the market.
During the analysis stage, feedback from the stakeholder groups would be compared to determine areas of agreement as well as areas of divergence