
Key Insights
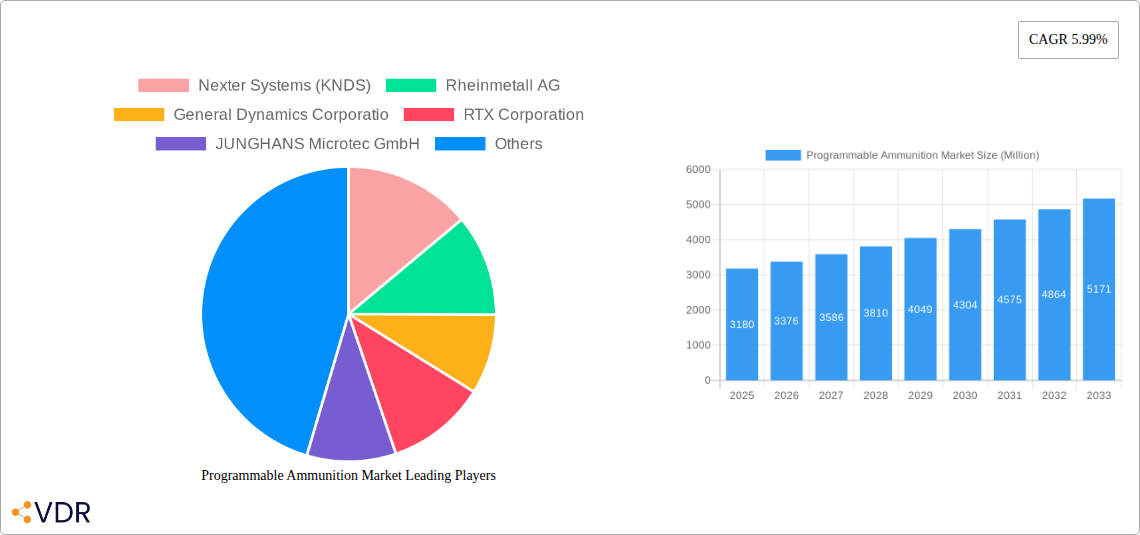
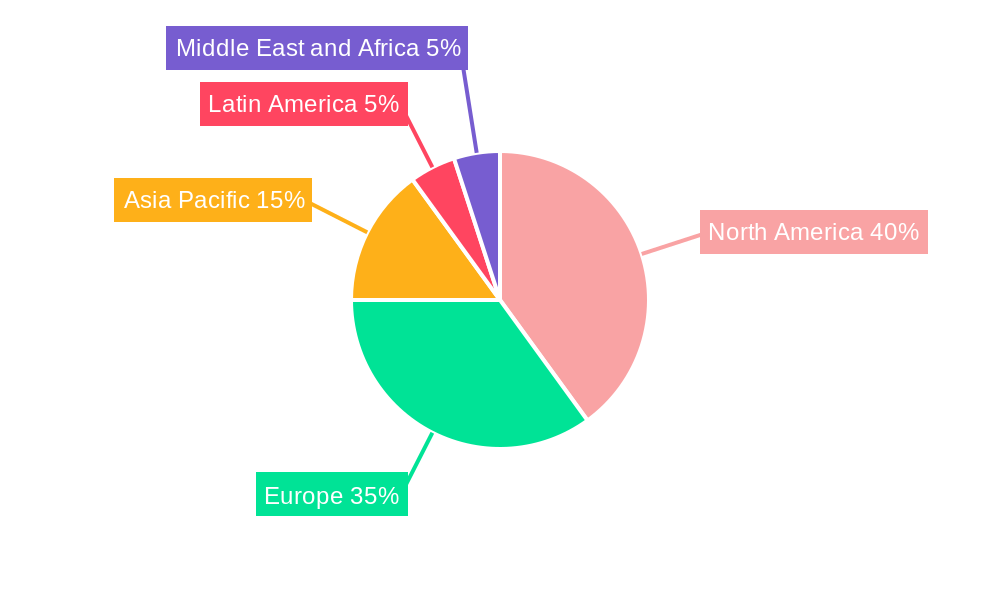
The programmable ammunition market, valued at $3.18 billion in 2025, is projected to experience robust growth, driven by a Compound Annual Growth Rate (CAGR) of 5.99% from 2025 to 2033. This expansion is fueled by several key factors. Firstly, increasing demand for precision-guided munitions in modern warfare necessitates the development of sophisticated programmable ammunition capable of engaging targets with greater accuracy and minimizing collateral damage. Secondly, advancements in microelectronics and sensor technologies are enabling the integration of more complex programmable functionalities, such as target recognition and self-destruct mechanisms, enhancing the effectiveness and safety of these munitions. Furthermore, the growing adoption of network-centric warfare strategies necessitates ammunition that can be remotely controlled and coordinated with other assets, driving demand for remote wireless programmable ammunition. The market segmentation reveals a significant share held by medium-caliber ammunition, reflecting the widespread use of these calibers in various military applications. However, the large-caliber segment is poised for strong growth driven by its application in advanced weapon systems. Guided ammunition, with its superior precision, commands a larger market share compared to unguided alternatives. The geographical distribution of the market showcases strong demand from North America and Europe, driven by the significant military spending and technological advancements in these regions. However, the Asia-Pacific region is also expected to witness substantial growth, driven by increasing military modernization efforts.
The competitive landscape is characterized by the presence of major defense contractors such as Nexter Systems, Rheinmetall, General Dynamics, RTX Corporation, and others, each contributing to the development and supply of programmable ammunition. Competition is intense, driven by continuous innovation in ammunition technology, cost optimization strategies, and efforts to secure lucrative government contracts. While factors such as stringent regulations and high initial investment costs can present challenges, the overall market outlook remains positive. The increasing focus on enhancing military capabilities, coupled with technological advancements, ensures continued growth in the programmable ammunition market throughout the forecast period, with potential diversification into emerging applications beyond military use. The development of smaller, more affordable, and potentially even commercially viable programmable ammunition units for law enforcement and other applications is a significant emerging trend.
Programmable Ammunition Market: A Comprehensive Report (2019-2033)
This comprehensive report provides a detailed analysis of the Programmable Ammunition Market, encompassing market dynamics, growth trends, regional segmentation, product landscape, key players, and future outlook. The study period covers 2019-2033, with 2025 as the base and estimated year. The report leverages extensive primary and secondary research to deliver actionable insights for industry professionals, investors, and strategic decision-makers. The parent market is the ammunition market, while the child market is specifically programmable ammunition. The market is expected to reach xx Million units by 2033.
Programmable Ammunition Market Market Dynamics & Structure
The programmable ammunition market is characterized by moderate concentration, with key players vying for market share through technological innovation and strategic partnerships. The market is driven by increasing demand for precision-guided munitions, advancements in sensor technology, and the rising adoption of autonomous weapon systems. Regulatory frameworks, particularly those concerning export controls and weapon proliferation, significantly influence market dynamics. Competitive substitutes include conventional ammunition and other precision-guided weapons systems. The end-user demographics primarily comprise military and defense forces globally. M&A activity in the sector remains relatively moderate, with xx deals recorded in the historical period (2019-2024).
- Market Concentration: Moderately concentrated, with top 5 players holding approximately xx% market share in 2025.
- Technological Innovation: Significant advancements in microelectronics, sensor technology, and software integration drive market growth.
- Regulatory Framework: Stringent export controls and international treaties influence market access and growth potential.
- Competitive Substitutes: Conventional ammunition and other precision-guided weapons systems pose competitive pressure.
- End-User Demographics: Primarily military and defense forces, with growing interest from law enforcement agencies.
- M&A Trends: Moderate M&A activity, with xx deals recorded between 2019 and 2024, primarily focused on technology acquisitions and expansion into new markets.
Programmable Ammunition Market Growth Trends & Insights
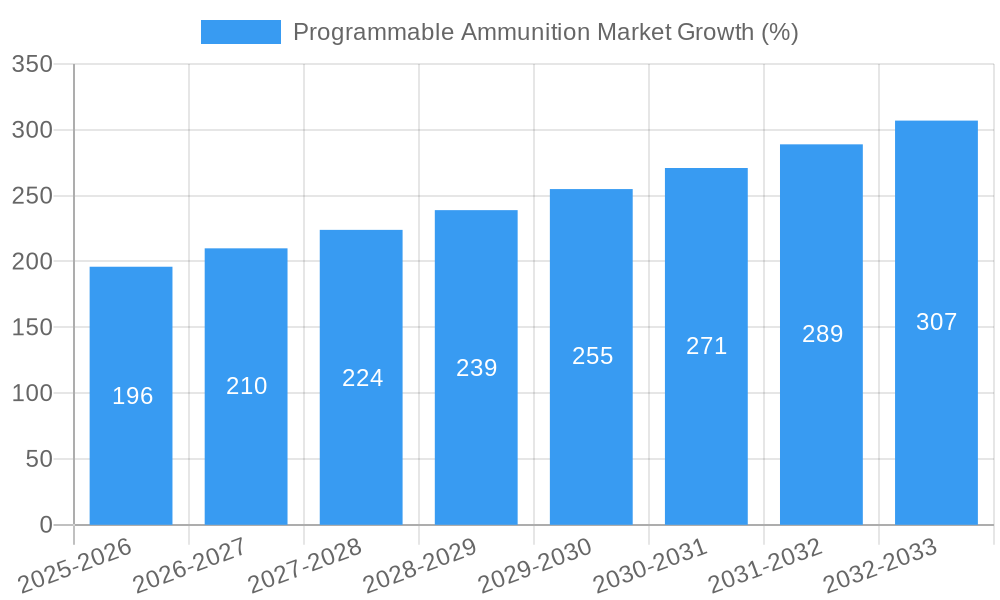
The programmable ammunition market exhibits a steady growth trajectory, driven by technological advancements and increasing military expenditure globally. The market size grew from xx Million units in 2019 to xx Million units in 2024, exhibiting a CAGR of xx% during the historical period. The adoption rate of programmable ammunition is increasing across various military applications, fueled by its enhanced accuracy and reduced collateral damage. Technological disruptions, such as the development of AI-powered targeting systems and improved communication protocols, are further accelerating market growth. Shifting consumer behavior, characterized by a greater preference for precision-guided weapons, supports this trend. The market is expected to reach xx Million units by 2033, with a projected CAGR of xx% during the forecast period (2025-2033). Market penetration currently stands at approximately xx% in 2025, with significant potential for future expansion.
Dominant Regions, Countries, or Segments in Programmable Ammunition Market
North America currently dominates the programmable ammunition market, driven by substantial military spending and technological advancements. Europe follows as a key region, showcasing significant technological expertise and a strong defense industry. The Asia-Pacific region is experiencing rapid growth, fueled by increasing military modernization efforts.
Dominant Segments:
- Detonation Type: Proximity detonation systems hold a significant market share, due to their enhanced accuracy and safety features.
- Caliber: Medium-caliber ammunition currently accounts for the largest market segment, though large-caliber ammunition is gaining traction.
- Type: Guided ammunition is the dominant segment, driven by the increasing demand for precision-guided munitions.
Key Drivers:
- Increased Military Spending: Significant investments in defense modernization by major global powers are driving market growth.
- Technological Advancements: Innovations in sensor technology, microelectronics, and software integration are fueling the adoption of advanced ammunition.
- Demand for Precision-Guided Munitions: The growing need for reduced collateral damage and increased accuracy fuels the demand for programmable ammunition.
Programmable Ammunition Market Product Landscape
Programmable ammunition incorporates advanced technologies such as embedded microprocessors, sophisticated sensors, and wireless communication systems to allow for flexible detonation control. These systems offer enhanced accuracy, reduced collateral damage, and improved battlefield situational awareness compared to conventional ammunition. Unique selling propositions include programmable detonation capabilities, advanced targeting systems, and improved safety features. Recent technological advancements focus on miniaturization, improved sensor accuracy, and enhanced communication range.
Key Drivers, Barriers & Challenges in Programmable Ammunition Market
Key Drivers:
- Rising demand for precision-guided munitions: The need for minimizing civilian casualties and maximizing targeting efficiency is driving adoption.
- Technological advancements: Improvements in sensor technology, microprocessors, and communication systems enhance accuracy and functionality.
- Increased military spending: Significant investments by governments worldwide fuel the development and procurement of advanced weapon systems.
Key Challenges:
- High production costs: The complex technology involved leads to higher manufacturing expenses compared to conventional ammunition.
- Supply chain vulnerabilities: The reliance on specialized components and materials can create supply chain risks.
- Stringent regulatory frameworks: Export controls and international regulations can limit market access and growth. These regulations account for approximately xx% of market restraint in 2025.
Emerging Opportunities in Programmable Ammunition Market
Emerging opportunities lie in the development of AI-powered targeting systems, the integration of programmable ammunition into autonomous weapon platforms, and the expansion into new markets such as law enforcement and counter-terrorism applications. The development of smaller, lighter, and more cost-effective programmable ammunition also presents a significant opportunity for market expansion. Furthermore, the integration of advanced communication protocols and improved data analytics can create new possibilities for enhancing ammunition performance and battlefield effectiveness.
Growth Accelerators in the Programmable Ammunition Market Industry
Technological breakthroughs, particularly in the area of AI-powered targeting and miniaturization, are key growth accelerators. Strategic partnerships between ammunition manufacturers and technology providers are fostering innovation and accelerating product development. Market expansion strategies, such as focusing on emerging markets and diversifying product portfolios, are also contributing to market growth. The increasing integration of programmable ammunition into unmanned aerial vehicles (UAVs) and other autonomous weapon systems represents a significant growth opportunity.
Key Players Shaping the Programmable Ammunition Market Market
- Nexter Systems (KNDS)
- Rheinmetall AG
- General Dynamics Corporation
- RTX Corporation
- JUNGHANS Microtec GmbH
- Leonardo S p A
- Nammo AS
- Fuchs Electronics (Pty) Ltd
- BAE Systems plc
- Northrop Grumman Corporation
- ASELSAN A Ş
Notable Milestones in Programmable Ammunition Market Sector
- September 2023: The Serbian Military Technical Institute (MTI) unveiled an updated Pasars-16 self-propelled anti-aircraft gun and missile system incorporating advanced weapon systems, including a 40 mm L/70 Bofors autocannon. This highlights the growing integration of programmable ammunition into larger weapon systems.
- April 2023: The US Army announced the development of the XM1223 Multi-Mode Proximity Airburst (MMPA) ammunition for neutralizing small unmanned aircraft systems and ground vehicles, showcasing the increasing focus on counter-drone technologies.
In-Depth Programmable Ammunition Market Market Outlook
The programmable ammunition market is poised for significant growth, driven by sustained military investments and technological advancements. Future market potential is substantial, particularly in emerging markets and niche applications such as counter-drone warfare. Strategic opportunities exist for companies that can develop innovative products, forge strategic partnerships, and effectively navigate the regulatory landscape. The increasing demand for precision-guided munitions and autonomous weapon systems will continue to propel market expansion throughout the forecast period.
Programmable Ammunition Market Segmentation
-
1. Caliber
- 1.1. Medium-Caliber
- 1.2. Large-Caliber
-
2. Type
- 2.1. Guided
- 2.2. Target Sensing
-
3. Detonation Type
- 3.1. Time Programmable
- 3.2. Impact Self-Destruct
- 3.3. Proximity
- 3.4. Remote Wireless
Programmable Ammunition Market Segmentation By Geography
-
1. North America
- 1.1. United States
- 1.2. Canada
-
2. Europe
- 2.1. United Kingdom
- 2.2. Germany
- 2.3. France
- 2.4. Russia
- 2.5. Rest of Europe
-
3. Asia Pacific
- 3.1. China
- 3.2. Japan
- 3.3. India
- 3.4. South Korea
- 3.5. Rest of Asia Pacific
-
4. Latin America
- 4.1. Brazil
- 4.2. Mexico
- 4.3. Rest of Latin America
-
5. Middle East and Africa
- 5.1. United Arab Emirates
- 5.2. Saudi Arabia
- 5.3. Qatar
- 5.4. Rest of Middle East and Africa
Programmable Ammunition Market REPORT HIGHLIGHTS
| Aspects | Details |
|---|---|
| Study Period | 2019-2033 |
| Base Year | 2024 |
| Estimated Year | 2025 |
| Forecast Period | 2025-2033 |
| Historical Period | 2019-2024 |
| Growth Rate | CAGR of 5.99% from 2019-2033 |
| Segmentation |
|
Table of Contents
- 1. Introduction
- 1.1. Research Scope
- 1.2. Market Segmentation
- 1.3. Research Methodology
- 1.4. Definitions and Assumptions
- 2. Executive Summary
- 2.1. Introduction
- 3. Market Dynamics
- 3.1. Introduction
- 3.2. Market Drivers
- 3.3. Market Restrains
- 3.4. Market Trends
- 3.4.1. Medium Caliber Segment Will Showcase Remarkable Growth During the Forecast Period
- 4. Market Factor Analysis
- 4.1. Porters Five Forces
- 4.2. Supply/Value Chain
- 4.3. PESTEL analysis
- 4.4. Market Entropy
- 4.5. Patent/Trademark Analysis
- 5. Global Programmable Ammunition Market Analysis, Insights and Forecast, 2019-2031
- 5.1. Market Analysis, Insights and Forecast - by Caliber
- 5.1.1. Medium-Caliber
- 5.1.2. Large-Caliber
- 5.2. Market Analysis, Insights and Forecast - by Type
- 5.2.1. Guided
- 5.2.2. Target Sensing
- 5.3. Market Analysis, Insights and Forecast - by Detonation Type
- 5.3.1. Time Programmable
- 5.3.2. Impact Self-Destruct
- 5.3.3. Proximity
- 5.3.4. Remote Wireless
- 5.4. Market Analysis, Insights and Forecast - by Region
- 5.4.1. North America
- 5.4.2. Europe
- 5.4.3. Asia Pacific
- 5.4.4. Latin America
- 5.4.5. Middle East and Africa
- 5.1. Market Analysis, Insights and Forecast - by Caliber
- 6. North America Programmable Ammunition Market Analysis, Insights and Forecast, 2019-2031
- 6.1. Market Analysis, Insights and Forecast - by Caliber
- 6.1.1. Medium-Caliber
- 6.1.2. Large-Caliber
- 6.2. Market Analysis, Insights and Forecast - by Type
- 6.2.1. Guided
- 6.2.2. Target Sensing
- 6.3. Market Analysis, Insights and Forecast - by Detonation Type
- 6.3.1. Time Programmable
- 6.3.2. Impact Self-Destruct
- 6.3.3. Proximity
- 6.3.4. Remote Wireless
- 6.1. Market Analysis, Insights and Forecast - by Caliber
- 7. Europe Programmable Ammunition Market Analysis, Insights and Forecast, 2019-2031
- 7.1. Market Analysis, Insights and Forecast - by Caliber
- 7.1.1. Medium-Caliber
- 7.1.2. Large-Caliber
- 7.2. Market Analysis, Insights and Forecast - by Type
- 7.2.1. Guided
- 7.2.2. Target Sensing
- 7.3. Market Analysis, Insights and Forecast - by Detonation Type
- 7.3.1. Time Programmable
- 7.3.2. Impact Self-Destruct
- 7.3.3. Proximity
- 7.3.4. Remote Wireless
- 7.1. Market Analysis, Insights and Forecast - by Caliber
- 8. Asia Pacific Programmable Ammunition Market Analysis, Insights and Forecast, 2019-2031
- 8.1. Market Analysis, Insights and Forecast - by Caliber
- 8.1.1. Medium-Caliber
- 8.1.2. Large-Caliber
- 8.2. Market Analysis, Insights and Forecast - by Type
- 8.2.1. Guided
- 8.2.2. Target Sensing
- 8.3. Market Analysis, Insights and Forecast - by Detonation Type
- 8.3.1. Time Programmable
- 8.3.2. Impact Self-Destruct
- 8.3.3. Proximity
- 8.3.4. Remote Wireless
- 8.1. Market Analysis, Insights and Forecast - by Caliber
- 9. Latin America Programmable Ammunition Market Analysis, Insights and Forecast, 2019-2031
- 9.1. Market Analysis, Insights and Forecast - by Caliber
- 9.1.1. Medium-Caliber
- 9.1.2. Large-Caliber
- 9.2. Market Analysis, Insights and Forecast - by Type
- 9.2.1. Guided
- 9.2.2. Target Sensing
- 9.3. Market Analysis, Insights and Forecast - by Detonation Type
- 9.3.1. Time Programmable
- 9.3.2. Impact Self-Destruct
- 9.3.3. Proximity
- 9.3.4. Remote Wireless
- 9.1. Market Analysis, Insights and Forecast - by Caliber
- 10. Middle East and Africa Programmable Ammunition Market Analysis, Insights and Forecast, 2019-2031
- 10.1. Market Analysis, Insights and Forecast - by Caliber
- 10.1.1. Medium-Caliber
- 10.1.2. Large-Caliber
- 10.2. Market Analysis, Insights and Forecast - by Type
- 10.2.1. Guided
- 10.2.2. Target Sensing
- 10.3. Market Analysis, Insights and Forecast - by Detonation Type
- 10.3.1. Time Programmable
- 10.3.2. Impact Self-Destruct
- 10.3.3. Proximity
- 10.3.4. Remote Wireless
- 10.1. Market Analysis, Insights and Forecast - by Caliber
- 11. North America Programmable Ammunition Market Analysis, Insights and Forecast, 2019-2031
- 11.1. Market Analysis, Insights and Forecast - By Country/Sub-region
- 11.1.1 United States
- 11.1.2 Canada
- 12. Europe Programmable Ammunition Market Analysis, Insights and Forecast, 2019-2031
- 12.1. Market Analysis, Insights and Forecast - By Country/Sub-region
- 12.1.1 United Kingdom
- 12.1.2 Germany
- 12.1.3 France
- 12.1.4 Russia
- 12.1.5 Rest of Europe
- 13. Asia Pacific Programmable Ammunition Market Analysis, Insights and Forecast, 2019-2031
- 13.1. Market Analysis, Insights and Forecast - By Country/Sub-region
- 13.1.1 China
- 13.1.2 Japan
- 13.1.3 India
- 13.1.4 South Korea
- 13.1.5 Rest of Asia Pacific
- 14. Latin America Programmable Ammunition Market Analysis, Insights and Forecast, 2019-2031
- 14.1. Market Analysis, Insights and Forecast - By Country/Sub-region
- 14.1.1 Brazil
- 14.1.2 Mexico
- 14.1.3 Rest of Latin America
- 15. Middle East and Africa Programmable Ammunition Market Analysis, Insights and Forecast, 2019-2031
- 15.1. Market Analysis, Insights and Forecast - By Country/Sub-region
- 15.1.1 United Arab Emirates
- 15.1.2 Saudi Arabia
- 15.1.3 Qatar
- 15.1.4 Rest of Middle East and Africa
- 16. Competitive Analysis
- 16.1. Global Market Share Analysis 2024
- 16.2. Company Profiles
- 16.2.1 Nexter Systems (KNDS)
- 16.2.1.1. Overview
- 16.2.1.2. Products
- 16.2.1.3. SWOT Analysis
- 16.2.1.4. Recent Developments
- 16.2.1.5. Financials (Based on Availability)
- 16.2.2 Rheinmetall AG
- 16.2.2.1. Overview
- 16.2.2.2. Products
- 16.2.2.3. SWOT Analysis
- 16.2.2.4. Recent Developments
- 16.2.2.5. Financials (Based on Availability)
- 16.2.3 General Dynamics Corporatio
- 16.2.3.1. Overview
- 16.2.3.2. Products
- 16.2.3.3. SWOT Analysis
- 16.2.3.4. Recent Developments
- 16.2.3.5. Financials (Based on Availability)
- 16.2.4 RTX Corporation
- 16.2.4.1. Overview
- 16.2.4.2. Products
- 16.2.4.3. SWOT Analysis
- 16.2.4.4. Recent Developments
- 16.2.4.5. Financials (Based on Availability)
- 16.2.5 JUNGHANS Microtec GmbH
- 16.2.5.1. Overview
- 16.2.5.2. Products
- 16.2.5.3. SWOT Analysis
- 16.2.5.4. Recent Developments
- 16.2.5.5. Financials (Based on Availability)
- 16.2.6 Leonardo S p A
- 16.2.6.1. Overview
- 16.2.6.2. Products
- 16.2.6.3. SWOT Analysis
- 16.2.6.4. Recent Developments
- 16.2.6.5. Financials (Based on Availability)
- 16.2.7 Nammo AS
- 16.2.7.1. Overview
- 16.2.7.2. Products
- 16.2.7.3. SWOT Analysis
- 16.2.7.4. Recent Developments
- 16.2.7.5. Financials (Based on Availability)
- 16.2.8 Fuchs Electronics (Pty) Ltd
- 16.2.8.1. Overview
- 16.2.8.2. Products
- 16.2.8.3. SWOT Analysis
- 16.2.8.4. Recent Developments
- 16.2.8.5. Financials (Based on Availability)
- 16.2.9 BAE Systems plc
- 16.2.9.1. Overview
- 16.2.9.2. Products
- 16.2.9.3. SWOT Analysis
- 16.2.9.4. Recent Developments
- 16.2.9.5. Financials (Based on Availability)
- 16.2.10 Northrop Grumman Corporation
- 16.2.10.1. Overview
- 16.2.10.2. Products
- 16.2.10.3. SWOT Analysis
- 16.2.10.4. Recent Developments
- 16.2.10.5. Financials (Based on Availability)
- 16.2.11 ASELSAN A Ş
- 16.2.11.1. Overview
- 16.2.11.2. Products
- 16.2.11.3. SWOT Analysis
- 16.2.11.4. Recent Developments
- 16.2.11.5. Financials (Based on Availability)
- 16.2.1 Nexter Systems (KNDS)
List of Figures
- Figure 1: Global Programmable Ammunition Market Revenue Breakdown (Million, %) by Region 2024 & 2032
- Figure 2: North America Programmable Ammunition Market Revenue (Million), by Country 2024 & 2032
- Figure 3: North America Programmable Ammunition Market Revenue Share (%), by Country 2024 & 2032
- Figure 4: Europe Programmable Ammunition Market Revenue (Million), by Country 2024 & 2032
- Figure 5: Europe Programmable Ammunition Market Revenue Share (%), by Country 2024 & 2032
- Figure 6: Asia Pacific Programmable Ammunition Market Revenue (Million), by Country 2024 & 2032
- Figure 7: Asia Pacific Programmable Ammunition Market Revenue Share (%), by Country 2024 & 2032
- Figure 8: Latin America Programmable Ammunition Market Revenue (Million), by Country 2024 & 2032
- Figure 9: Latin America Programmable Ammunition Market Revenue Share (%), by Country 2024 & 2032
- Figure 10: Middle East and Africa Programmable Ammunition Market Revenue (Million), by Country 2024 & 2032
- Figure 11: Middle East and Africa Programmable Ammunition Market Revenue Share (%), by Country 2024 & 2032
- Figure 12: North America Programmable Ammunition Market Revenue (Million), by Caliber 2024 & 2032
- Figure 13: North America Programmable Ammunition Market Revenue Share (%), by Caliber 2024 & 2032
- Figure 14: North America Programmable Ammunition Market Revenue (Million), by Type 2024 & 2032
- Figure 15: North America Programmable Ammunition Market Revenue Share (%), by Type 2024 & 2032
- Figure 16: North America Programmable Ammunition Market Revenue (Million), by Detonation Type 2024 & 2032
- Figure 17: North America Programmable Ammunition Market Revenue Share (%), by Detonation Type 2024 & 2032
- Figure 18: North America Programmable Ammunition Market Revenue (Million), by Country 2024 & 2032
- Figure 19: North America Programmable Ammunition Market Revenue Share (%), by Country 2024 & 2032
- Figure 20: Europe Programmable Ammunition Market Revenue (Million), by Caliber 2024 & 2032
- Figure 21: Europe Programmable Ammunition Market Revenue Share (%), by Caliber 2024 & 2032
- Figure 22: Europe Programmable Ammunition Market Revenue (Million), by Type 2024 & 2032
- Figure 23: Europe Programmable Ammunition Market Revenue Share (%), by Type 2024 & 2032
- Figure 24: Europe Programmable Ammunition Market Revenue (Million), by Detonation Type 2024 & 2032
- Figure 25: Europe Programmable Ammunition Market Revenue Share (%), by Detonation Type 2024 & 2032
- Figure 26: Europe Programmable Ammunition Market Revenue (Million), by Country 2024 & 2032
- Figure 27: Europe Programmable Ammunition Market Revenue Share (%), by Country 2024 & 2032
- Figure 28: Asia Pacific Programmable Ammunition Market Revenue (Million), by Caliber 2024 & 2032
- Figure 29: Asia Pacific Programmable Ammunition Market Revenue Share (%), by Caliber 2024 & 2032
- Figure 30: Asia Pacific Programmable Ammunition Market Revenue (Million), by Type 2024 & 2032
- Figure 31: Asia Pacific Programmable Ammunition Market Revenue Share (%), by Type 2024 & 2032
- Figure 32: Asia Pacific Programmable Ammunition Market Revenue (Million), by Detonation Type 2024 & 2032
- Figure 33: Asia Pacific Programmable Ammunition Market Revenue Share (%), by Detonation Type 2024 & 2032
- Figure 34: Asia Pacific Programmable Ammunition Market Revenue (Million), by Country 2024 & 2032
- Figure 35: Asia Pacific Programmable Ammunition Market Revenue Share (%), by Country 2024 & 2032
- Figure 36: Latin America Programmable Ammunition Market Revenue (Million), by Caliber 2024 & 2032
- Figure 37: Latin America Programmable Ammunition Market Revenue Share (%), by Caliber 2024 & 2032
- Figure 38: Latin America Programmable Ammunition Market Revenue (Million), by Type 2024 & 2032
- Figure 39: Latin America Programmable Ammunition Market Revenue Share (%), by Type 2024 & 2032
- Figure 40: Latin America Programmable Ammunition Market Revenue (Million), by Detonation Type 2024 & 2032
- Figure 41: Latin America Programmable Ammunition Market Revenue Share (%), by Detonation Type 2024 & 2032
- Figure 42: Latin America Programmable Ammunition Market Revenue (Million), by Country 2024 & 2032
- Figure 43: Latin America Programmable Ammunition Market Revenue Share (%), by Country 2024 & 2032
- Figure 44: Middle East and Africa Programmable Ammunition Market Revenue (Million), by Caliber 2024 & 2032
- Figure 45: Middle East and Africa Programmable Ammunition Market Revenue Share (%), by Caliber 2024 & 2032
- Figure 46: Middle East and Africa Programmable Ammunition Market Revenue (Million), by Type 2024 & 2032
- Figure 47: Middle East and Africa Programmable Ammunition Market Revenue Share (%), by Type 2024 & 2032
- Figure 48: Middle East and Africa Programmable Ammunition Market Revenue (Million), by Detonation Type 2024 & 2032
- Figure 49: Middle East and Africa Programmable Ammunition Market Revenue Share (%), by Detonation Type 2024 & 2032
- Figure 50: Middle East and Africa Programmable Ammunition Market Revenue (Million), by Country 2024 & 2032
- Figure 51: Middle East and Africa Programmable Ammunition Market Revenue Share (%), by Country 2024 & 2032
List of Tables
- Table 1: Global Programmable Ammunition Market Revenue Million Forecast, by Region 2019 & 2032
- Table 2: Global Programmable Ammunition Market Revenue Million Forecast, by Caliber 2019 & 2032
- Table 3: Global Programmable Ammunition Market Revenue Million Forecast, by Type 2019 & 2032
- Table 4: Global Programmable Ammunition Market Revenue Million Forecast, by Detonation Type 2019 & 2032
- Table 5: Global Programmable Ammunition Market Revenue Million Forecast, by Region 2019 & 2032
- Table 6: Global Programmable Ammunition Market Revenue Million Forecast, by Country 2019 & 2032
- Table 7: United States Programmable Ammunition Market Revenue (Million) Forecast, by Application 2019 & 2032
- Table 8: Canada Programmable Ammunition Market Revenue (Million) Forecast, by Application 2019 & 2032
- Table 9: Global Programmable Ammunition Market Revenue Million Forecast, by Country 2019 & 2032
- Table 10: United Kingdom Programmable Ammunition Market Revenue (Million) Forecast, by Application 2019 & 2032
- Table 11: Germany Programmable Ammunition Market Revenue (Million) Forecast, by Application 2019 & 2032
- Table 12: France Programmable Ammunition Market Revenue (Million) Forecast, by Application 2019 & 2032
- Table 13: Russia Programmable Ammunition Market Revenue (Million) Forecast, by Application 2019 & 2032
- Table 14: Rest of Europe Programmable Ammunition Market Revenue (Million) Forecast, by Application 2019 & 2032
- Table 15: Global Programmable Ammunition Market Revenue Million Forecast, by Country 2019 & 2032
- Table 16: China Programmable Ammunition Market Revenue (Million) Forecast, by Application 2019 & 2032
- Table 17: Japan Programmable Ammunition Market Revenue (Million) Forecast, by Application 2019 & 2032
- Table 18: India Programmable Ammunition Market Revenue (Million) Forecast, by Application 2019 & 2032
- Table 19: South Korea Programmable Ammunition Market Revenue (Million) Forecast, by Application 2019 & 2032
- Table 20: Rest of Asia Pacific Programmable Ammunition Market Revenue (Million) Forecast, by Application 2019 & 2032
- Table 21: Global Programmable Ammunition Market Revenue Million Forecast, by Country 2019 & 2032
- Table 22: Brazil Programmable Ammunition Market Revenue (Million) Forecast, by Application 2019 & 2032
- Table 23: Mexico Programmable Ammunition Market Revenue (Million) Forecast, by Application 2019 & 2032
- Table 24: Rest of Latin America Programmable Ammunition Market Revenue (Million) Forecast, by Application 2019 & 2032
- Table 25: Global Programmable Ammunition Market Revenue Million Forecast, by Country 2019 & 2032
- Table 26: United Arab Emirates Programmable Ammunition Market Revenue (Million) Forecast, by Application 2019 & 2032
- Table 27: Saudi Arabia Programmable Ammunition Market Revenue (Million) Forecast, by Application 2019 & 2032
- Table 28: Qatar Programmable Ammunition Market Revenue (Million) Forecast, by Application 2019 & 2032
- Table 29: Rest of Middle East and Africa Programmable Ammunition Market Revenue (Million) Forecast, by Application 2019 & 2032
- Table 30: Global Programmable Ammunition Market Revenue Million Forecast, by Caliber 2019 & 2032
- Table 31: Global Programmable Ammunition Market Revenue Million Forecast, by Type 2019 & 2032
- Table 32: Global Programmable Ammunition Market Revenue Million Forecast, by Detonation Type 2019 & 2032
- Table 33: Global Programmable Ammunition Market Revenue Million Forecast, by Country 2019 & 2032
- Table 34: United States Programmable Ammunition Market Revenue (Million) Forecast, by Application 2019 & 2032
- Table 35: Canada Programmable Ammunition Market Revenue (Million) Forecast, by Application 2019 & 2032
- Table 36: Global Programmable Ammunition Market Revenue Million Forecast, by Caliber 2019 & 2032
- Table 37: Global Programmable Ammunition Market Revenue Million Forecast, by Type 2019 & 2032
- Table 38: Global Programmable Ammunition Market Revenue Million Forecast, by Detonation Type 2019 & 2032
- Table 39: Global Programmable Ammunition Market Revenue Million Forecast, by Country 2019 & 2032
- Table 40: United Kingdom Programmable Ammunition Market Revenue (Million) Forecast, by Application 2019 & 2032
- Table 41: Germany Programmable Ammunition Market Revenue (Million) Forecast, by Application 2019 & 2032
- Table 42: France Programmable Ammunition Market Revenue (Million) Forecast, by Application 2019 & 2032
- Table 43: Russia Programmable Ammunition Market Revenue (Million) Forecast, by Application 2019 & 2032
- Table 44: Rest of Europe Programmable Ammunition Market Revenue (Million) Forecast, by Application 2019 & 2032
- Table 45: Global Programmable Ammunition Market Revenue Million Forecast, by Caliber 2019 & 2032
- Table 46: Global Programmable Ammunition Market Revenue Million Forecast, by Type 2019 & 2032
- Table 47: Global Programmable Ammunition Market Revenue Million Forecast, by Detonation Type 2019 & 2032
- Table 48: Global Programmable Ammunition Market Revenue Million Forecast, by Country 2019 & 2032
- Table 49: China Programmable Ammunition Market Revenue (Million) Forecast, by Application 2019 & 2032
- Table 50: Japan Programmable Ammunition Market Revenue (Million) Forecast, by Application 2019 & 2032
- Table 51: India Programmable Ammunition Market Revenue (Million) Forecast, by Application 2019 & 2032
- Table 52: South Korea Programmable Ammunition Market Revenue (Million) Forecast, by Application 2019 & 2032
- Table 53: Rest of Asia Pacific Programmable Ammunition Market Revenue (Million) Forecast, by Application 2019 & 2032
- Table 54: Global Programmable Ammunition Market Revenue Million Forecast, by Caliber 2019 & 2032
- Table 55: Global Programmable Ammunition Market Revenue Million Forecast, by Type 2019 & 2032
- Table 56: Global Programmable Ammunition Market Revenue Million Forecast, by Detonation Type 2019 & 2032
- Table 57: Global Programmable Ammunition Market Revenue Million Forecast, by Country 2019 & 2032
- Table 58: Brazil Programmable Ammunition Market Revenue (Million) Forecast, by Application 2019 & 2032
- Table 59: Mexico Programmable Ammunition Market Revenue (Million) Forecast, by Application 2019 & 2032
- Table 60: Rest of Latin America Programmable Ammunition Market Revenue (Million) Forecast, by Application 2019 & 2032
- Table 61: Global Programmable Ammunition Market Revenue Million Forecast, by Caliber 2019 & 2032
- Table 62: Global Programmable Ammunition Market Revenue Million Forecast, by Type 2019 & 2032
- Table 63: Global Programmable Ammunition Market Revenue Million Forecast, by Detonation Type 2019 & 2032
- Table 64: Global Programmable Ammunition Market Revenue Million Forecast, by Country 2019 & 2032
- Table 65: United Arab Emirates Programmable Ammunition Market Revenue (Million) Forecast, by Application 2019 & 2032
- Table 66: Saudi Arabia Programmable Ammunition Market Revenue (Million) Forecast, by Application 2019 & 2032
- Table 67: Qatar Programmable Ammunition Market Revenue (Million) Forecast, by Application 2019 & 2032
- Table 68: Rest of Middle East and Africa Programmable Ammunition Market Revenue (Million) Forecast, by Application 2019 & 2032
Frequently Asked Questions
1. What is the projected Compound Annual Growth Rate (CAGR) of the Programmable Ammunition Market?
The projected CAGR is approximately 5.99%.
2. Which companies are prominent players in the Programmable Ammunition Market?
Key companies in the market include Nexter Systems (KNDS), Rheinmetall AG, General Dynamics Corporatio, RTX Corporation, JUNGHANS Microtec GmbH, Leonardo S p A, Nammo AS, Fuchs Electronics (Pty) Ltd, BAE Systems plc, Northrop Grumman Corporation, ASELSAN A Ş.
3. What are the main segments of the Programmable Ammunition Market?
The market segments include Caliber, Type, Detonation Type .
4. Can you provide details about the market size?
The market size is estimated to be USD 3.18 Million as of 2022.
5. What are some drivers contributing to market growth?
N/A
6. What are the notable trends driving market growth?
Medium Caliber Segment Will Showcase Remarkable Growth During the Forecast Period.
7. Are there any restraints impacting market growth?
N/A
8. Can you provide examples of recent developments in the market?
September 2023: The Serbian Military Technical Institute (MTI) unveiled a new iteration of the Pasars-16 self-propelled anti-aircraft gun and missile system. This updated variant incorporates a range of advanced weapon systems and is armed with a single-barrel 40 mm L/70 Bofors autocannon.
9. What pricing options are available for accessing the report?
Pricing options include single-user, multi-user, and enterprise licenses priced at USD 4750, USD 5250, and USD 8750 respectively.
10. Is the market size provided in terms of value or volume?
The market size is provided in terms of value, measured in Million.
11. Are there any specific market keywords associated with the report?
Yes, the market keyword associated with the report is "Programmable Ammunition Market," which aids in identifying and referencing the specific market segment covered.
12. How do I determine which pricing option suits my needs best?
The pricing options vary based on user requirements and access needs. Individual users may opt for single-user licenses, while businesses requiring broader access may choose multi-user or enterprise licenses for cost-effective access to the report.
13. Are there any additional resources or data provided in the Programmable Ammunition Market report?
While the report offers comprehensive insights, it's advisable to review the specific contents or supplementary materials provided to ascertain if additional resources or data are available.
14. How can I stay updated on further developments or reports in the Programmable Ammunition Market?
To stay informed about further developments, trends, and reports in the Programmable Ammunition Market, consider subscribing to industry newsletters, following relevant companies and organizations, or regularly checking reputable industry news sources and publications.
Methodology
Step 1 - Identification of Relevant Samples Size from Population Database


Step 2 - Approaches for Defining Global Market Size (Value, Volume* & Price*)

Note*: In applicable scenarios
Step 3 - Data Sources
Primary Research
- Web Analytics
- Survey Reports
- Research Institute
- Latest Research Reports
- Opinion Leaders
Secondary Research
- Annual Reports
- White Paper
- Latest Press Release
- Industry Association
- Paid Database
- Investor Presentations

Step 4 - Data Triangulation
Involves using different sources of information in order to increase the validity of a study
These sources are likely to be stakeholders in a program - participants, other researchers, program staff, other community members, and so on.
Then we put all data in single framework & apply various statistical tools to find out the dynamic on the market.
During the analysis stage, feedback from the stakeholder groups would be compared to determine areas of agreement as well as areas of divergence


