
Key Insights
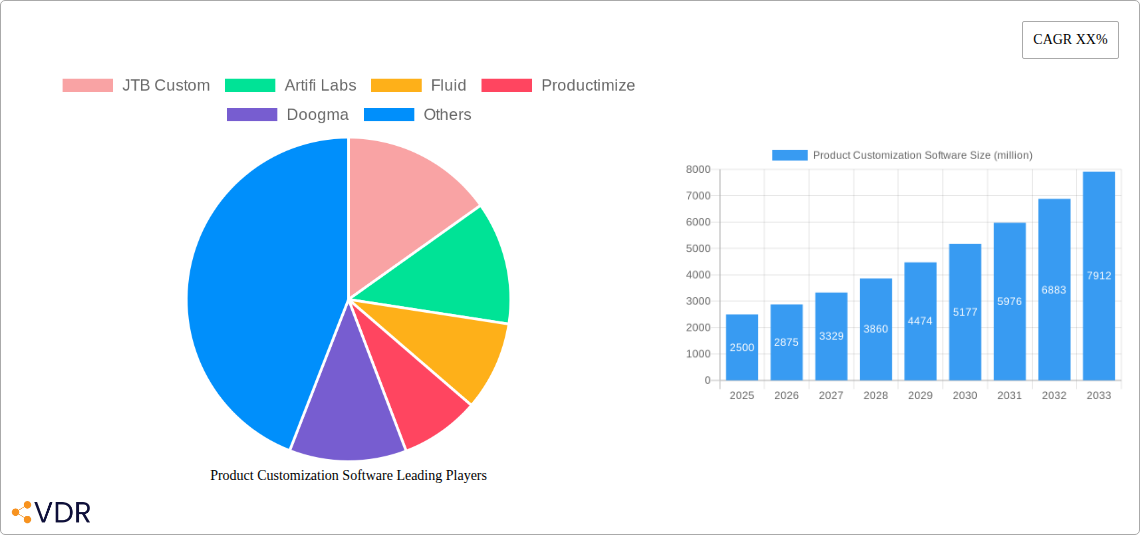
The Product Customization Software market is experiencing robust growth, driven by the increasing demand for personalized products and experiences across various industries. The market, estimated at $2.5 billion in 2025, is projected to exhibit a Compound Annual Growth Rate (CAGR) of 15% from 2025 to 2033, reaching an estimated market value of $7.2 billion by 2033. This growth is fueled by several key trends: the rising adoption of e-commerce and the need for enhanced customer engagement, the increasing use of Artificial Intelligence (AI) and Machine Learning (ML) to personalize product offerings, and the growing importance of omnichannel experiences that seamlessly integrate online and offline customization options. Companies are leveraging these technologies to offer tailored product configurations, personalized designs, and even customized manufacturing processes. Furthermore, the growing preference for sustainable and ethical consumption is driving demand for customization options that allow customers to create products with specific environmental or social considerations in mind.
Despite the significant growth potential, the market faces certain restraints. High initial investment costs for software implementation and integration can be a barrier for smaller businesses. Moreover, ensuring seamless integration with existing e-commerce platforms and enterprise resource planning (ERP) systems presents a technical challenge. The complexities associated with managing diverse product configurations and maintaining data consistency across various channels also pose challenges. However, ongoing advancements in software capabilities and the emergence of user-friendly, cloud-based solutions are mitigating some of these challenges, paving the way for broader adoption across different business sizes and sectors. The competitive landscape is characterized by a mix of established players and emerging innovators, fostering innovation and driving further market expansion.
Product Customization Software Market Report: 2019-2033
This comprehensive report provides a detailed analysis of the Product Customization Software market, encompassing market dynamics, growth trends, regional dominance, product landscape, challenges, opportunities, key players, and future outlook. The study period covers 2019-2033, with 2025 as the base and estimated year. The forecast period spans 2025-2033, and the historical period encompasses 2019-2024. The report caters to industry professionals, investors, and businesses seeking insights into this rapidly evolving market segment within the broader software solutions industry (parent market) and more specifically the e-commerce and manufacturing software sectors (child markets). The market size is projected to reach xx million units by 2033.
Product Customization Software Market Dynamics & Structure
The Product Customization Software market is characterized by moderate concentration, with a few dominant players and numerous smaller niche providers. Technological innovation, driven by AI and advanced visualization tools, is a key driver, while regulatory frameworks related to data privacy and security significantly influence market practices. Competitive substitutes include traditional manual customization processes and basic configuration tools, although the advantages of software solutions are increasingly recognized. The end-user demographic spans various industries, including manufacturing, e-commerce, and fashion, with a growing adoption among SMEs and large enterprises alike. M&A activity in the sector has been relatively modest in recent years, with approximately xx deals recorded between 2019 and 2024, representing a xx% increase compared to the preceding five years.
- Market Concentration: Moderately concentrated, with a Herfindahl-Hirschman Index (HHI) of xx.
- Technological Innovation: AI-powered design tools, 3D visualization, and improved integration with e-commerce platforms.
- Regulatory Frameworks: GDPR, CCPA, and other data privacy regulations influence software development and data handling practices.
- Competitive Substitutes: Manual customization, basic configuration tools.
- End-User Demographics: Diversified across industries, with growing adoption among SMEs and enterprises.
- M&A Trends: xx M&A deals between 2019-2024, indicating a moderate level of consolidation. A projected xx million units increase in M&A is expected between 2025-2033.
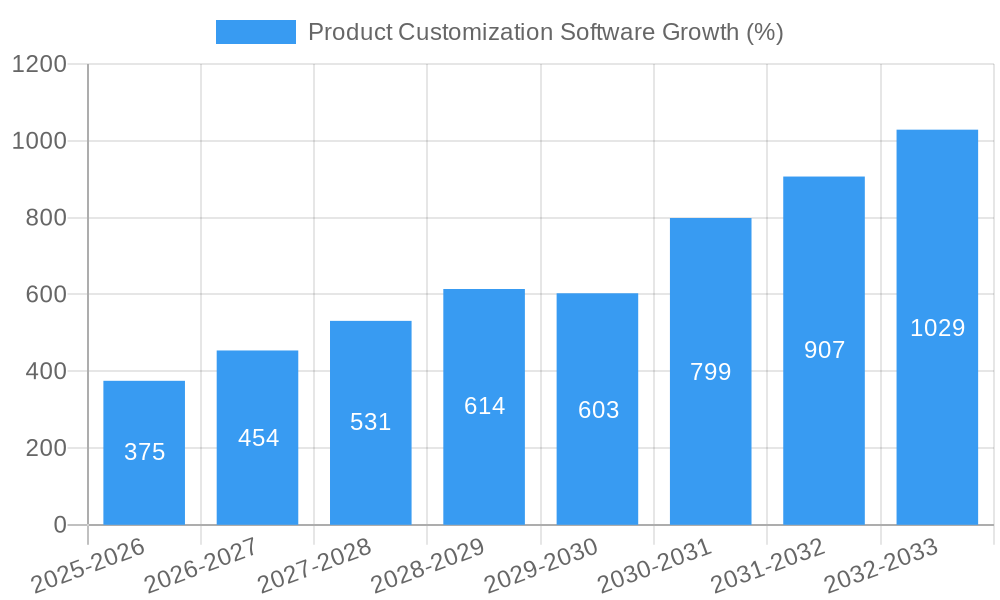
Product Customization Software Growth Trends & Insights
The Product Customization Software market has experienced steady growth during the historical period (2019-2024), with a Compound Annual Growth Rate (CAGR) of xx%. This growth is attributed to increasing demand for personalized products, the expansion of e-commerce, and technological advancements that make customization more accessible and affordable. Market penetration remains relatively low, particularly in certain industries, indicating significant untapped potential. Technological disruptions, such as the increasing adoption of cloud-based solutions and the integration of AR/VR technologies, are further driving market expansion. Shifts in consumer behavior towards personalization and bespoke products are also contributing factors. The market is expected to maintain a healthy CAGR of xx% during the forecast period (2025-2033), reaching xx million units by 2033.
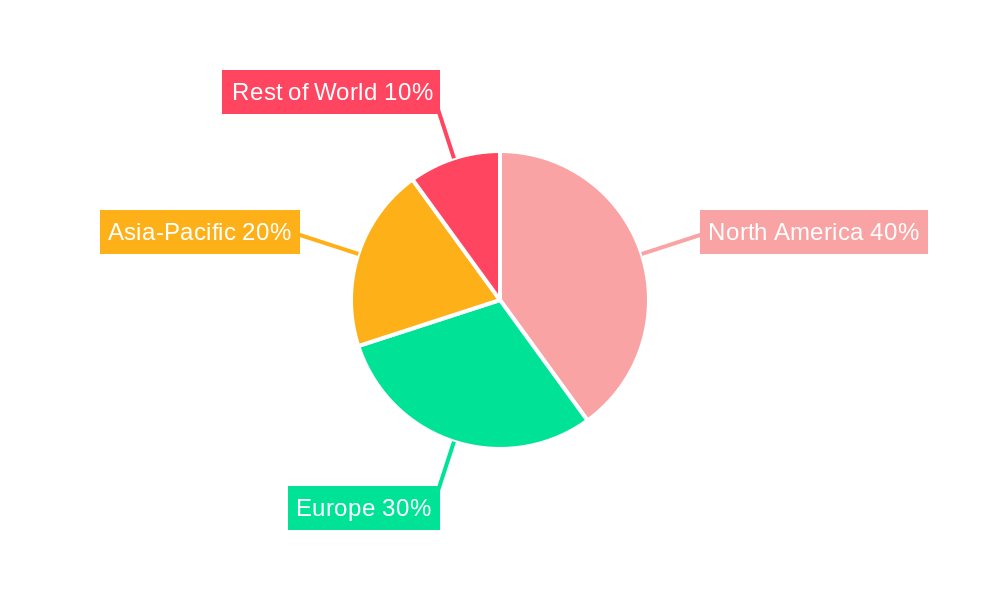
Dominant Regions, Countries, or Segments in Product Customization Software
North America currently holds the largest market share in Product Customization Software, driven by strong technological advancements, high consumer spending, and a large number of e-commerce businesses. Europe follows closely, exhibiting significant growth potential due to rising adoption among SMEs and increasing investment in digital infrastructure. Asia-Pacific is experiencing rapid expansion, fueled by the growth of e-commerce markets and rising disposable incomes in emerging economies.
- North America: Strong technological innovation, high consumer spending, established e-commerce sector. Market share: xx% in 2025.
- Europe: Increasing SME adoption, investment in digital infrastructure. Market share: xx% in 2025.
- Asia-Pacific: Rapid e-commerce growth, rising disposable incomes. Market share: xx% in 2025.
- Key Drivers: Favorable economic policies, robust digital infrastructure, and high levels of consumer adoption in respective regions.
Product Customization Software Product Landscape
The Product Customization Software market features a diverse range of solutions, from basic configuration tools to sophisticated platforms incorporating AI-powered design and 3D visualization. These solutions offer varying levels of functionality, integration capabilities, and user-friendliness. Key differentiators include the ability to handle complex product configurations, seamless integration with existing e-commerce platforms, robust user interfaces, and advanced analytics capabilities. Technological advancements continuously reshape the product landscape, with a focus on improving user experience, expanding customization options, and enhancing data security.
Key Drivers, Barriers & Challenges in Product Customization Software
Key Drivers:
- The increasing demand for personalized products is a primary driver.
- Technological advancements, including AI and 3D visualization, are making customization more accessible.
- Growing e-commerce adoption is expanding the market reach.
Key Challenges & Restraints:
- High implementation costs for sophisticated platforms can pose a barrier to entry for some businesses.
- Data security concerns and compliance with data privacy regulations represent significant hurdles.
- Intense competition among providers, with varying levels of functionality and pricing, can put pressure on margins. The estimated impact of these challenges results in a xx million units reduction in projected sales over the forecast period.
Emerging Opportunities in Product Customization Software
- Untapped Markets: Expansion into new industries, such as healthcare and construction, presents considerable opportunities.
- Innovative Applications: Integration of AR/VR technologies for enhanced visualization and customer engagement offers significant growth potential.
- Evolving Consumer Preferences: Catering to the growing demand for sustainable and ethically sourced products through customized options creates new avenues for expansion.
Growth Accelerators in the Product Customization Software Industry
Strategic partnerships between software providers and e-commerce platforms are playing a key role in accelerating market growth. Technological breakthroughs, particularly in AI and machine learning, are continuously improving the capabilities of customization software. Market expansion into emerging economies and new industry verticals is also a significant growth accelerator.
Key Players Shaping the Product Customization Software Market
- JTB Custom
- Artifi Labs
- Fluid
- Productimize
- Doogma
- MyCustomizer
- No-Refresh
- InkXE
- Idesignibuy
- Spectrum
- Dolphin Micro
Notable Milestones in Product Customization Software Sector
- 2021, Q3: Introduction of AI-powered design tools by a leading provider.
- 2022, Q1: Major e-commerce platform integrates with a prominent customization software solution.
- 2023, Q2: Acquisition of a smaller customization software provider by a larger enterprise software company.
In-Depth Product Customization Software Market Outlook
The Product Customization Software market is poised for significant growth over the next decade. Continued technological innovation, increasing demand for personalized products, and expansion into new markets will drive market expansion. Strategic partnerships, targeted marketing, and a focus on delivering user-friendly and scalable solutions will be key to success in this dynamic market. The market is expected to reach xx million units by 2033, representing substantial growth opportunities for both established players and new entrants.
Product Customization Software Segmentation
-
1. Application
- 1.1. Large Enterprises
- 1.2. SMEs
-
2. Types
- 2.1. On-Premises
- 2.2. Cloud Based
Product Customization Software Segmentation By Geography
-
1. North America
- 1.1. United States
- 1.2. Canada
- 1.3. Mexico
-
2. South America
- 2.1. Brazil
- 2.2. Argentina
- 2.3. Rest of South America
-
3. Europe
- 3.1. United Kingdom
- 3.2. Germany
- 3.3. France
- 3.4. Italy
- 3.5. Spain
- 3.6. Russia
- 3.7. Benelux
- 3.8. Nordics
- 3.9. Rest of Europe
-
4. Middle East & Africa
- 4.1. Turkey
- 4.2. Israel
- 4.3. GCC
- 4.4. North Africa
- 4.5. South Africa
- 4.6. Rest of Middle East & Africa
-
5. Asia Pacific
- 5.1. China
- 5.2. India
- 5.3. Japan
- 5.4. South Korea
- 5.5. ASEAN
- 5.6. Oceania
- 5.7. Rest of Asia Pacific
Product Customization Software REPORT HIGHLIGHTS
| Aspects | Details |
|---|---|
| Study Period | 2019-2033 |
| Base Year | 2024 |
| Estimated Year | 2025 |
| Forecast Period | 2025-2033 |
| Historical Period | 2019-2024 |
| Growth Rate | CAGR of XX% from 2019-2033 |
| Segmentation |
|
Table of Contents
- 1. Introduction
- 1.1. Research Scope
- 1.2. Market Segmentation
- 1.3. Research Methodology
- 1.4. Definitions and Assumptions
- 2. Executive Summary
- 2.1. Introduction
- 3. Market Dynamics
- 3.1. Introduction
- 3.2. Market Drivers
- 3.3. Market Restrains
- 3.4. Market Trends
- 4. Market Factor Analysis
- 4.1. Porters Five Forces
- 4.2. Supply/Value Chain
- 4.3. PESTEL analysis
- 4.4. Market Entropy
- 4.5. Patent/Trademark Analysis
- 5. Global Product Customization Software Analysis, Insights and Forecast, 2019-2031
- 5.1. Market Analysis, Insights and Forecast - by Application
- 5.1.1. Large Enterprises
- 5.1.2. SMEs
- 5.2. Market Analysis, Insights and Forecast - by Types
- 5.2.1. On-Premises
- 5.2.2. Cloud Based
- 5.3. Market Analysis, Insights and Forecast - by Region
- 5.3.1. North America
- 5.3.2. South America
- 5.3.3. Europe
- 5.3.4. Middle East & Africa
- 5.3.5. Asia Pacific
- 5.1. Market Analysis, Insights and Forecast - by Application
- 6. North America Product Customization Software Analysis, Insights and Forecast, 2019-2031
- 6.1. Market Analysis, Insights and Forecast - by Application
- 6.1.1. Large Enterprises
- 6.1.2. SMEs
- 6.2. Market Analysis, Insights and Forecast - by Types
- 6.2.1. On-Premises
- 6.2.2. Cloud Based
- 6.1. Market Analysis, Insights and Forecast - by Application
- 7. South America Product Customization Software Analysis, Insights and Forecast, 2019-2031
- 7.1. Market Analysis, Insights and Forecast - by Application
- 7.1.1. Large Enterprises
- 7.1.2. SMEs
- 7.2. Market Analysis, Insights and Forecast - by Types
- 7.2.1. On-Premises
- 7.2.2. Cloud Based
- 7.1. Market Analysis, Insights and Forecast - by Application
- 8. Europe Product Customization Software Analysis, Insights and Forecast, 2019-2031
- 8.1. Market Analysis, Insights and Forecast - by Application
- 8.1.1. Large Enterprises
- 8.1.2. SMEs
- 8.2. Market Analysis, Insights and Forecast - by Types
- 8.2.1. On-Premises
- 8.2.2. Cloud Based
- 8.1. Market Analysis, Insights and Forecast - by Application
- 9. Middle East & Africa Product Customization Software Analysis, Insights and Forecast, 2019-2031
- 9.1. Market Analysis, Insights and Forecast - by Application
- 9.1.1. Large Enterprises
- 9.1.2. SMEs
- 9.2. Market Analysis, Insights and Forecast - by Types
- 9.2.1. On-Premises
- 9.2.2. Cloud Based
- 9.1. Market Analysis, Insights and Forecast - by Application
- 10. Asia Pacific Product Customization Software Analysis, Insights and Forecast, 2019-2031
- 10.1. Market Analysis, Insights and Forecast - by Application
- 10.1.1. Large Enterprises
- 10.1.2. SMEs
- 10.2. Market Analysis, Insights and Forecast - by Types
- 10.2.1. On-Premises
- 10.2.2. Cloud Based
- 10.1. Market Analysis, Insights and Forecast - by Application
- 11. Competitive Analysis
- 11.1. Global Market Share Analysis 2024
- 11.2. Company Profiles
- 11.2.1 JTB Custom
- 11.2.1.1. Overview
- 11.2.1.2. Products
- 11.2.1.3. SWOT Analysis
- 11.2.1.4. Recent Developments
- 11.2.1.5. Financials (Based on Availability)
- 11.2.2 Artifi Labs
- 11.2.2.1. Overview
- 11.2.2.2. Products
- 11.2.2.3. SWOT Analysis
- 11.2.2.4. Recent Developments
- 11.2.2.5. Financials (Based on Availability)
- 11.2.3 Fluid
- 11.2.3.1. Overview
- 11.2.3.2. Products
- 11.2.3.3. SWOT Analysis
- 11.2.3.4. Recent Developments
- 11.2.3.5. Financials (Based on Availability)
- 11.2.4 Productimize
- 11.2.4.1. Overview
- 11.2.4.2. Products
- 11.2.4.3. SWOT Analysis
- 11.2.4.4. Recent Developments
- 11.2.4.5. Financials (Based on Availability)
- 11.2.5 Doogma
- 11.2.5.1. Overview
- 11.2.5.2. Products
- 11.2.5.3. SWOT Analysis
- 11.2.5.4. Recent Developments
- 11.2.5.5. Financials (Based on Availability)
- 11.2.6 MyCustomizer
- 11.2.6.1. Overview
- 11.2.6.2. Products
- 11.2.6.3. SWOT Analysis
- 11.2.6.4. Recent Developments
- 11.2.6.5. Financials (Based on Availability)
- 11.2.7 No-Refresh
- 11.2.7.1. Overview
- 11.2.7.2. Products
- 11.2.7.3. SWOT Analysis
- 11.2.7.4. Recent Developments
- 11.2.7.5. Financials (Based on Availability)
- 11.2.8 InkXE
- 11.2.8.1. Overview
- 11.2.8.2. Products
- 11.2.8.3. SWOT Analysis
- 11.2.8.4. Recent Developments
- 11.2.8.5. Financials (Based on Availability)
- 11.2.9 Idesignibuy
- 11.2.9.1. Overview
- 11.2.9.2. Products
- 11.2.9.3. SWOT Analysis
- 11.2.9.4. Recent Developments
- 11.2.9.5. Financials (Based on Availability)
- 11.2.10 Spectrum
- 11.2.10.1. Overview
- 11.2.10.2. Products
- 11.2.10.3. SWOT Analysis
- 11.2.10.4. Recent Developments
- 11.2.10.5. Financials (Based on Availability)
- 11.2.11 Dolphin Micro
- 11.2.11.1. Overview
- 11.2.11.2. Products
- 11.2.11.3. SWOT Analysis
- 11.2.11.4. Recent Developments
- 11.2.11.5. Financials (Based on Availability)
- 11.2.1 JTB Custom
List of Figures
- Figure 1: Global Product Customization Software Revenue Breakdown (million, %) by Region 2024 & 2032
- Figure 2: North America Product Customization Software Revenue (million), by Application 2024 & 2032
- Figure 3: North America Product Customization Software Revenue Share (%), by Application 2024 & 2032
- Figure 4: North America Product Customization Software Revenue (million), by Types 2024 & 2032
- Figure 5: North America Product Customization Software Revenue Share (%), by Types 2024 & 2032
- Figure 6: North America Product Customization Software Revenue (million), by Country 2024 & 2032
- Figure 7: North America Product Customization Software Revenue Share (%), by Country 2024 & 2032
- Figure 8: South America Product Customization Software Revenue (million), by Application 2024 & 2032
- Figure 9: South America Product Customization Software Revenue Share (%), by Application 2024 & 2032
- Figure 10: South America Product Customization Software Revenue (million), by Types 2024 & 2032
- Figure 11: South America Product Customization Software Revenue Share (%), by Types 2024 & 2032
- Figure 12: South America Product Customization Software Revenue (million), by Country 2024 & 2032
- Figure 13: South America Product Customization Software Revenue Share (%), by Country 2024 & 2032
- Figure 14: Europe Product Customization Software Revenue (million), by Application 2024 & 2032
- Figure 15: Europe Product Customization Software Revenue Share (%), by Application 2024 & 2032
- Figure 16: Europe Product Customization Software Revenue (million), by Types 2024 & 2032
- Figure 17: Europe Product Customization Software Revenue Share (%), by Types 2024 & 2032
- Figure 18: Europe Product Customization Software Revenue (million), by Country 2024 & 2032
- Figure 19: Europe Product Customization Software Revenue Share (%), by Country 2024 & 2032
- Figure 20: Middle East & Africa Product Customization Software Revenue (million), by Application 2024 & 2032
- Figure 21: Middle East & Africa Product Customization Software Revenue Share (%), by Application 2024 & 2032
- Figure 22: Middle East & Africa Product Customization Software Revenue (million), by Types 2024 & 2032
- Figure 23: Middle East & Africa Product Customization Software Revenue Share (%), by Types 2024 & 2032
- Figure 24: Middle East & Africa Product Customization Software Revenue (million), by Country 2024 & 2032
- Figure 25: Middle East & Africa Product Customization Software Revenue Share (%), by Country 2024 & 2032
- Figure 26: Asia Pacific Product Customization Software Revenue (million), by Application 2024 & 2032
- Figure 27: Asia Pacific Product Customization Software Revenue Share (%), by Application 2024 & 2032
- Figure 28: Asia Pacific Product Customization Software Revenue (million), by Types 2024 & 2032
- Figure 29: Asia Pacific Product Customization Software Revenue Share (%), by Types 2024 & 2032
- Figure 30: Asia Pacific Product Customization Software Revenue (million), by Country 2024 & 2032
- Figure 31: Asia Pacific Product Customization Software Revenue Share (%), by Country 2024 & 2032
List of Tables
- Table 1: Global Product Customization Software Revenue million Forecast, by Region 2019 & 2032
- Table 2: Global Product Customization Software Revenue million Forecast, by Application 2019 & 2032
- Table 3: Global Product Customization Software Revenue million Forecast, by Types 2019 & 2032
- Table 4: Global Product Customization Software Revenue million Forecast, by Region 2019 & 2032
- Table 5: Global Product Customization Software Revenue million Forecast, by Application 2019 & 2032
- Table 6: Global Product Customization Software Revenue million Forecast, by Types 2019 & 2032
- Table 7: Global Product Customization Software Revenue million Forecast, by Country 2019 & 2032
- Table 8: United States Product Customization Software Revenue (million) Forecast, by Application 2019 & 2032
- Table 9: Canada Product Customization Software Revenue (million) Forecast, by Application 2019 & 2032
- Table 10: Mexico Product Customization Software Revenue (million) Forecast, by Application 2019 & 2032
- Table 11: Global Product Customization Software Revenue million Forecast, by Application 2019 & 2032
- Table 12: Global Product Customization Software Revenue million Forecast, by Types 2019 & 2032
- Table 13: Global Product Customization Software Revenue million Forecast, by Country 2019 & 2032
- Table 14: Brazil Product Customization Software Revenue (million) Forecast, by Application 2019 & 2032
- Table 15: Argentina Product Customization Software Revenue (million) Forecast, by Application 2019 & 2032
- Table 16: Rest of South America Product Customization Software Revenue (million) Forecast, by Application 2019 & 2032
- Table 17: Global Product Customization Software Revenue million Forecast, by Application 2019 & 2032
- Table 18: Global Product Customization Software Revenue million Forecast, by Types 2019 & 2032
- Table 19: Global Product Customization Software Revenue million Forecast, by Country 2019 & 2032
- Table 20: United Kingdom Product Customization Software Revenue (million) Forecast, by Application 2019 & 2032
- Table 21: Germany Product Customization Software Revenue (million) Forecast, by Application 2019 & 2032
- Table 22: France Product Customization Software Revenue (million) Forecast, by Application 2019 & 2032
- Table 23: Italy Product Customization Software Revenue (million) Forecast, by Application 2019 & 2032
- Table 24: Spain Product Customization Software Revenue (million) Forecast, by Application 2019 & 2032
- Table 25: Russia Product Customization Software Revenue (million) Forecast, by Application 2019 & 2032
- Table 26: Benelux Product Customization Software Revenue (million) Forecast, by Application 2019 & 2032
- Table 27: Nordics Product Customization Software Revenue (million) Forecast, by Application 2019 & 2032
- Table 28: Rest of Europe Product Customization Software Revenue (million) Forecast, by Application 2019 & 2032
- Table 29: Global Product Customization Software Revenue million Forecast, by Application 2019 & 2032
- Table 30: Global Product Customization Software Revenue million Forecast, by Types 2019 & 2032
- Table 31: Global Product Customization Software Revenue million Forecast, by Country 2019 & 2032
- Table 32: Turkey Product Customization Software Revenue (million) Forecast, by Application 2019 & 2032
- Table 33: Israel Product Customization Software Revenue (million) Forecast, by Application 2019 & 2032
- Table 34: GCC Product Customization Software Revenue (million) Forecast, by Application 2019 & 2032
- Table 35: North Africa Product Customization Software Revenue (million) Forecast, by Application 2019 & 2032
- Table 36: South Africa Product Customization Software Revenue (million) Forecast, by Application 2019 & 2032
- Table 37: Rest of Middle East & Africa Product Customization Software Revenue (million) Forecast, by Application 2019 & 2032
- Table 38: Global Product Customization Software Revenue million Forecast, by Application 2019 & 2032
- Table 39: Global Product Customization Software Revenue million Forecast, by Types 2019 & 2032
- Table 40: Global Product Customization Software Revenue million Forecast, by Country 2019 & 2032
- Table 41: China Product Customization Software Revenue (million) Forecast, by Application 2019 & 2032
- Table 42: India Product Customization Software Revenue (million) Forecast, by Application 2019 & 2032
- Table 43: Japan Product Customization Software Revenue (million) Forecast, by Application 2019 & 2032
- Table 44: South Korea Product Customization Software Revenue (million) Forecast, by Application 2019 & 2032
- Table 45: ASEAN Product Customization Software Revenue (million) Forecast, by Application 2019 & 2032
- Table 46: Oceania Product Customization Software Revenue (million) Forecast, by Application 2019 & 2032
- Table 47: Rest of Asia Pacific Product Customization Software Revenue (million) Forecast, by Application 2019 & 2032
Frequently Asked Questions
1. What is the projected Compound Annual Growth Rate (CAGR) of the Product Customization Software?
The projected CAGR is approximately XX%.
2. Which companies are prominent players in the Product Customization Software?
Key companies in the market include JTB Custom, Artifi Labs, Fluid, Productimize, Doogma, MyCustomizer, No-Refresh, InkXE, Idesignibuy, Spectrum, Dolphin Micro.
3. What are the main segments of the Product Customization Software?
The market segments include Application, Types.
4. Can you provide details about the market size?
The market size is estimated to be USD XXX million as of 2022.
5. What are some drivers contributing to market growth?
N/A
6. What are the notable trends driving market growth?
N/A
7. Are there any restraints impacting market growth?
N/A
8. Can you provide examples of recent developments in the market?
N/A
9. What pricing options are available for accessing the report?
Pricing options include single-user, multi-user, and enterprise licenses priced at USD 2900.00, USD 4350.00, and USD 5800.00 respectively.
10. Is the market size provided in terms of value or volume?
The market size is provided in terms of value, measured in million.
11. Are there any specific market keywords associated with the report?
Yes, the market keyword associated with the report is "Product Customization Software," which aids in identifying and referencing the specific market segment covered.
12. How do I determine which pricing option suits my needs best?
The pricing options vary based on user requirements and access needs. Individual users may opt for single-user licenses, while businesses requiring broader access may choose multi-user or enterprise licenses for cost-effective access to the report.
13. Are there any additional resources or data provided in the Product Customization Software report?
While the report offers comprehensive insights, it's advisable to review the specific contents or supplementary materials provided to ascertain if additional resources or data are available.
14. How can I stay updated on further developments or reports in the Product Customization Software?
To stay informed about further developments, trends, and reports in the Product Customization Software, consider subscribing to industry newsletters, following relevant companies and organizations, or regularly checking reputable industry news sources and publications.
Methodology
Step 1 - Identification of Relevant Samples Size from Population Database


Step 2 - Approaches for Defining Global Market Size (Value, Volume* & Price*)

Note*: In applicable scenarios
Step 3 - Data Sources
Primary Research
- Web Analytics
- Survey Reports
- Research Institute
- Latest Research Reports
- Opinion Leaders
Secondary Research
- Annual Reports
- White Paper
- Latest Press Release
- Industry Association
- Paid Database
- Investor Presentations

Step 4 - Data Triangulation
Involves using different sources of information in order to increase the validity of a study
These sources are likely to be stakeholders in a program - participants, other researchers, program staff, other community members, and so on.
Then we put all data in single framework & apply various statistical tools to find out the dynamic on the market.
During the analysis stage, feedback from the stakeholder groups would be compared to determine areas of agreement as well as areas of divergence


