

Key Insights
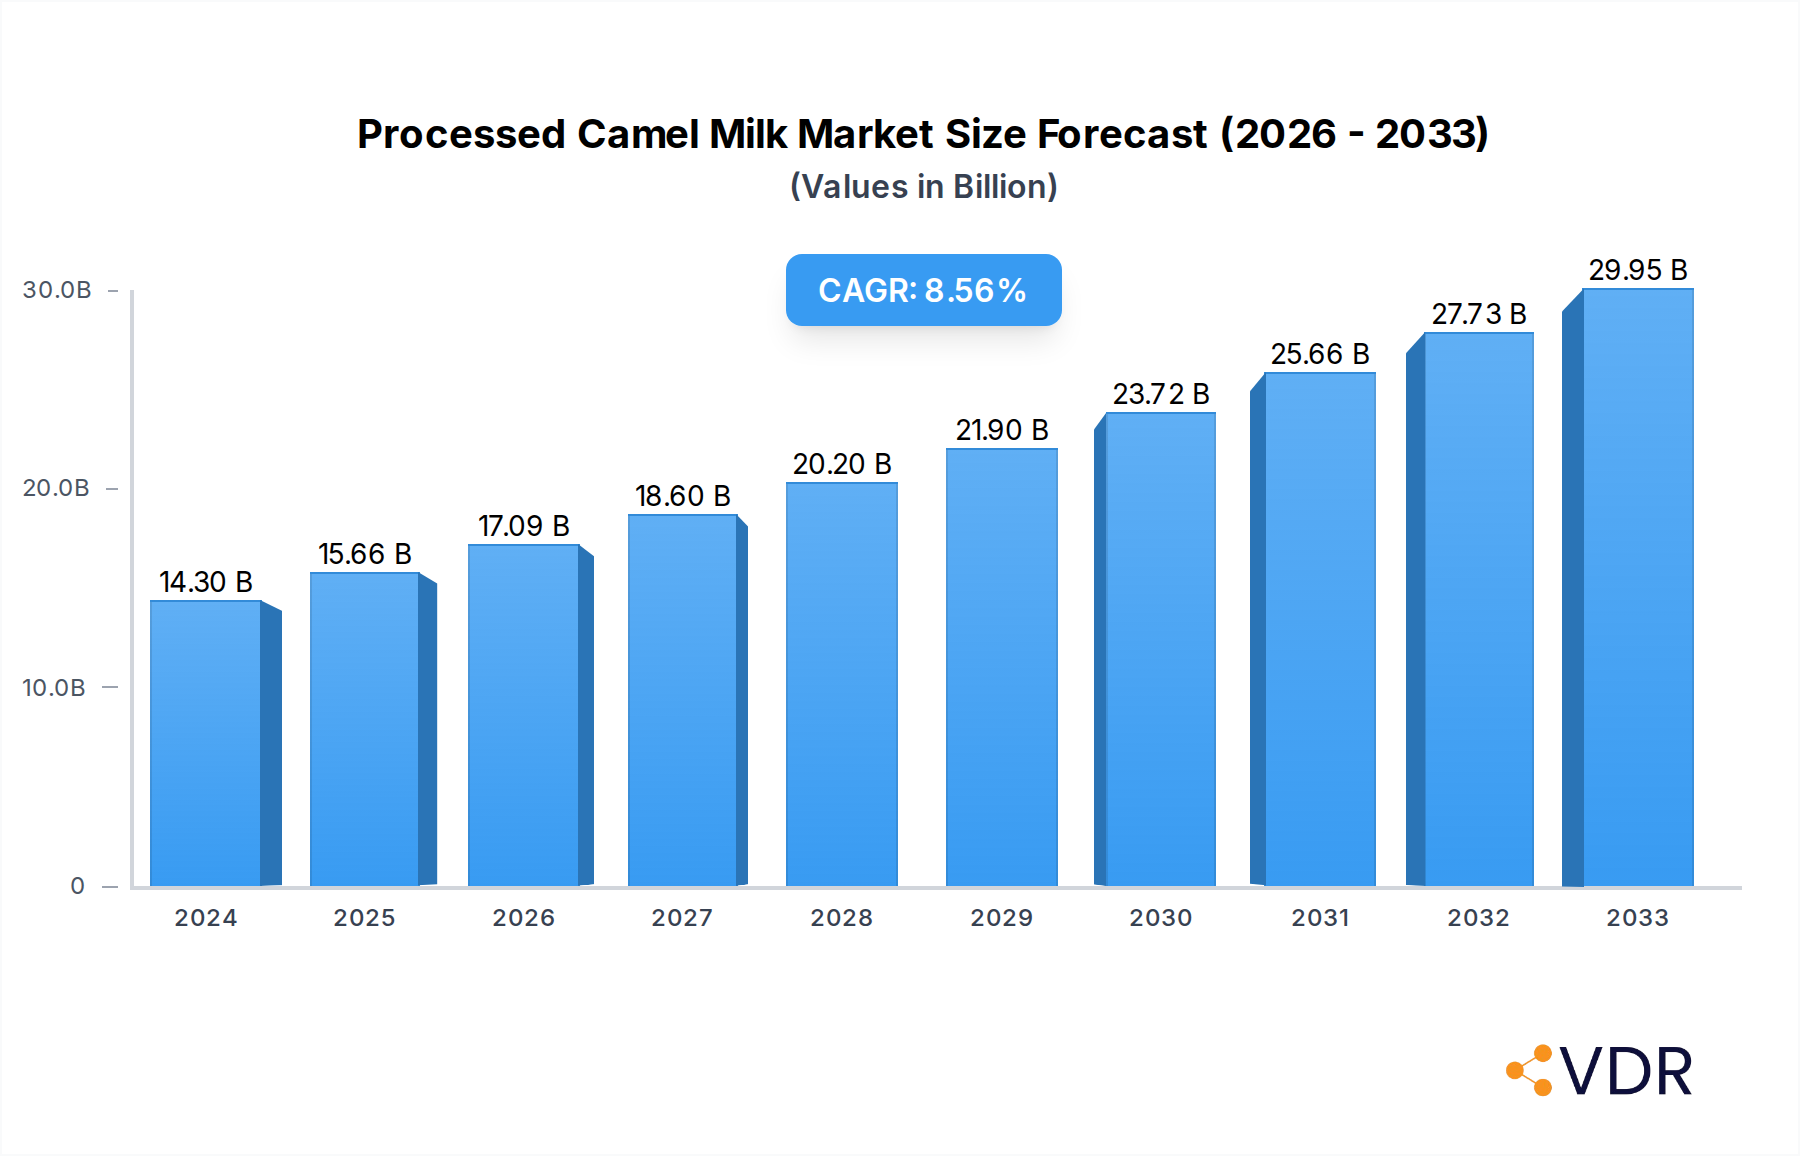
The global processed camel milk market is poised for robust expansion, with an estimated market size of USD 14.3 billion in 2024 and a projected Compound Annual Growth Rate (CAGR) of 9.4% during the forecast period of 2025-2033. This significant growth is fueled by a confluence of factors, including increasing consumer awareness regarding the unique nutritional benefits of camel milk, such as its high vitamin and mineral content and its potential as a hypoallergenic alternative to cow's milk. The rising prevalence of lactose intolerance and dairy allergies globally further propels demand for camel milk products. Furthermore, advancements in processing and preservation technologies are enhancing the shelf-life and accessibility of camel milk, making it a more viable option for a wider consumer base. The market is witnessing a steady shift towards value-added products, with a growing emphasis on organic and functional camel milk beverages.

Processed Camel Milk Market Size (In Billion)
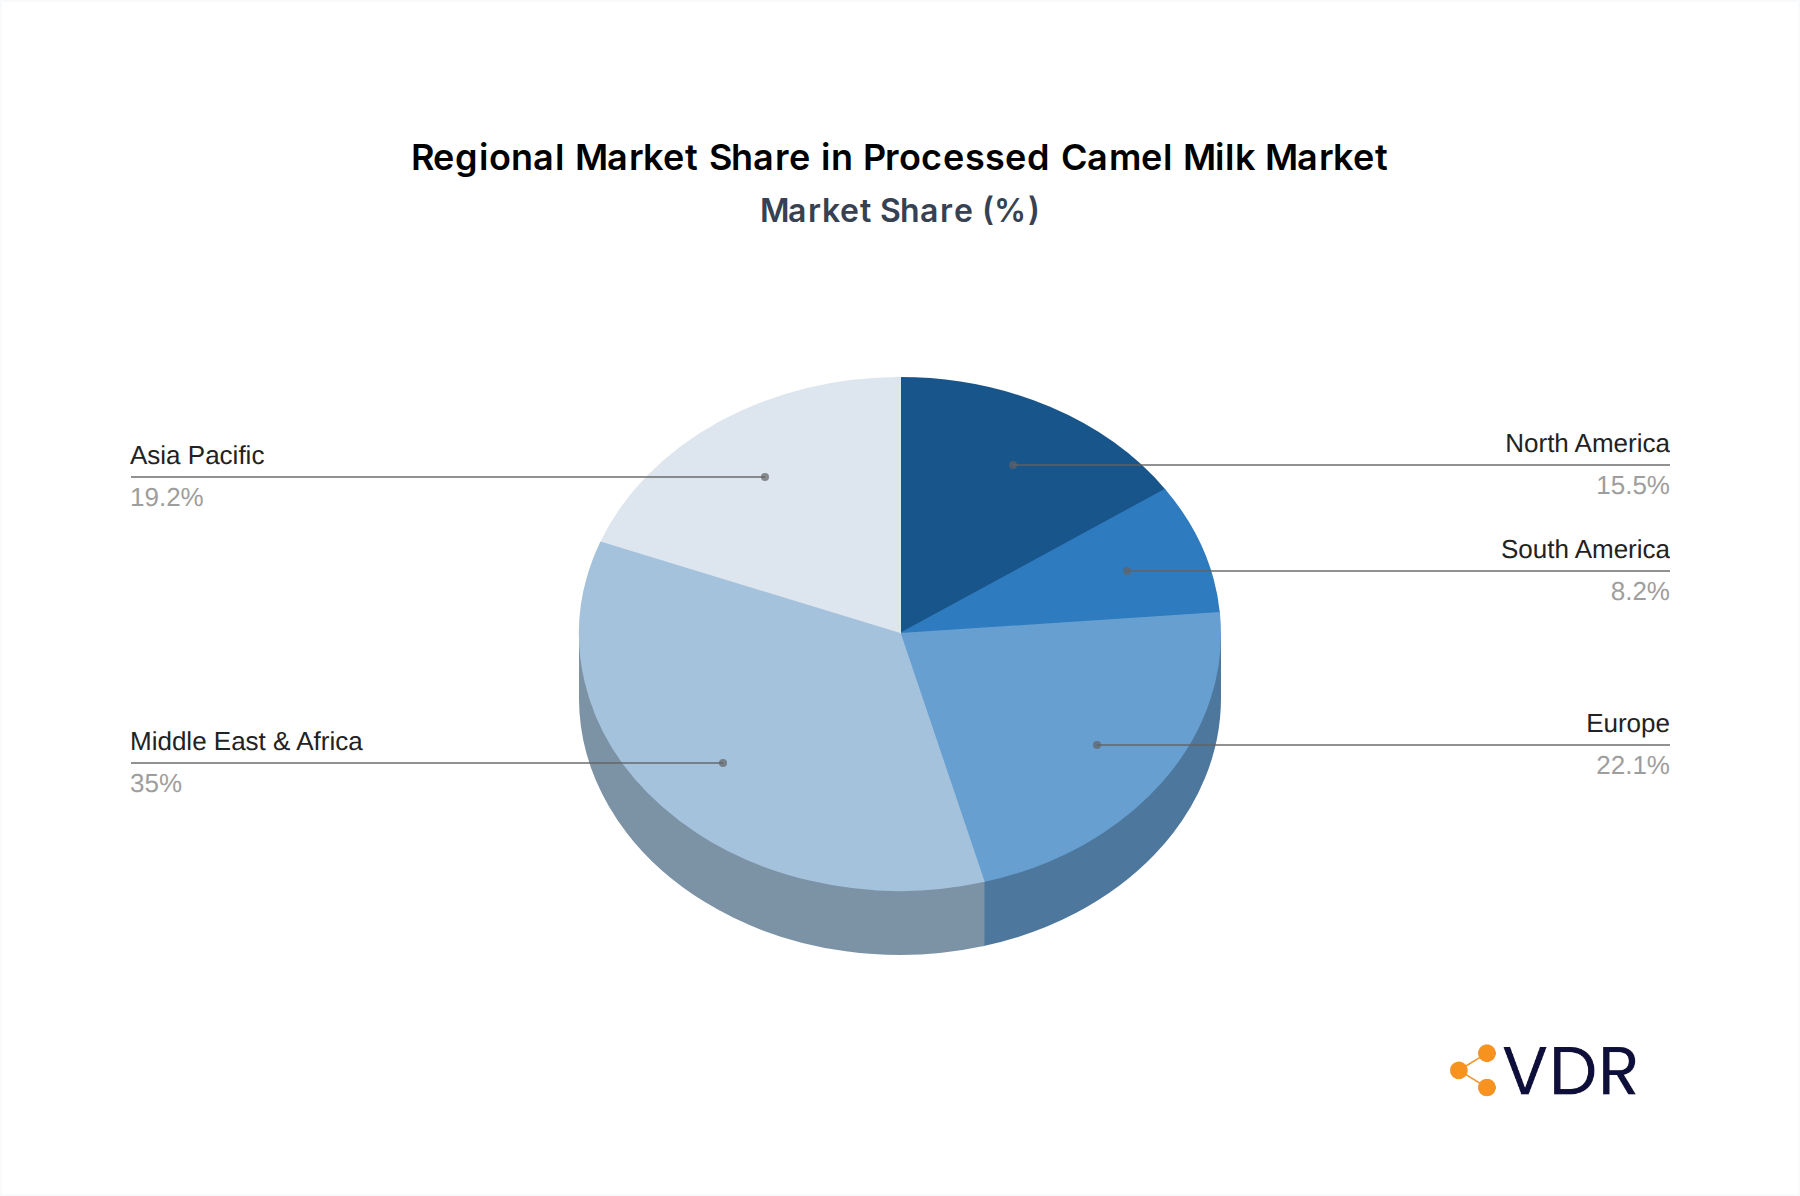
The market is segmented into Online Sales and Offline Sales, with online channels demonstrating a particularly strong growth trajectory due to the convenience and reach they offer. In terms of product types, Bottled and Canned segments are prominent, catering to diverse consumer preferences and usage occasions. Key market players such as Desert Farms, Al Nassma, and Al Ain Farms are actively innovating and expanding their product portfolios, investing in research and development to unlock further applications for camel milk. Geographically, the Middle East & Africa region currently holds a significant market share, attributed to the traditional consumption of camel milk in these areas. However, the Asia Pacific and North America regions are expected to exhibit substantial growth, driven by increasing adoption and market penetration. Emerging trends include the development of camel milk-based infant formula and sports nutrition products, signifying the growing versatility and market potential of this niche dairy segment.
Processed Camel Milk Company Market Share
This in-depth report provides a detailed analysis of the global processed camel milk market, encompassing market dynamics, growth trends, regional dominance, product landscape, key drivers, barriers, challenges, emerging opportunities, and future outlook. With a study period from 2019 to 2033, a base year of 2025, and a forecast period spanning 2025–2033, this report offers critical insights for industry stakeholders, investors, and strategic planners. The analysis incorporates high-traffic keywords such as "camel milk benefits," "camel milk nutrition," "organic camel milk," "camel milk powder," "camel milk products," and "dairy alternatives" to maximize search engine visibility. The report also addresses parent and child market perspectives, providing a holistic view of the industry's ecosystem. All monetary values are presented in billions of US dollars.
Processed Camel Milk Market Dynamics & Structure
The processed camel milk market exhibits a moderately concentrated structure, characterized by the presence of established players and emerging niche brands. Technological innovation is a significant driver, with advancements in processing techniques like UHT treatment, pasteurization, and freeze-drying enhancing shelf-life and product accessibility. Regulatory frameworks, particularly concerning food safety standards and labeling, play a crucial role in shaping market entry and product development. Competitive product substitutes, primarily from cow's milk and plant-based alternatives, present a constant challenge, necessitating a focus on camel milk's unique nutritional profile and health benefits. End-user demographics are increasingly shifting towards health-conscious consumers, individuals with lactose intolerance, and those seeking novel dairy options. Mergers and acquisitions (M&A) trends are moderately active, driven by strategic partnerships aimed at expanding market reach and product portfolios.
- Market Concentration: Estimated to be moderately consolidated, with top 5 players holding approximately 45% market share by 2025.
- Technological Innovation: Focus on advanced preservation techniques and product diversification (e.g., camel milk yogurt, cheese).
- Regulatory Frameworks: Adherence to international food safety standards (e.g., HACCP, ISO) is paramount.
- Competitive Product Substitutes: Cow's milk ($140 billion parent market), plant-based milk alternatives ($25 billion child market) pose significant competition.
- End-User Demographics: Growing interest from health-conscious consumers, allergy sufferers, and consumers in the Middle East and North Africa (MENA) region.
- M&A Trends: Increasing strategic alliances and acquisitions to gain market share and R&D capabilities.
Processed Camel Milk Growth Trends & Insights
The global processed camel milk market is poised for robust growth, driven by increasing consumer awareness of its distinct nutritional advantages and health benefits. The market size is projected to expand significantly from approximately $3.5 billion in 2025, with a compound annual growth rate (CAGR) of XX% expected between 2025 and 2033. Adoption rates are steadily rising, particularly in regions beyond the traditional camel milk-consuming areas. Technological disruptions in processing and packaging are enhancing product availability and shelf-life, thereby expanding market penetration. Consumer behavior shifts are a key accelerator, with a growing preference for natural, functional foods and an increasing demand for novel dairy alternatives. The market's trajectory will be influenced by expanding distribution channels, both online and offline, and the growing acceptance of camel milk-based products in mainstream food and beverage categories.
- Market Size Evolution: Projected to reach over $7.0 billion by 2033.
- Adoption Rates: Significant increase in adoption beyond traditional markets, particularly in North America and Europe.
- Technological Disruptions: Innovations in pasteurization, freeze-drying, and encapsulation technologies improving product quality and longevity.
- Consumer Behavior Shifts: Growing demand for lactose-free and nutrient-dense alternatives, driven by health and wellness trends.
- Market Penetration: Expected to climb from an estimated 8% in 2025 to over 15% by 2033 in key target markets.
Dominant Regions, Countries, or Segments in Processed Camel Milk
The Middle East and North Africa (MENA) region currently dominates the processed camel milk market, owing to its deep-rooted cultural acceptance and established camel husbandry practices. Within the MENA region, countries like the United Arab Emirates (UAE), Saudi Arabia, and Qatar are leading the consumption and production of processed camel milk. The offline sales segment, encompassing supermarkets, hypermarkets, and specialty stores, remains the predominant distribution channel, driven by established retail infrastructure and consumer purchasing habits. However, online sales are rapidly gaining traction, fueled by the convenience offered by e-commerce platforms and the increasing digital penetration in these regions. The bottled segment holds a larger market share within the 'Types' category, primarily due to its perceived freshness and ease of consumption.
- Dominant Region: Middle East & North Africa (MENA)
- Market Share: Accounted for approximately 55% of the global processed camel milk market in 2025.
- Key Drivers: Cultural significance, traditional consumption, government support for camel farming, and growing health tourism.
- Country Focus: UAE, Saudi Arabia, Qatar, Oman.
- Dominant Segment (Application): Offline Sales
- Market Share: Estimated at 70% of the total market in 2025.
- Key Drivers: Established retail networks, consumer trust in physical stores, and impulse purchasing.
- Growth Potential: Steady growth, with increasing penetration of modern retail formats.
- Dominant Segment (Type): Bottled
- Market Share: Estimated at 60% of the total market in 2025.
- Key Drivers: Consumer preference for ready-to-drink formats, perceived hygiene, and extended shelf life through advanced bottling techniques.
- Growth Potential: Stable growth, with innovation in packaging to enhance portability and preservation.
Processed Camel Milk Product Landscape
The processed camel milk market is witnessing a surge in product innovation, catering to diverse consumer needs and preferences. Beyond traditional liquid milk, the landscape now features powdered camel milk, offering extended shelf-life and convenience for consumers globally. Functional camel milk products, such as camel milk-based infant formula and dietary supplements, are gaining traction, leveraging the milk's unique nutritional profile, including higher levels of Vitamin C and iron. Freeze-dried camel milk powder, a significant innovation, preserves the milk's natural nutrients and enzymes, making it a premium offering. Applications are expanding into the food and beverage industry, with camel milk being incorporated into ice creams, yogurts, and baked goods, presenting a unique selling proposition of health and novelty.
Key Drivers, Barriers & Challenges in Processed Camel Milk
Key Drivers:
- Growing Health Consciousness: Increasing consumer awareness of camel milk's nutritional benefits, including its suitability for lactose-intolerant individuals and its potential therapeutic properties.
- Demand for Natural and Functional Foods: A global trend favoring minimally processed, nutrient-rich food products.
- Rising Disposable Incomes: Enabling consumers in emerging markets to explore premium and novel food options.
- Technological Advancements: Improved processing and preservation techniques extending shelf life and enhancing product accessibility.
Key Barriers & Challenges:
- Supply Chain Limitations: Limited camel populations in non-traditional regions and challenges in establishing consistent, large-scale milk collection and processing infrastructure.
- High Production Costs: Camel milk production is generally more expensive compared to cow's milk, impacting retail pricing.
- Consumer Perception and Awareness: In many Western markets, camel milk is still considered a novel product, requiring significant consumer education and marketing efforts.
- Regulatory Hurdles: Navigating diverse food safety and import regulations across different countries can be complex and costly.
- Competition from Established Dairy and Plant-Based Alternatives: Facing entrenched market share of cow's milk and a rapidly growing plant-based milk market.
Emerging Opportunities in Processed Camel Milk
The processed camel milk industry is ripe with emerging opportunities, particularly in the development of specialized infant formulas, catering to the growing demand for hypoallergenic alternatives. The expansion of camel milk into functional food and beverage segments, such as protein bars and smoothies, presents a significant growth avenue. Furthermore, untapped markets in Asia-Pacific and parts of South America offer substantial potential for market penetration, driven by increasing disposable incomes and a growing interest in health and wellness products. E-commerce and direct-to-consumer (DTC) models are also emerging as crucial channels to reach a wider, geographically dispersed consumer base, bypassing traditional retail limitations.
Growth Accelerators in the Processed Camel Milk Industry
Long-term growth in the processed camel milk industry will be propelled by strategic collaborations between camel milk producers and established food and beverage conglomerates. Technological breakthroughs in camel breeding and milk production efficiency will be critical in reducing costs and scaling up supply. Market expansion strategies targeting health-focused segments, including sports nutrition and specialized dietary needs, will further accelerate adoption. Investment in research and development (R&D) to uncover and validate additional health benefits of camel milk will significantly bolster its market appeal and demand.
Key Players Shaping the Processed Camel Milk Market
- Desert Farms
- Al Nassma
- Al Ain Farms
- Camelicious
- Camilk
- Amul
- Nuug Camel
- VITAL Camel Milk
- Tiviski Dairy
Notable Milestones in Processed Camel Milk Sector
- 2020: Launch of camel milk-based infant formula by a major player, targeting the niche allergy-sensitive market.
- 2021: Significant investment in R&D for freeze-drying camel milk technology, improving product stability and nutrient retention.
- 2022: Expansion of online sales channels by several key companies, reaching a broader international customer base.
- 2023: Introduction of camel milk-infused snacks and confectionery products, diversifying product applications.
- 2024: Increased regulatory approvals for camel milk products in key European markets, easing market entry.
In-Depth Processed Camel Milk Market Outlook
The future outlook for the processed camel milk market is exceptionally promising, driven by a confluence of factors including escalating consumer demand for natural and healthy alternatives, coupled with continuous product innovation. Growth accelerators such as technological advancements in processing and supply chain optimization, alongside strategic market expansion into underserved regions, will be pivotal. The market's trajectory indicates a sustained upward trend, presenting lucrative opportunities for stakeholders to capitalize on the growing awareness of camel milk's unique nutritional profile and health benefits. Strategic partnerships and focused marketing efforts will be key to unlocking the full potential of this dynamic and evolving industry.
Processed Camel Milk Segmentation
-
1. Application
- 1.1. Online Sales
- 1.2. Offline Sales
-
2. Types
- 2.1. Bottled
- 2.2. Canned
Processed Camel Milk Segmentation By Geography
-
1. North America
- 1.1. United States
- 1.2. Canada
- 1.3. Mexico
-
2. South America
- 2.1. Brazil
- 2.2. Argentina
- 2.3. Rest of South America
-
3. Europe
- 3.1. United Kingdom
- 3.2. Germany
- 3.3. France
- 3.4. Italy
- 3.5. Spain
- 3.6. Russia
- 3.7. Benelux
- 3.8. Nordics
- 3.9. Rest of Europe
-
4. Middle East & Africa
- 4.1. Turkey
- 4.2. Israel
- 4.3. GCC
- 4.4. North Africa
- 4.5. South Africa
- 4.6. Rest of Middle East & Africa
-
5. Asia Pacific
- 5.1. China
- 5.2. India
- 5.3. Japan
- 5.4. South Korea
- 5.5. ASEAN
- 5.6. Oceania
- 5.7. Rest of Asia Pacific
Processed Camel Milk Regional Market Share
Geographic Coverage of Processed Camel Milk
Processed Camel Milk REPORT HIGHLIGHTS
| Aspects | Details |
|---|---|
| Study Period | 2020-2034 |
| Base Year | 2025 |
| Estimated Year | 2026 |
| Forecast Period | 2026-2034 |
| Historical Period | 2020-2025 |
| Growth Rate | CAGR of 9.4% from 2020-2034 |
| Segmentation |
|
Table of Contents
- 1. Introduction
- 1.1. Research Scope
- 1.2. Market Segmentation
- 1.3. Research Methodology
- 1.4. Definitions and Assumptions
- 2. Executive Summary
- 2.1. Introduction
- 3. Market Dynamics
- 3.1. Introduction
- 3.2. Market Drivers
- 3.3. Market Restrains
- 3.4. Market Trends
- 4. Market Factor Analysis
- 4.1. Porters Five Forces
- 4.2. Supply/Value Chain
- 4.3. PESTEL analysis
- 4.4. Market Entropy
- 4.5. Patent/Trademark Analysis
- 5. Global Processed Camel Milk Analysis, Insights and Forecast, 2020-2032
- 5.1. Market Analysis, Insights and Forecast - by Application
- 5.1.1. Online Sales
- 5.1.2. Offline Sales
- 5.2. Market Analysis, Insights and Forecast - by Types
- 5.2.1. Bottled
- 5.2.2. Canned
- 5.3. Market Analysis, Insights and Forecast - by Region
- 5.3.1. North America
- 5.3.2. South America
- 5.3.3. Europe
- 5.3.4. Middle East & Africa
- 5.3.5. Asia Pacific
- 5.1. Market Analysis, Insights and Forecast - by Application
- 6. North America Processed Camel Milk Analysis, Insights and Forecast, 2020-2032
- 6.1. Market Analysis, Insights and Forecast - by Application
- 6.1.1. Online Sales
- 6.1.2. Offline Sales
- 6.2. Market Analysis, Insights and Forecast - by Types
- 6.2.1. Bottled
- 6.2.2. Canned
- 6.1. Market Analysis, Insights and Forecast - by Application
- 7. South America Processed Camel Milk Analysis, Insights and Forecast, 2020-2032
- 7.1. Market Analysis, Insights and Forecast - by Application
- 7.1.1. Online Sales
- 7.1.2. Offline Sales
- 7.2. Market Analysis, Insights and Forecast - by Types
- 7.2.1. Bottled
- 7.2.2. Canned
- 7.1. Market Analysis, Insights and Forecast - by Application
- 8. Europe Processed Camel Milk Analysis, Insights and Forecast, 2020-2032
- 8.1. Market Analysis, Insights and Forecast - by Application
- 8.1.1. Online Sales
- 8.1.2. Offline Sales
- 8.2. Market Analysis, Insights and Forecast - by Types
- 8.2.1. Bottled
- 8.2.2. Canned
- 8.1. Market Analysis, Insights and Forecast - by Application
- 9. Middle East & Africa Processed Camel Milk Analysis, Insights and Forecast, 2020-2032
- 9.1. Market Analysis, Insights and Forecast - by Application
- 9.1.1. Online Sales
- 9.1.2. Offline Sales
- 9.2. Market Analysis, Insights and Forecast - by Types
- 9.2.1. Bottled
- 9.2.2. Canned
- 9.1. Market Analysis, Insights and Forecast - by Application
- 10. Asia Pacific Processed Camel Milk Analysis, Insights and Forecast, 2020-2032
- 10.1. Market Analysis, Insights and Forecast - by Application
- 10.1.1. Online Sales
- 10.1.2. Offline Sales
- 10.2. Market Analysis, Insights and Forecast - by Types
- 10.2.1. Bottled
- 10.2.2. Canned
- 10.1. Market Analysis, Insights and Forecast - by Application
- 11. Competitive Analysis
- 11.1. Global Market Share Analysis 2025
- 11.2. Company Profiles
- 11.2.1 Desert Farms
- 11.2.1.1. Overview
- 11.2.1.2. Products
- 11.2.1.3. SWOT Analysis
- 11.2.1.4. Recent Developments
- 11.2.1.5. Financials (Based on Availability)
- 11.2.2 Al Nassma
- 11.2.2.1. Overview
- 11.2.2.2. Products
- 11.2.2.3. SWOT Analysis
- 11.2.2.4. Recent Developments
- 11.2.2.5. Financials (Based on Availability)
- 11.2.3 Al Ain Farms
- 11.2.3.1. Overview
- 11.2.3.2. Products
- 11.2.3.3. SWOT Analysis
- 11.2.3.4. Recent Developments
- 11.2.3.5. Financials (Based on Availability)
- 11.2.4 Camelicious
- 11.2.4.1. Overview
- 11.2.4.2. Products
- 11.2.4.3. SWOT Analysis
- 11.2.4.4. Recent Developments
- 11.2.4.5. Financials (Based on Availability)
- 11.2.5 Camilk
- 11.2.5.1. Overview
- 11.2.5.2. Products
- 11.2.5.3. SWOT Analysis
- 11.2.5.4. Recent Developments
- 11.2.5.5. Financials (Based on Availability)
- 11.2.6 Amul
- 11.2.6.1. Overview
- 11.2.6.2. Products
- 11.2.6.3. SWOT Analysis
- 11.2.6.4. Recent Developments
- 11.2.6.5. Financials (Based on Availability)
- 11.2.7 Nuug Camel
- 11.2.7.1. Overview
- 11.2.7.2. Products
- 11.2.7.3. SWOT Analysis
- 11.2.7.4. Recent Developments
- 11.2.7.5. Financials (Based on Availability)
- 11.2.8 VITAL Camel Milk
- 11.2.8.1. Overview
- 11.2.8.2. Products
- 11.2.8.3. SWOT Analysis
- 11.2.8.4. Recent Developments
- 11.2.8.5. Financials (Based on Availability)
- 11.2.9 Tiviski Dairy
- 11.2.9.1. Overview
- 11.2.9.2. Products
- 11.2.9.3. SWOT Analysis
- 11.2.9.4. Recent Developments
- 11.2.9.5. Financials (Based on Availability)
- 11.2.1 Desert Farms
List of Figures
- Figure 1: Global Processed Camel Milk Revenue Breakdown (undefined, %) by Region 2025 & 2033
- Figure 2: Global Processed Camel Milk Volume Breakdown (K, %) by Region 2025 & 2033
- Figure 3: North America Processed Camel Milk Revenue (undefined), by Application 2025 & 2033
- Figure 4: North America Processed Camel Milk Volume (K), by Application 2025 & 2033
- Figure 5: North America Processed Camel Milk Revenue Share (%), by Application 2025 & 2033
- Figure 6: North America Processed Camel Milk Volume Share (%), by Application 2025 & 2033
- Figure 7: North America Processed Camel Milk Revenue (undefined), by Types 2025 & 2033
- Figure 8: North America Processed Camel Milk Volume (K), by Types 2025 & 2033
- Figure 9: North America Processed Camel Milk Revenue Share (%), by Types 2025 & 2033
- Figure 10: North America Processed Camel Milk Volume Share (%), by Types 2025 & 2033
- Figure 11: North America Processed Camel Milk Revenue (undefined), by Country 2025 & 2033
- Figure 12: North America Processed Camel Milk Volume (K), by Country 2025 & 2033
- Figure 13: North America Processed Camel Milk Revenue Share (%), by Country 2025 & 2033
- Figure 14: North America Processed Camel Milk Volume Share (%), by Country 2025 & 2033
- Figure 15: South America Processed Camel Milk Revenue (undefined), by Application 2025 & 2033
- Figure 16: South America Processed Camel Milk Volume (K), by Application 2025 & 2033
- Figure 17: South America Processed Camel Milk Revenue Share (%), by Application 2025 & 2033
- Figure 18: South America Processed Camel Milk Volume Share (%), by Application 2025 & 2033
- Figure 19: South America Processed Camel Milk Revenue (undefined), by Types 2025 & 2033
- Figure 20: South America Processed Camel Milk Volume (K), by Types 2025 & 2033
- Figure 21: South America Processed Camel Milk Revenue Share (%), by Types 2025 & 2033
- Figure 22: South America Processed Camel Milk Volume Share (%), by Types 2025 & 2033
- Figure 23: South America Processed Camel Milk Revenue (undefined), by Country 2025 & 2033
- Figure 24: South America Processed Camel Milk Volume (K), by Country 2025 & 2033
- Figure 25: South America Processed Camel Milk Revenue Share (%), by Country 2025 & 2033
- Figure 26: South America Processed Camel Milk Volume Share (%), by Country 2025 & 2033
- Figure 27: Europe Processed Camel Milk Revenue (undefined), by Application 2025 & 2033
- Figure 28: Europe Processed Camel Milk Volume (K), by Application 2025 & 2033
- Figure 29: Europe Processed Camel Milk Revenue Share (%), by Application 2025 & 2033
- Figure 30: Europe Processed Camel Milk Volume Share (%), by Application 2025 & 2033
- Figure 31: Europe Processed Camel Milk Revenue (undefined), by Types 2025 & 2033
- Figure 32: Europe Processed Camel Milk Volume (K), by Types 2025 & 2033
- Figure 33: Europe Processed Camel Milk Revenue Share (%), by Types 2025 & 2033
- Figure 34: Europe Processed Camel Milk Volume Share (%), by Types 2025 & 2033
- Figure 35: Europe Processed Camel Milk Revenue (undefined), by Country 2025 & 2033
- Figure 36: Europe Processed Camel Milk Volume (K), by Country 2025 & 2033
- Figure 37: Europe Processed Camel Milk Revenue Share (%), by Country 2025 & 2033
- Figure 38: Europe Processed Camel Milk Volume Share (%), by Country 2025 & 2033
- Figure 39: Middle East & Africa Processed Camel Milk Revenue (undefined), by Application 2025 & 2033
- Figure 40: Middle East & Africa Processed Camel Milk Volume (K), by Application 2025 & 2033
- Figure 41: Middle East & Africa Processed Camel Milk Revenue Share (%), by Application 2025 & 2033
- Figure 42: Middle East & Africa Processed Camel Milk Volume Share (%), by Application 2025 & 2033
- Figure 43: Middle East & Africa Processed Camel Milk Revenue (undefined), by Types 2025 & 2033
- Figure 44: Middle East & Africa Processed Camel Milk Volume (K), by Types 2025 & 2033
- Figure 45: Middle East & Africa Processed Camel Milk Revenue Share (%), by Types 2025 & 2033
- Figure 46: Middle East & Africa Processed Camel Milk Volume Share (%), by Types 2025 & 2033
- Figure 47: Middle East & Africa Processed Camel Milk Revenue (undefined), by Country 2025 & 2033
- Figure 48: Middle East & Africa Processed Camel Milk Volume (K), by Country 2025 & 2033
- Figure 49: Middle East & Africa Processed Camel Milk Revenue Share (%), by Country 2025 & 2033
- Figure 50: Middle East & Africa Processed Camel Milk Volume Share (%), by Country 2025 & 2033
- Figure 51: Asia Pacific Processed Camel Milk Revenue (undefined), by Application 2025 & 2033
- Figure 52: Asia Pacific Processed Camel Milk Volume (K), by Application 2025 & 2033
- Figure 53: Asia Pacific Processed Camel Milk Revenue Share (%), by Application 2025 & 2033
- Figure 54: Asia Pacific Processed Camel Milk Volume Share (%), by Application 2025 & 2033
- Figure 55: Asia Pacific Processed Camel Milk Revenue (undefined), by Types 2025 & 2033
- Figure 56: Asia Pacific Processed Camel Milk Volume (K), by Types 2025 & 2033
- Figure 57: Asia Pacific Processed Camel Milk Revenue Share (%), by Types 2025 & 2033
- Figure 58: Asia Pacific Processed Camel Milk Volume Share (%), by Types 2025 & 2033
- Figure 59: Asia Pacific Processed Camel Milk Revenue (undefined), by Country 2025 & 2033
- Figure 60: Asia Pacific Processed Camel Milk Volume (K), by Country 2025 & 2033
- Figure 61: Asia Pacific Processed Camel Milk Revenue Share (%), by Country 2025 & 2033
- Figure 62: Asia Pacific Processed Camel Milk Volume Share (%), by Country 2025 & 2033
List of Tables
- Table 1: Global Processed Camel Milk Revenue undefined Forecast, by Application 2020 & 2033
- Table 2: Global Processed Camel Milk Volume K Forecast, by Application 2020 & 2033
- Table 3: Global Processed Camel Milk Revenue undefined Forecast, by Types 2020 & 2033
- Table 4: Global Processed Camel Milk Volume K Forecast, by Types 2020 & 2033
- Table 5: Global Processed Camel Milk Revenue undefined Forecast, by Region 2020 & 2033
- Table 6: Global Processed Camel Milk Volume K Forecast, by Region 2020 & 2033
- Table 7: Global Processed Camel Milk Revenue undefined Forecast, by Application 2020 & 2033
- Table 8: Global Processed Camel Milk Volume K Forecast, by Application 2020 & 2033
- Table 9: Global Processed Camel Milk Revenue undefined Forecast, by Types 2020 & 2033
- Table 10: Global Processed Camel Milk Volume K Forecast, by Types 2020 & 2033
- Table 11: Global Processed Camel Milk Revenue undefined Forecast, by Country 2020 & 2033
- Table 12: Global Processed Camel Milk Volume K Forecast, by Country 2020 & 2033
- Table 13: United States Processed Camel Milk Revenue (undefined) Forecast, by Application 2020 & 2033
- Table 14: United States Processed Camel Milk Volume (K) Forecast, by Application 2020 & 2033
- Table 15: Canada Processed Camel Milk Revenue (undefined) Forecast, by Application 2020 & 2033
- Table 16: Canada Processed Camel Milk Volume (K) Forecast, by Application 2020 & 2033
- Table 17: Mexico Processed Camel Milk Revenue (undefined) Forecast, by Application 2020 & 2033
- Table 18: Mexico Processed Camel Milk Volume (K) Forecast, by Application 2020 & 2033
- Table 19: Global Processed Camel Milk Revenue undefined Forecast, by Application 2020 & 2033
- Table 20: Global Processed Camel Milk Volume K Forecast, by Application 2020 & 2033
- Table 21: Global Processed Camel Milk Revenue undefined Forecast, by Types 2020 & 2033
- Table 22: Global Processed Camel Milk Volume K Forecast, by Types 2020 & 2033
- Table 23: Global Processed Camel Milk Revenue undefined Forecast, by Country 2020 & 2033
- Table 24: Global Processed Camel Milk Volume K Forecast, by Country 2020 & 2033
- Table 25: Brazil Processed Camel Milk Revenue (undefined) Forecast, by Application 2020 & 2033
- Table 26: Brazil Processed Camel Milk Volume (K) Forecast, by Application 2020 & 2033
- Table 27: Argentina Processed Camel Milk Revenue (undefined) Forecast, by Application 2020 & 2033
- Table 28: Argentina Processed Camel Milk Volume (K) Forecast, by Application 2020 & 2033
- Table 29: Rest of South America Processed Camel Milk Revenue (undefined) Forecast, by Application 2020 & 2033
- Table 30: Rest of South America Processed Camel Milk Volume (K) Forecast, by Application 2020 & 2033
- Table 31: Global Processed Camel Milk Revenue undefined Forecast, by Application 2020 & 2033
- Table 32: Global Processed Camel Milk Volume K Forecast, by Application 2020 & 2033
- Table 33: Global Processed Camel Milk Revenue undefined Forecast, by Types 2020 & 2033
- Table 34: Global Processed Camel Milk Volume K Forecast, by Types 2020 & 2033
- Table 35: Global Processed Camel Milk Revenue undefined Forecast, by Country 2020 & 2033
- Table 36: Global Processed Camel Milk Volume K Forecast, by Country 2020 & 2033
- Table 37: United Kingdom Processed Camel Milk Revenue (undefined) Forecast, by Application 2020 & 2033
- Table 38: United Kingdom Processed Camel Milk Volume (K) Forecast, by Application 2020 & 2033
- Table 39: Germany Processed Camel Milk Revenue (undefined) Forecast, by Application 2020 & 2033
- Table 40: Germany Processed Camel Milk Volume (K) Forecast, by Application 2020 & 2033
- Table 41: France Processed Camel Milk Revenue (undefined) Forecast, by Application 2020 & 2033
- Table 42: France Processed Camel Milk Volume (K) Forecast, by Application 2020 & 2033
- Table 43: Italy Processed Camel Milk Revenue (undefined) Forecast, by Application 2020 & 2033
- Table 44: Italy Processed Camel Milk Volume (K) Forecast, by Application 2020 & 2033
- Table 45: Spain Processed Camel Milk Revenue (undefined) Forecast, by Application 2020 & 2033
- Table 46: Spain Processed Camel Milk Volume (K) Forecast, by Application 2020 & 2033
- Table 47: Russia Processed Camel Milk Revenue (undefined) Forecast, by Application 2020 & 2033
- Table 48: Russia Processed Camel Milk Volume (K) Forecast, by Application 2020 & 2033
- Table 49: Benelux Processed Camel Milk Revenue (undefined) Forecast, by Application 2020 & 2033
- Table 50: Benelux Processed Camel Milk Volume (K) Forecast, by Application 2020 & 2033
- Table 51: Nordics Processed Camel Milk Revenue (undefined) Forecast, by Application 2020 & 2033
- Table 52: Nordics Processed Camel Milk Volume (K) Forecast, by Application 2020 & 2033
- Table 53: Rest of Europe Processed Camel Milk Revenue (undefined) Forecast, by Application 2020 & 2033
- Table 54: Rest of Europe Processed Camel Milk Volume (K) Forecast, by Application 2020 & 2033
- Table 55: Global Processed Camel Milk Revenue undefined Forecast, by Application 2020 & 2033
- Table 56: Global Processed Camel Milk Volume K Forecast, by Application 2020 & 2033
- Table 57: Global Processed Camel Milk Revenue undefined Forecast, by Types 2020 & 2033
- Table 58: Global Processed Camel Milk Volume K Forecast, by Types 2020 & 2033
- Table 59: Global Processed Camel Milk Revenue undefined Forecast, by Country 2020 & 2033
- Table 60: Global Processed Camel Milk Volume K Forecast, by Country 2020 & 2033
- Table 61: Turkey Processed Camel Milk Revenue (undefined) Forecast, by Application 2020 & 2033
- Table 62: Turkey Processed Camel Milk Volume (K) Forecast, by Application 2020 & 2033
- Table 63: Israel Processed Camel Milk Revenue (undefined) Forecast, by Application 2020 & 2033
- Table 64: Israel Processed Camel Milk Volume (K) Forecast, by Application 2020 & 2033
- Table 65: GCC Processed Camel Milk Revenue (undefined) Forecast, by Application 2020 & 2033
- Table 66: GCC Processed Camel Milk Volume (K) Forecast, by Application 2020 & 2033
- Table 67: North Africa Processed Camel Milk Revenue (undefined) Forecast, by Application 2020 & 2033
- Table 68: North Africa Processed Camel Milk Volume (K) Forecast, by Application 2020 & 2033
- Table 69: South Africa Processed Camel Milk Revenue (undefined) Forecast, by Application 2020 & 2033
- Table 70: South Africa Processed Camel Milk Volume (K) Forecast, by Application 2020 & 2033
- Table 71: Rest of Middle East & Africa Processed Camel Milk Revenue (undefined) Forecast, by Application 2020 & 2033
- Table 72: Rest of Middle East & Africa Processed Camel Milk Volume (K) Forecast, by Application 2020 & 2033
- Table 73: Global Processed Camel Milk Revenue undefined Forecast, by Application 2020 & 2033
- Table 74: Global Processed Camel Milk Volume K Forecast, by Application 2020 & 2033
- Table 75: Global Processed Camel Milk Revenue undefined Forecast, by Types 2020 & 2033
- Table 76: Global Processed Camel Milk Volume K Forecast, by Types 2020 & 2033
- Table 77: Global Processed Camel Milk Revenue undefined Forecast, by Country 2020 & 2033
- Table 78: Global Processed Camel Milk Volume K Forecast, by Country 2020 & 2033
- Table 79: China Processed Camel Milk Revenue (undefined) Forecast, by Application 2020 & 2033
- Table 80: China Processed Camel Milk Volume (K) Forecast, by Application 2020 & 2033
- Table 81: India Processed Camel Milk Revenue (undefined) Forecast, by Application 2020 & 2033
- Table 82: India Processed Camel Milk Volume (K) Forecast, by Application 2020 & 2033
- Table 83: Japan Processed Camel Milk Revenue (undefined) Forecast, by Application 2020 & 2033
- Table 84: Japan Processed Camel Milk Volume (K) Forecast, by Application 2020 & 2033
- Table 85: South Korea Processed Camel Milk Revenue (undefined) Forecast, by Application 2020 & 2033
- Table 86: South Korea Processed Camel Milk Volume (K) Forecast, by Application 2020 & 2033
- Table 87: ASEAN Processed Camel Milk Revenue (undefined) Forecast, by Application 2020 & 2033
- Table 88: ASEAN Processed Camel Milk Volume (K) Forecast, by Application 2020 & 2033
- Table 89: Oceania Processed Camel Milk Revenue (undefined) Forecast, by Application 2020 & 2033
- Table 90: Oceania Processed Camel Milk Volume (K) Forecast, by Application 2020 & 2033
- Table 91: Rest of Asia Pacific Processed Camel Milk Revenue (undefined) Forecast, by Application 2020 & 2033
- Table 92: Rest of Asia Pacific Processed Camel Milk Volume (K) Forecast, by Application 2020 & 2033
Frequently Asked Questions
1. What is the projected Compound Annual Growth Rate (CAGR) of the Processed Camel Milk?
The projected CAGR is approximately 9.4%.
2. Which companies are prominent players in the Processed Camel Milk?
Key companies in the market include Desert Farms, Al Nassma, Al Ain Farms, Camelicious, Camilk, Amul, Nuug Camel, VITAL Camel Milk, Tiviski Dairy.
3. What are the main segments of the Processed Camel Milk?
The market segments include Application, Types.
4. Can you provide details about the market size?
The market size is estimated to be USD XXX N/A as of 2022.
5. What are some drivers contributing to market growth?
N/A
6. What are the notable trends driving market growth?
N/A
7. Are there any restraints impacting market growth?
N/A
8. Can you provide examples of recent developments in the market?
N/A
9. What pricing options are available for accessing the report?
Pricing options include single-user, multi-user, and enterprise licenses priced at USD 3350.00, USD 5025.00, and USD 6700.00 respectively.
10. Is the market size provided in terms of value or volume?
The market size is provided in terms of value, measured in N/A and volume, measured in K.
11. Are there any specific market keywords associated with the report?
Yes, the market keyword associated with the report is "Processed Camel Milk," which aids in identifying and referencing the specific market segment covered.
12. How do I determine which pricing option suits my needs best?
The pricing options vary based on user requirements and access needs. Individual users may opt for single-user licenses, while businesses requiring broader access may choose multi-user or enterprise licenses for cost-effective access to the report.
13. Are there any additional resources or data provided in the Processed Camel Milk report?
While the report offers comprehensive insights, it's advisable to review the specific contents or supplementary materials provided to ascertain if additional resources or data are available.
14. How can I stay updated on further developments or reports in the Processed Camel Milk?
To stay informed about further developments, trends, and reports in the Processed Camel Milk, consider subscribing to industry newsletters, following relevant companies and organizations, or regularly checking reputable industry news sources and publications.
Methodology
Step 1 - Identification of Relevant Samples Size from Population Database


Step 2 - Approaches for Defining Global Market Size (Value, Volume* & Price*)

Note*: In applicable scenarios
Step 3 - Data Sources
Primary Research
- Web Analytics
- Survey Reports
- Research Institute
- Latest Research Reports
- Opinion Leaders
Secondary Research
- Annual Reports
- White Paper
- Latest Press Release
- Industry Association
- Paid Database
- Investor Presentations

Step 4 - Data Triangulation
Involves using different sources of information in order to increase the validity of a study
These sources are likely to be stakeholders in a program - participants, other researchers, program staff, other community members, and so on.
Then we put all data in single framework & apply various statistical tools to find out the dynamic on the market.
During the analysis stage, feedback from the stakeholder groups would be compared to determine areas of agreement as well as areas of divergence