

Key Insights
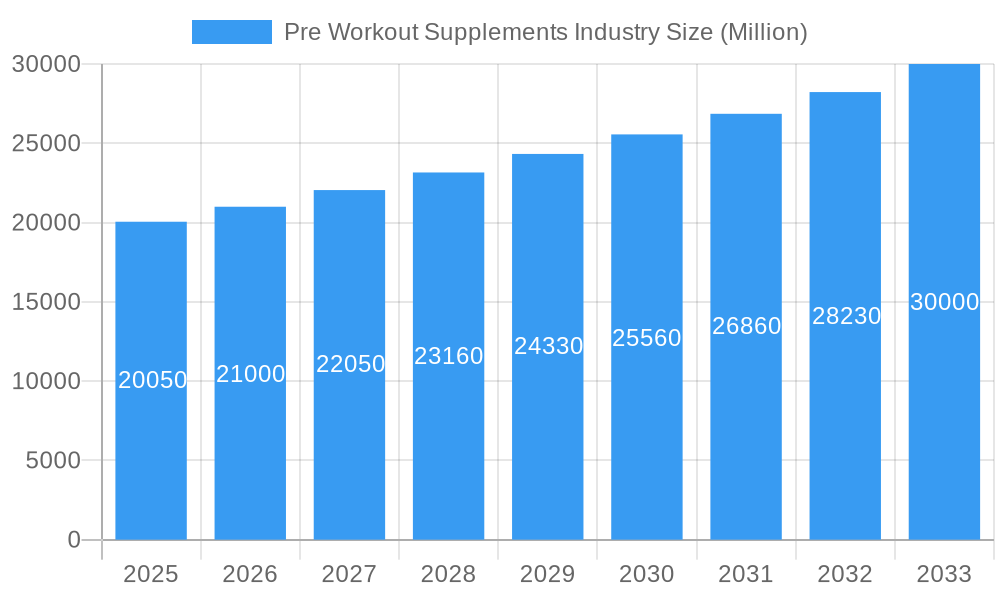
The pre-workout supplement market, valued at $20.05 billion in 2025, is projected to experience robust growth, driven by the increasing popularity of fitness and athletic activities globally. A compound annual growth rate (CAGR) of 4.78% from 2025 to 2033 indicates a substantial expansion, reaching an estimated market value exceeding $30 billion by 2033. This growth is fueled by several key factors. The rising awareness of the benefits of pre-workout supplements in enhancing athletic performance, improving energy levels, and boosting muscle strength and endurance is a significant driver. The increasing prevalence of fitness culture, particularly among millennials and Gen Z, further contributes to market expansion. Furthermore, the diverse product formats available, ranging from powders and capsules to ready-to-drink options, cater to a wide range of consumer preferences and lifestyles. The market is also witnessing innovation in ingredient formulations, with a focus on natural and organic options to address consumer demand for healthier alternatives. Online retail channels are experiencing rapid growth, contributing to broader market accessibility and convenience for consumers.
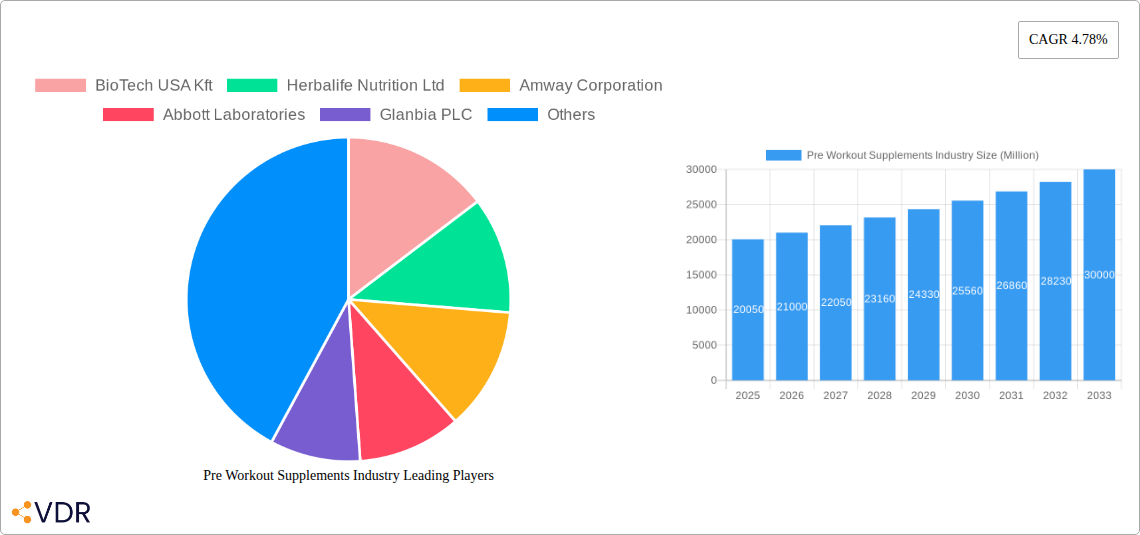
Pre Workout Supplements Industry Market Size (In Billion)
However, the market also faces some challenges. The stringent regulatory landscape surrounding supplement manufacturing and marketing in various regions presents hurdles for market players. Concerns regarding the safety and efficacy of certain ingredients also impact consumer perception and purchasing decisions. The rising competition from new entrants and established players necessitates continuous innovation and strategic marketing initiatives to maintain market share. Despite these challenges, the market’s positive growth trajectory remains intact, supported by the escalating demand for fitness-enhancing products and the consistent evolution of product offerings to meet consumer preferences and address safety concerns. Geographic expansion into emerging markets with high growth potential, particularly in Asia-Pacific, further presents significant opportunities for market expansion.
Pre Workout Supplements Industry Company Market Share
Pre Workout Supplements Industry: A Comprehensive Market Report (2019-2033)
This in-depth report provides a comprehensive analysis of the Pre Workout Supplements industry, encompassing market dynamics, growth trends, regional performance, competitive landscape, and future outlook. The report covers the period from 2019 to 2033, with 2025 serving as the base and estimated year. The study segments the market by Type (Powder, Capsule/Tablet, Drinks, Other Types) and Distribution Channel (Hypermarket/Supermarket, Specialty Stores, Online Retail Stores, Other Distribution Channels), offering granular insights into this dynamic sector. The global pre-workout supplement market size is projected to reach xx Million units by 2033.
Pre Workout Supplements Industry Market Dynamics & Structure
This section analyzes the competitive landscape of the pre-workout supplement market, focusing on market concentration, technological advancements, regulatory compliance, substitute products, and end-user demographics. We explore mergers and acquisitions (M&A) activity, providing quantitative data and qualitative insights.
- Market Concentration: The market exhibits a moderately concentrated structure, with key players holding significant market share. The top five players account for approximately xx% of the global market in 2025.
- Technological Innovation: Technological advancements in ingredient sourcing, formulation, and delivery systems are driving product innovation and differentiation. However, high R&D costs present a significant barrier to entry for smaller players.
- Regulatory Framework: Stringent regulations regarding ingredient safety and labeling vary across different geographies, impacting market access and product development strategies.
- Competitive Substitutes: Energy drinks and other performance-enhancing supplements pose a significant competitive threat to the pre-workout supplement market.
- End-User Demographics: The primary target demographic comprises health-conscious individuals, athletes, and fitness enthusiasts, predominantly aged 18-45.
- M&A Trends: The industry has witnessed a moderate level of M&A activity in recent years, primarily driven by strategic acquisitions aimed at expanding product portfolios and market reach. Approximately xx M&A deals were recorded between 2019 and 2024.
Pre Workout Supplements Industry Growth Trends & Insights
This section details the market size evolution, adoption rates, technological disruptions, and consumer behavior shifts within the pre-workout supplement industry, providing specific metrics for deeper insights. Utilizing proprietary data and industry reports, this analysis reveals key trends shaping the market's trajectory. The market experienced a CAGR of xx% during the historical period (2019-2024) and is projected to maintain a CAGR of xx% during the forecast period (2025-2033). Market penetration rates are rising steadily, driven by increasing health awareness and fitness participation. Technological disruptions, such as personalized nutrition and smart supplement packaging, are anticipated to further fuel market growth. Consumer behavior shifts toward natural and organic ingredients are shaping product development strategies.
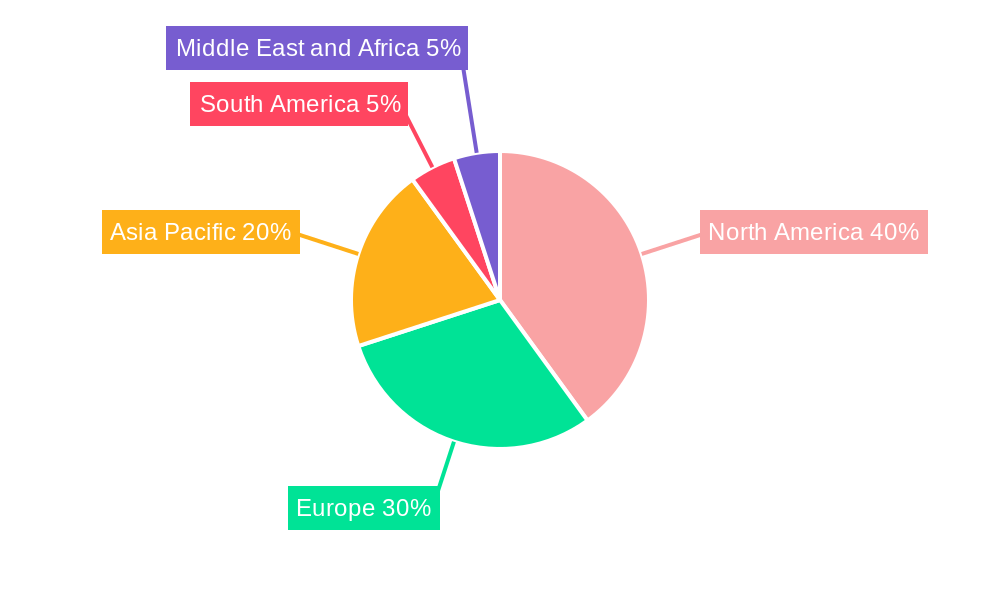
Dominant Regions, Countries, or Segments in Pre Workout Supplements Industry
This section identifies the leading regions, countries, and segments driving market growth.
- Leading Region: North America currently holds the largest market share, driven by high consumer spending on fitness and wellness products. Europe is expected to demonstrate robust growth in the forecast period.
- Leading Type: Powdered pre-workout supplements continue to dominate the market due to their versatility, affordability, and wide availability.
- Leading Distribution Channel: Online retail stores are experiencing rapid growth, fueled by e-commerce expansion and enhanced consumer convenience. However, hypermarkets/supermarkets retain significant market share due to their extensive reach and established distribution networks.
Key drivers include increased disposable incomes, rising health consciousness, and government initiatives promoting fitness and sports. The dominance of specific regions and segments is analyzed in terms of market share and growth potential, including factors such as economic policies, consumer preferences, and infrastructure development.
Pre Workout Supplements Industry Product Landscape
The pre-workout supplement market showcases diverse product formulations, catering to specific needs and preferences. Innovations focus on enhanced absorption rates, improved taste profiles, and the incorporation of novel ingredients like adaptogens and nootropics. Unique selling propositions center around efficacy, safety, and targeted benefits, such as increased energy, improved focus, and enhanced muscle performance. Technological advancements like personalized nutrition recommendations and connected fitness apps are further transforming the product landscape.
Key Drivers, Barriers & Challenges in Pre Workout Supplements Industry
Key Drivers:
- Rising health consciousness and fitness participation.
- Increased disposable incomes in emerging economies.
- Technological advancements in product formulation and delivery.
- Growing popularity of online retail channels.
Challenges and Restraints:
- Stringent regulatory requirements and labeling standards.
- Concerns regarding ingredient safety and potential side effects.
- Intense competition and market saturation in developed regions.
- Supply chain disruptions and raw material price fluctuations. These factors are estimated to impact market growth by approximately xx% by 2033.
Emerging Opportunities in Pre Workout Supplements Industry
Emerging opportunities lie in untapped markets, particularly in developing economies experiencing rising disposable incomes and increased health awareness. Innovative applications, such as pre-workout supplements tailored to specific sports or fitness activities, are gaining traction. Evolving consumer preferences towards clean label, organic, and sustainable products drive demand for reformulated pre-workout supplements.
Growth Accelerators in the Pre Workout Supplements Industry
Technological breakthroughs in ingredient science, formulation, and delivery systems are key catalysts for long-term growth. Strategic partnerships between supplement manufacturers and fitness brands expand market reach and enhance product credibility. Expansion into new geographic markets and diversification of product lines will further drive growth.
Key Players Shaping the Pre Workout Supplements Industry Market
- BioTech USA Kft
- Herbalife Nutrition Ltd
- Amway Corporation
- Abbott Laboratories
- Glanbia PLC
- Nutrex Research Inc
- MusclePharm Corporation
- QNT SA
- Bulk
- Nutrabolt
Notable Milestones in Pre Workout Supplements Industry Sector
- 2020: Increased focus on clean-label and organic ingredients.
- 2021: Several key players launched personalized pre-workout supplement subscription services.
- 2022: Significant investments in R&D for improved ingredient bioavailability.
- 2023: Several mergers and acquisitions consolidating market share.
- 2024: Launch of innovative packaging solutions focusing on sustainability.
In-Depth Pre Workout Supplements Industry Market Outlook
The pre-workout supplement market is poised for continued expansion driven by sustained consumer demand, technological advancements, and strategic market expansions. Emerging opportunities in personalized nutrition, smart supplement packaging, and sustainable sourcing will shape the future of the industry. Strategic partnerships and M&A activity are expected to further consolidate the market landscape, driving growth and innovation.
Pre Workout Supplements Industry Segmentation
-
1. Type
- 1.1. Powder
- 1.2. Capsule/ Tablet
- 1.3. Drinks
- 1.4. Other Types
-
2. Distribution Channel
- 2.1. Hypermarket/Supermarket
- 2.2. Specialty Stores
- 2.3. Online Retail Stores
- 2.4. Other Distribution Channels
Pre Workout Supplements Industry Segmentation By Geography
-
1. North America
- 1.1. United States
- 1.2. Canada
- 1.3. Mexico
- 1.4. Rest of North America
-
2. Europe
- 2.1. Spain
- 2.2. United Kingdom
- 2.3. Germany
- 2.4. France
- 2.5. Italy
- 2.6. Russia
- 2.7. Rest of Europe
-
3. Asia Pacific
- 3.1. China
- 3.2. Japan
- 3.3. India
- 3.4. Australia
- 3.5. Rest of Asia Pacific
-
4. South America
- 4.1. Brazil
- 4.2. Argentina
- 4.3. Rest of South America
-
5. Middle East and Africa
- 5.1. United Arab Emirates
- 5.2. South Africa
- 5.3. Rest of Middle East and Africa
Pre Workout Supplements Industry Regional Market Share
Geographic Coverage of Pre Workout Supplements Industry
Pre Workout Supplements Industry REPORT HIGHLIGHTS
| Aspects | Details |
|---|---|
| Study Period | 2020-2034 |
| Base Year | 2025 |
| Estimated Year | 2026 |
| Forecast Period | 2026-2034 |
| Historical Period | 2020-2025 |
| Growth Rate | CAGR of 4.78% from 2020-2034 |
| Segmentation |
|
Table of Contents
- 1. Introduction
- 1.1. Research Scope
- 1.2. Market Segmentation
- 1.3. Research Objective
- 1.4. Definitions and Assumptions
- 2. Executive Summary
- 2.1. Market Snapshot
- 3. Market Dynamics
- 3.1. Market Drivers
- 3.2. Market Restrains
- 3.3. Market Trends
- 3.4. Market Opportunities
- 4. Market Factor Analysis
- 4.1. Porters Five Forces
- 4.1.1. Bargaining Power of Suppliers
- 4.1.2. Bargaining Power of Buyers
- 4.1.3. Threat of New Entrants
- 4.1.4. Threat of Substitutes
- 4.1.5. Competitive Rivalry
- 4.2. PESTEL analysis
- 4.3. BCG Analysis
- 4.3.1. Stars (High Growth, High Market Share)
- 4.3.2. Cash Cows (Low Growth, High Market Share)
- 4.3.3. Question Mark (High Growth, Low Market Share)
- 4.3.4. Dogs (Low Growth, Low Market Share)
- 4.4. Ansoff Matrix Analysis
- 4.5. Supply Chain Analysis
- 4.6. Regulatory Landscape
- 4.7. Current Market Potential and Opportunity Assessment (TAM–SAM–SOM Framework)
- 4.8. VDR Analyst Note
- 4.1. Porters Five Forces
- 5. Market Analysis, Insights and Forecast 2021-2033
- 5.1. Market Analysis, Insights and Forecast - by Type
- 5.1.1. Powder
- 5.1.2. Capsule/ Tablet
- 5.1.3. Drinks
- 5.1.4. Other Types
- 5.2. Market Analysis, Insights and Forecast - by Distribution Channel
- 5.2.1. Hypermarket/Supermarket
- 5.2.2. Specialty Stores
- 5.2.3. Online Retail Stores
- 5.2.4. Other Distribution Channels
- 5.3. Market Analysis, Insights and Forecast - by Region
- 5.3.1. North America
- 5.3.2. Europe
- 5.3.3. Asia Pacific
- 5.3.4. South America
- 5.3.5. Middle East and Africa
- 5.1. Market Analysis, Insights and Forecast - by Type
- 6. Global Pre Workout Supplements Industry Analysis, Insights and Forecast, 2021-2033
- 6.1. Market Analysis, Insights and Forecast - by Type
- 6.1.1. Powder
- 6.1.2. Capsule/ Tablet
- 6.1.3. Drinks
- 6.1.4. Other Types
- 6.2. Market Analysis, Insights and Forecast - by Distribution Channel
- 6.2.1. Hypermarket/Supermarket
- 6.2.2. Specialty Stores
- 6.2.3. Online Retail Stores
- 6.2.4. Other Distribution Channels
- 6.1. Market Analysis, Insights and Forecast - by Type
- 7. North America Pre Workout Supplements Industry Analysis, Insights and Forecast, 2021-2033
- 7.1. Market Analysis, Insights and Forecast - by Type
- 7.1.1. Powder
- 7.1.2. Capsule/ Tablet
- 7.1.3. Drinks
- 7.1.4. Other Types
- 7.2. Market Analysis, Insights and Forecast - by Distribution Channel
- 7.2.1. Hypermarket/Supermarket
- 7.2.2. Specialty Stores
- 7.2.3. Online Retail Stores
- 7.2.4. Other Distribution Channels
- 7.1. Market Analysis, Insights and Forecast - by Type
- 8. Europe Pre Workout Supplements Industry Analysis, Insights and Forecast, 2021-2033
- 8.1. Market Analysis, Insights and Forecast - by Type
- 8.1.1. Powder
- 8.1.2. Capsule/ Tablet
- 8.1.3. Drinks
- 8.1.4. Other Types
- 8.2. Market Analysis, Insights and Forecast - by Distribution Channel
- 8.2.1. Hypermarket/Supermarket
- 8.2.2. Specialty Stores
- 8.2.3. Online Retail Stores
- 8.2.4. Other Distribution Channels
- 8.1. Market Analysis, Insights and Forecast - by Type
- 9. Asia Pacific Pre Workout Supplements Industry Analysis, Insights and Forecast, 2021-2033
- 9.1. Market Analysis, Insights and Forecast - by Type
- 9.1.1. Powder
- 9.1.2. Capsule/ Tablet
- 9.1.3. Drinks
- 9.1.4. Other Types
- 9.2. Market Analysis, Insights and Forecast - by Distribution Channel
- 9.2.1. Hypermarket/Supermarket
- 9.2.2. Specialty Stores
- 9.2.3. Online Retail Stores
- 9.2.4. Other Distribution Channels
- 9.1. Market Analysis, Insights and Forecast - by Type
- 10. South America Pre Workout Supplements Industry Analysis, Insights and Forecast, 2021-2033
- 10.1. Market Analysis, Insights and Forecast - by Type
- 10.1.1. Powder
- 10.1.2. Capsule/ Tablet
- 10.1.3. Drinks
- 10.1.4. Other Types
- 10.2. Market Analysis, Insights and Forecast - by Distribution Channel
- 10.2.1. Hypermarket/Supermarket
- 10.2.2. Specialty Stores
- 10.2.3. Online Retail Stores
- 10.2.4. Other Distribution Channels
- 10.1. Market Analysis, Insights and Forecast - by Type
- 11. Middle East and Africa Pre Workout Supplements Industry Analysis, Insights and Forecast, 2021-2033
- 11.1. Market Analysis, Insights and Forecast - by Type
- 11.1.1. Powder
- 11.1.2. Capsule/ Tablet
- 11.1.3. Drinks
- 11.1.4. Other Types
- 11.2. Market Analysis, Insights and Forecast - by Distribution Channel
- 11.2.1. Hypermarket/Supermarket
- 11.2.2. Specialty Stores
- 11.2.3. Online Retail Stores
- 11.2.4. Other Distribution Channels
- 11.1. Market Analysis, Insights and Forecast - by Type
- 12. Competitive Analysis
- 12.1. Company Profiles
- 12.1.1 BioTech USA Kft
- 12.1.1.1. Company Overview
- 12.1.1.2. Products
- 12.1.1.3. Company Financials
- 12.1.1.4. SWOT Analysis
- 12.1.2 Herbalife Nutrition Ltd
- 12.1.2.1. Company Overview
- 12.1.2.2. Products
- 12.1.2.3. Company Financials
- 12.1.2.4. SWOT Analysis
- 12.1.3 Amway Corporation
- 12.1.3.1. Company Overview
- 12.1.3.2. Products
- 12.1.3.3. Company Financials
- 12.1.3.4. SWOT Analysis
- 12.1.4 Abbott Laboratories
- 12.1.4.1. Company Overview
- 12.1.4.2. Products
- 12.1.4.3. Company Financials
- 12.1.4.4. SWOT Analysis
- 12.1.5 Glanbia PLC
- 12.1.5.1. Company Overview
- 12.1.5.2. Products
- 12.1.5.3. Company Financials
- 12.1.5.4. SWOT Analysis
- 12.1.6 Nutrex Research Inc *List Not Exhaustive
- 12.1.6.1. Company Overview
- 12.1.6.2. Products
- 12.1.6.3. Company Financials
- 12.1.6.4. SWOT Analysis
- 12.1.7 MusclePharm Corporation
- 12.1.7.1. Company Overview
- 12.1.7.2. Products
- 12.1.7.3. Company Financials
- 12.1.7.4. SWOT Analysis
- 12.1.8 QNT SA
- 12.1.8.1. Company Overview
- 12.1.8.2. Products
- 12.1.8.3. Company Financials
- 12.1.8.4. SWOT Analysis
- 12.1.9 Bulk
- 12.1.9.1. Company Overview
- 12.1.9.2. Products
- 12.1.9.3. Company Financials
- 12.1.9.4. SWOT Analysis
- 12.1.10 Nutrabolt
- 12.1.10.1. Company Overview
- 12.1.10.2. Products
- 12.1.10.3. Company Financials
- 12.1.10.4. SWOT Analysis
- 12.1.1 BioTech USA Kft
- 12.2. Market Entropy
- 12.2.1 Company's Key Areas Served
- 12.2.2 Recent Developments
- 12.3. Company Market Share Analysis 2025
- 12.3.1 Top 5 Companies Market Share Analysis
- 12.3.2 Top 3 Companies Market Share Analysis
- 12.4. List of Potential Customers
- 13. Research Methodology
List of Figures
- Figure 1: Global Pre Workout Supplements Industry Revenue Breakdown (Million, %) by Region 2025 & 2033
- Figure 2: North America Pre Workout Supplements Industry Revenue (Million), by Type 2025 & 2033
- Figure 3: North America Pre Workout Supplements Industry Revenue Share (%), by Type 2025 & 2033
- Figure 4: North America Pre Workout Supplements Industry Revenue (Million), by Distribution Channel 2025 & 2033
- Figure 5: North America Pre Workout Supplements Industry Revenue Share (%), by Distribution Channel 2025 & 2033
- Figure 6: North America Pre Workout Supplements Industry Revenue (Million), by Country 2025 & 2033
- Figure 7: North America Pre Workout Supplements Industry Revenue Share (%), by Country 2025 & 2033
- Figure 8: Europe Pre Workout Supplements Industry Revenue (Million), by Type 2025 & 2033
- Figure 9: Europe Pre Workout Supplements Industry Revenue Share (%), by Type 2025 & 2033
- Figure 10: Europe Pre Workout Supplements Industry Revenue (Million), by Distribution Channel 2025 & 2033
- Figure 11: Europe Pre Workout Supplements Industry Revenue Share (%), by Distribution Channel 2025 & 2033
- Figure 12: Europe Pre Workout Supplements Industry Revenue (Million), by Country 2025 & 2033
- Figure 13: Europe Pre Workout Supplements Industry Revenue Share (%), by Country 2025 & 2033
- Figure 14: Asia Pacific Pre Workout Supplements Industry Revenue (Million), by Type 2025 & 2033
- Figure 15: Asia Pacific Pre Workout Supplements Industry Revenue Share (%), by Type 2025 & 2033
- Figure 16: Asia Pacific Pre Workout Supplements Industry Revenue (Million), by Distribution Channel 2025 & 2033
- Figure 17: Asia Pacific Pre Workout Supplements Industry Revenue Share (%), by Distribution Channel 2025 & 2033
- Figure 18: Asia Pacific Pre Workout Supplements Industry Revenue (Million), by Country 2025 & 2033
- Figure 19: Asia Pacific Pre Workout Supplements Industry Revenue Share (%), by Country 2025 & 2033
- Figure 20: South America Pre Workout Supplements Industry Revenue (Million), by Type 2025 & 2033
- Figure 21: South America Pre Workout Supplements Industry Revenue Share (%), by Type 2025 & 2033
- Figure 22: South America Pre Workout Supplements Industry Revenue (Million), by Distribution Channel 2025 & 2033
- Figure 23: South America Pre Workout Supplements Industry Revenue Share (%), by Distribution Channel 2025 & 2033
- Figure 24: South America Pre Workout Supplements Industry Revenue (Million), by Country 2025 & 2033
- Figure 25: South America Pre Workout Supplements Industry Revenue Share (%), by Country 2025 & 2033
- Figure 26: Middle East and Africa Pre Workout Supplements Industry Revenue (Million), by Type 2025 & 2033
- Figure 27: Middle East and Africa Pre Workout Supplements Industry Revenue Share (%), by Type 2025 & 2033
- Figure 28: Middle East and Africa Pre Workout Supplements Industry Revenue (Million), by Distribution Channel 2025 & 2033
- Figure 29: Middle East and Africa Pre Workout Supplements Industry Revenue Share (%), by Distribution Channel 2025 & 2033
- Figure 30: Middle East and Africa Pre Workout Supplements Industry Revenue (Million), by Country 2025 & 2033
- Figure 31: Middle East and Africa Pre Workout Supplements Industry Revenue Share (%), by Country 2025 & 2033
List of Tables
- Table 1: Global Pre Workout Supplements Industry Revenue Million Forecast, by Type 2020 & 2033
- Table 2: Global Pre Workout Supplements Industry Revenue Million Forecast, by Distribution Channel 2020 & 2033
- Table 3: Global Pre Workout Supplements Industry Revenue Million Forecast, by Region 2020 & 2033
- Table 4: Global Pre Workout Supplements Industry Revenue Million Forecast, by Type 2020 & 2033
- Table 5: Global Pre Workout Supplements Industry Revenue Million Forecast, by Distribution Channel 2020 & 2033
- Table 6: Global Pre Workout Supplements Industry Revenue Million Forecast, by Country 2020 & 2033
- Table 7: United States Pre Workout Supplements Industry Revenue (Million) Forecast, by Application 2020 & 2033
- Table 8: Canada Pre Workout Supplements Industry Revenue (Million) Forecast, by Application 2020 & 2033
- Table 9: Mexico Pre Workout Supplements Industry Revenue (Million) Forecast, by Application 2020 & 2033
- Table 10: Rest of North America Pre Workout Supplements Industry Revenue (Million) Forecast, by Application 2020 & 2033
- Table 11: Global Pre Workout Supplements Industry Revenue Million Forecast, by Type 2020 & 2033
- Table 12: Global Pre Workout Supplements Industry Revenue Million Forecast, by Distribution Channel 2020 & 2033
- Table 13: Global Pre Workout Supplements Industry Revenue Million Forecast, by Country 2020 & 2033
- Table 14: Spain Pre Workout Supplements Industry Revenue (Million) Forecast, by Application 2020 & 2033
- Table 15: United Kingdom Pre Workout Supplements Industry Revenue (Million) Forecast, by Application 2020 & 2033
- Table 16: Germany Pre Workout Supplements Industry Revenue (Million) Forecast, by Application 2020 & 2033
- Table 17: France Pre Workout Supplements Industry Revenue (Million) Forecast, by Application 2020 & 2033
- Table 18: Italy Pre Workout Supplements Industry Revenue (Million) Forecast, by Application 2020 & 2033
- Table 19: Russia Pre Workout Supplements Industry Revenue (Million) Forecast, by Application 2020 & 2033
- Table 20: Rest of Europe Pre Workout Supplements Industry Revenue (Million) Forecast, by Application 2020 & 2033
- Table 21: Global Pre Workout Supplements Industry Revenue Million Forecast, by Type 2020 & 2033
- Table 22: Global Pre Workout Supplements Industry Revenue Million Forecast, by Distribution Channel 2020 & 2033
- Table 23: Global Pre Workout Supplements Industry Revenue Million Forecast, by Country 2020 & 2033
- Table 24: China Pre Workout Supplements Industry Revenue (Million) Forecast, by Application 2020 & 2033
- Table 25: Japan Pre Workout Supplements Industry Revenue (Million) Forecast, by Application 2020 & 2033
- Table 26: India Pre Workout Supplements Industry Revenue (Million) Forecast, by Application 2020 & 2033
- Table 27: Australia Pre Workout Supplements Industry Revenue (Million) Forecast, by Application 2020 & 2033
- Table 28: Rest of Asia Pacific Pre Workout Supplements Industry Revenue (Million) Forecast, by Application 2020 & 2033
- Table 29: Global Pre Workout Supplements Industry Revenue Million Forecast, by Type 2020 & 2033
- Table 30: Global Pre Workout Supplements Industry Revenue Million Forecast, by Distribution Channel 2020 & 2033
- Table 31: Global Pre Workout Supplements Industry Revenue Million Forecast, by Country 2020 & 2033
- Table 32: Brazil Pre Workout Supplements Industry Revenue (Million) Forecast, by Application 2020 & 2033
- Table 33: Argentina Pre Workout Supplements Industry Revenue (Million) Forecast, by Application 2020 & 2033
- Table 34: Rest of South America Pre Workout Supplements Industry Revenue (Million) Forecast, by Application 2020 & 2033
- Table 35: Global Pre Workout Supplements Industry Revenue Million Forecast, by Type 2020 & 2033
- Table 36: Global Pre Workout Supplements Industry Revenue Million Forecast, by Distribution Channel 2020 & 2033
- Table 37: Global Pre Workout Supplements Industry Revenue Million Forecast, by Country 2020 & 2033
- Table 38: United Arab Emirates Pre Workout Supplements Industry Revenue (Million) Forecast, by Application 2020 & 2033
- Table 39: South Africa Pre Workout Supplements Industry Revenue (Million) Forecast, by Application 2020 & 2033
- Table 40: Rest of Middle East and Africa Pre Workout Supplements Industry Revenue (Million) Forecast, by Application 2020 & 2033
Frequently Asked Questions
1. What is the projected Compound Annual Growth Rate (CAGR) of the Pre Workout Supplements Industry?
The projected CAGR is approximately 4.78%.
2. Which companies are prominent players in the Pre Workout Supplements Industry?
Key companies in the market include BioTech USA Kft, Herbalife Nutrition Ltd, Amway Corporation, Abbott Laboratories, Glanbia PLC, Nutrex Research Inc *List Not Exhaustive, MusclePharm Corporation, QNT SA, Bulk, Nutrabolt.
3. What are the main segments of the Pre Workout Supplements Industry?
The market segments include Type, Distribution Channel.
4. Can you provide details about the market size?
The market size is estimated to be USD 20.05 Million as of 2022.
5. What are some drivers contributing to market growth?
Increasing Trend of Consuming Cocktails; Rising Demand for Premium Spirits.
6. What are the notable trends driving market growth?
Growing Influence of Healthy Lifestyle Trends and Rising Number of Non-Traditional Users.
7. Are there any restraints impacting market growth?
Affordability of the Product is Restraining the Market's Growth.
8. Can you provide examples of recent developments in the market?
N/A
9. What pricing options are available for accessing the report?
Pricing options include single-user, multi-user, and enterprise licenses priced at USD 4750, USD 5250, and USD 8750 respectively.
10. Is the market size provided in terms of value or volume?
The market size is provided in terms of value, measured in Million.
11. Are there any specific market keywords associated with the report?
Yes, the market keyword associated with the report is "Pre Workout Supplements Industry," which aids in identifying and referencing the specific market segment covered.
12. How do I determine which pricing option suits my needs best?
The pricing options vary based on user requirements and access needs. Individual users may opt for single-user licenses, while businesses requiring broader access may choose multi-user or enterprise licenses for cost-effective access to the report.
13. Are there any additional resources or data provided in the Pre Workout Supplements Industry report?
While the report offers comprehensive insights, it's advisable to review the specific contents or supplementary materials provided to ascertain if additional resources or data are available.
14. How can I stay updated on further developments or reports in the Pre Workout Supplements Industry?
To stay informed about further developments, trends, and reports in the Pre Workout Supplements Industry, consider subscribing to industry newsletters, following relevant companies and organizations, or regularly checking reputable industry news sources and publications.
Methodology
Step 1 - Identification of Relevant Samples Size from Population Database


Step 2 - Approaches for Defining Global Market Size (Value, Volume* & Price*)

Note*: In applicable scenarios
Step 3 - Data Sources
Primary Research
- Web Analytics
- Survey Reports
- Research Institute
- Latest Research Reports
- Opinion Leaders
Secondary Research
- Annual Reports
- White Paper
- Latest Press Release
- Industry Association
- Paid Database
- Investor Presentations

Step 4 - Data Triangulation
Involves using different sources of information in order to increase the validity of a study
These sources are likely to be stakeholders in a program - participants, other researchers, program staff, other community members, and so on.
Then we put all data in single framework & apply various statistical tools to find out the dynamic on the market.
During the analysis stage, feedback from the stakeholder groups would be compared to determine areas of agreement as well as areas of divergence