

Key Insights
The global Power Sports Batteries market is projected to reach an impressive USD 11.5 billion in 2025, exhibiting robust growth with a Compound Annual Growth Rate (CAGR) of 5.8% through 2033. This expansion is fueled by a confluence of escalating demand for recreational vehicles, advancements in battery technology, and a growing passion for outdoor activities across various demographics. The burgeoning powersports industry, encompassing motorcycles, ATVs, snowmobiles, and personal watercraft, directly correlates with the need for reliable and high-performance batteries. Furthermore, the increasing adoption of electric powersports vehicles, though still nascent, represents a significant future growth avenue. Technological innovations, such as the development of lighter, more durable, and faster-charging lithium-ion batteries, are also playing a pivotal role in driving market adoption and consumer preference away from traditional lead-acid alternatives, catering to the specific demands of high-performance applications.
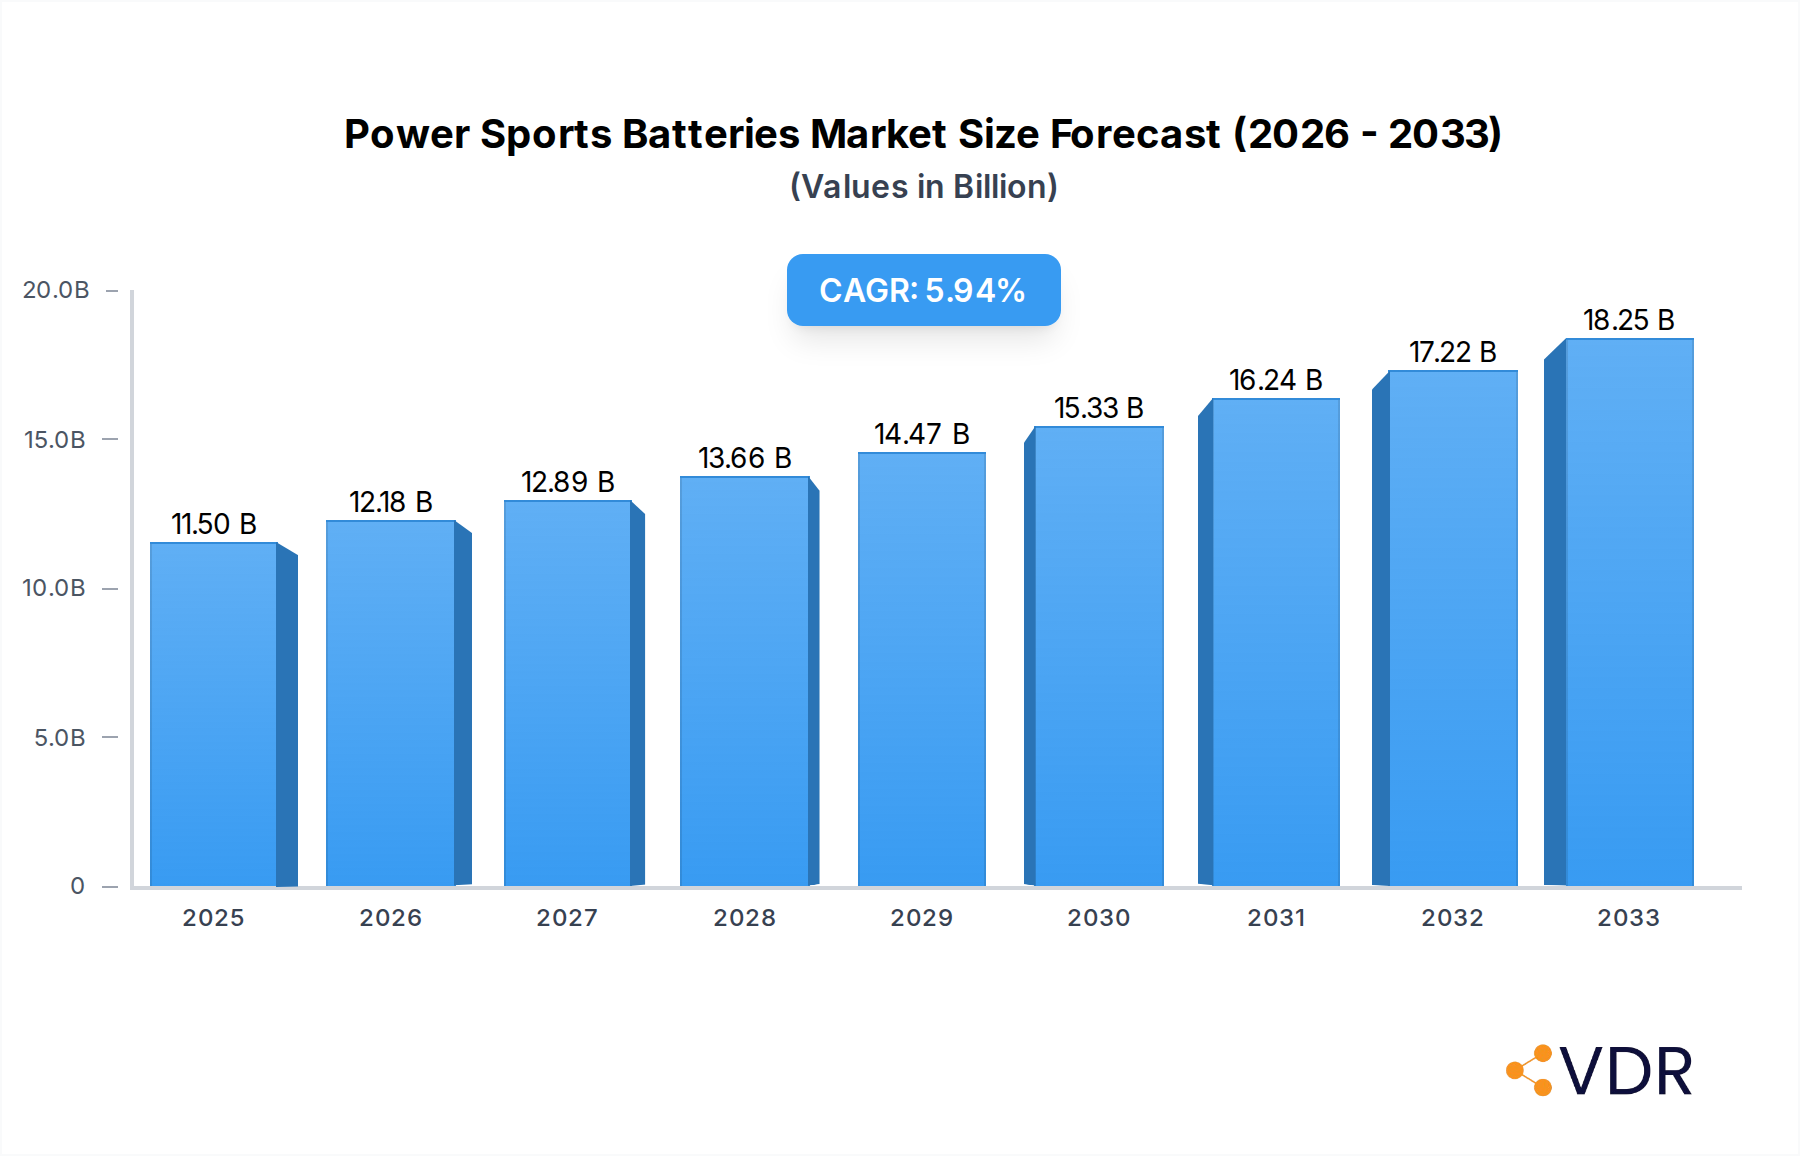
Power Sports Batteries Market Size (In Billion)
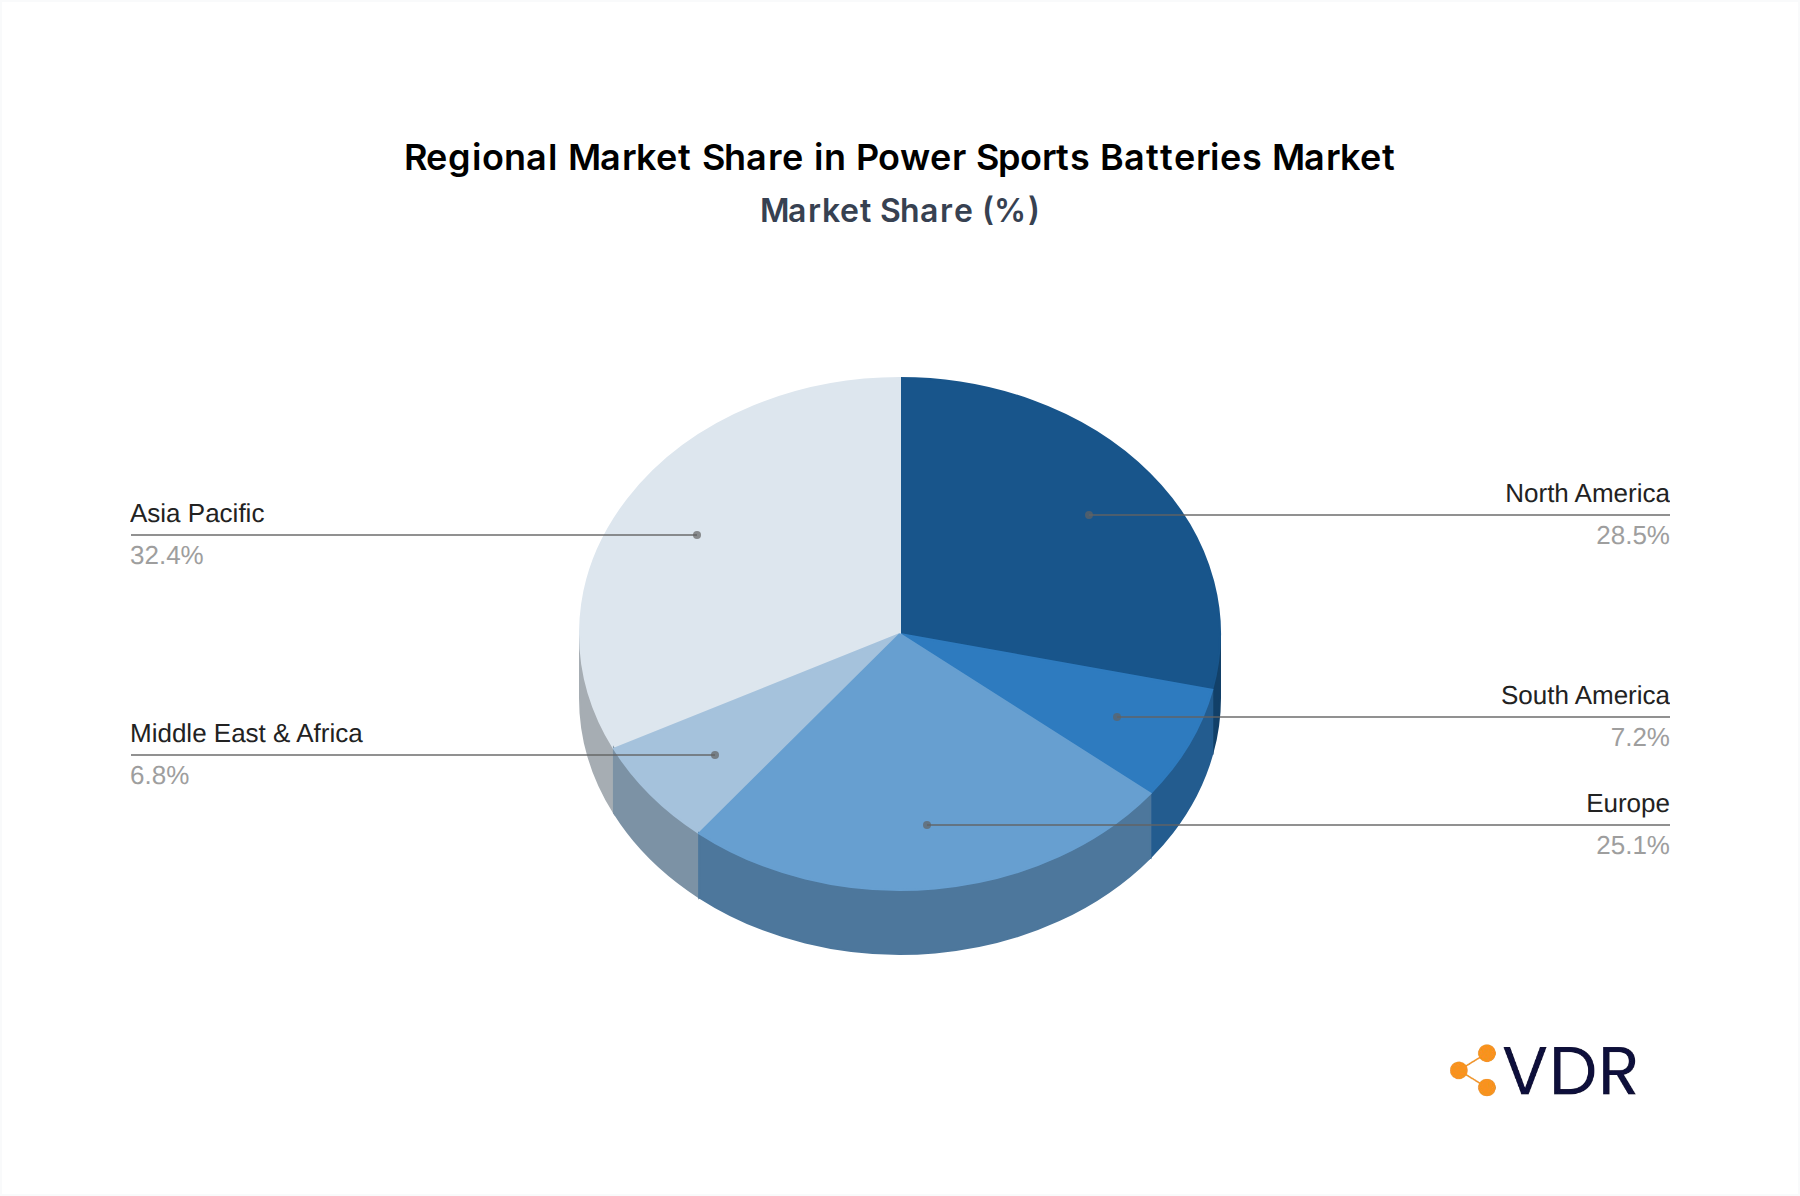
The market is segmented by application into OEM and Aftermarket/Replacement, with both segments demonstrating considerable potential. The OEM segment benefits from the continuous launch of new powersports models, while the aftermarket segment is bolstered by the growing trend of vehicle customization and the need to replace aging batteries. By type, Conventional Batteries, AGM Batteries, and Lithium Batteries are key categories, with lithium-ion technology poised for substantial market share gains due to its superior energy density, longevity, and lighter weight. Geographically, the Asia Pacific region, led by China, is expected to be a dominant force, driven by its massive manufacturing base and rapidly expanding consumer market. North America and Europe also represent significant markets, with a strong existing powersports culture and increasing interest in electric variants. Key players are strategically investing in research and development to offer innovative solutions that address the evolving needs of this dynamic market.

Power Sports Batteries Company Market Share
Power Sports Batteries Market Report: Unlocking Growth in a Dynamic Sector
This comprehensive market research report offers an in-depth analysis of the global Power Sports Batteries market, providing critical insights for industry stakeholders. The study covers a detailed examination of market dynamics, growth trends, regional dominance, product innovations, key drivers, challenges, emerging opportunities, and a thorough competitive landscape analysis. With a focus on the OEM and Aftermarket/Replacement segments, and the evolving dominance of Lithium Batteries over Conventional Batteries and AGM Batteries, this report is an essential guide for navigating the future of power sports energy solutions.
Power Sports Batteries Market Dynamics & Structure
The global Power Sports Batteries market exhibits a moderately concentrated structure, driven by technological advancements and evolving consumer preferences. Key players like Panasonic, CATL, BYD, GS Yuasa, and LG Chem are at the forefront, investing heavily in research and development for higher energy density and longer lifespan battery solutions. Regulatory frameworks, particularly those pertaining to environmental impact and safety standards, are increasingly influencing product development and market entry. The competitive landscape is shaped by the continuous innovation in battery chemistries, with a significant shift towards lithium-ion technologies.
- Technological Innovation Drivers: Increased demand for lightweight, high-performance batteries in motorcycles, ATVs, snowmobiles, and personal watercraft.
- Regulatory Frameworks: Stringent emission standards and battery recycling mandates are influencing material choices and manufacturing processes.
- Competitive Product Substitutes: Emerging battery chemistries and advancements in existing technologies like AGM are continuously challenging market incumbents.
- End-User Demographics: A growing base of recreational vehicle enthusiasts and a younger demographic adopting power sports equipment are fueling demand.
- M&A Trends: Strategic acquisitions and partnerships are common as larger players seek to expand their technological capabilities and market reach. The historical period from 2019-2024 saw an estimated 0.5 billion units in M&A deal volumes.
Power Sports Batteries Growth Trends & Insights
The global Power Sports Batteries market is poised for robust expansion, driven by increasing consumer disposable income, a surge in recreational activities, and the persistent demand for enhanced performance and reliability in power sports vehicles. The study period from 2019 to 2033 anticipates a significant market size evolution, with the base year 2025 projecting a global market value of $X.XX billion. The historical period from 2019 to 2024 witnessed a compound annual growth rate (CAGR) of approximately 6.5%, a trend expected to accelerate. This growth is underpinned by the increasing adoption rates of advanced battery technologies, particularly lithium-ion solutions, which offer superior power-to-weight ratios and longer operational lifespans compared to conventional lead-acid batteries.
Technological disruptions are continuously reshaping the market. Innovations in battery management systems (BMS), faster charging capabilities, and improved thermal management are enhancing the appeal of power sports batteries. Consumer behavior shifts are also playing a crucial role. A growing segment of enthusiasts prioritizes performance, durability, and eco-friendliness, leading to a preference for premium battery solutions. The aftermarket segment, in particular, is experiencing strong growth as consumers seek to upgrade their existing vehicles with the latest battery technology. The estimated market penetration for Lithium Batteries is projected to reach XX% by 2025, a significant increase from XX% in 2019. The demand for electric power sports vehicles, though nascent, also represents a substantial future growth avenue. The overall market size is projected to reach $Y.YY billion by 2033, with a forecasted CAGR of 7.2% during the forecast period of 2025–2033.
Dominant Regions, Countries, or Segments in Power Sports Batteries
The Aftermarket/Replacement segment, particularly within the Lithium Batteries type, is currently the most dominant force driving growth in the global Power Sports Batteries market. This dominance is fueled by a confluence of economic policies, infrastructure development, and evolving consumer preferences across key regions. North America and Europe stand out as leading regions, with a high concentration of power sports enthusiasts and a strong aftermarket infrastructure.
- Application Dominance (Aftermarket/Replacement):
- Market Share: The aftermarket segment accounts for an estimated 60% of the total power sports battery market in 2025.
- Growth Potential: Fueled by the aging fleet of power sports vehicles and the desire for performance upgrades.
- Key Drivers: Robust distribution networks, availability of specialized retailers, and consumer awareness of battery performance benefits.
- Type Dominance (Lithium Batteries):
- Adoption Rate: Lithium batteries, specifically Lithium Iron Phosphate (LiFePO4), are witnessing an accelerated adoption rate, projected to capture XX% of the market by 2025.
- Performance Advantages: Lightweight, superior energy density, faster charging, and longer cycle life make them ideal for high-performance applications.
- Market Penetration: Increasing cost-effectiveness and manufacturer support are driving deeper penetration.
- Regional Dominance:
- North America: Boasts the largest market share due to a high prevalence of recreational vehicle usage, including motorcycles, ATVs, and snowmobiles. The estimated market size for North America in 2025 is $A.AA billion.
- Europe: Exhibits strong growth driven by a passionate motorcycle culture and increasing adoption of personal watercraft.
Power Sports Batteries Product Landscape
The power sports battery landscape is characterized by a relentless pursuit of enhanced performance and reliability. Innovations are centered around increasing energy density, reducing weight, and extending cycle life. Lithium-ion chemistries, particularly LiFePO4, are leading this charge, offering significant advantages over traditional lead-acid technologies. These advanced batteries are designed to withstand extreme temperatures and vibrations inherent in power sports applications, ensuring consistent power delivery and faster cranking. Unique selling propositions include higher CCA (Cold Cranking Amps) for improved starting in cold conditions and integrated battery management systems for optimal charging and discharge.
Key Drivers, Barriers & Challenges in Power Sports Batteries
The power sports battery market is propelled by several key drivers, including the increasing popularity of recreational motorsports, a growing demand for lighter and more powerful batteries, and continuous technological advancements leading to improved performance and lifespan. The burgeoning electric vehicle segment within power sports also presents a significant growth opportunity.
- Technological Advancements: Development of higher energy density lithium chemistries.
- Growing Recreational Motorsports: Increased participation in activities like motorcycle riding, ATV use, and snowmobiling.
- OEM Integration: Manufacturers incorporating advanced batteries into new vehicle models.
Conversely, the market faces several barriers and challenges. The initial higher cost of advanced battery technologies like lithium can be a deterrent for some consumers. Supply chain disruptions for critical raw materials and stringent manufacturing standards also pose significant hurdles.
- High Initial Cost: Premium pricing for lithium batteries compared to conventional options.
- Supply Chain Volatility: Fluctuations in raw material prices and availability.
- Regulatory Compliance: Adhering to evolving safety and environmental regulations.
- Technological Obsolescence: Rapid innovation cycles requiring continuous R&D investment.
Emerging Opportunities in Power Sports Batteries
Emerging opportunities in the power sports batteries sector lie in the expanding electric vehicle segment, innovative smart battery solutions, and untapped geographical markets. The development of faster charging technologies and batteries with integrated IoT capabilities for remote monitoring and diagnostics presents a significant avenue for differentiation. Furthermore, the increasing focus on sustainability is opening doors for batteries made from recycled materials and those with a longer end-of-life value.
Growth Accelerators in the Power Sports Batteries Industry
Long-term growth in the power sports batteries industry is being accelerated by ongoing technological breakthroughs in battery chemistry, leading to lighter, more powerful, and longer-lasting energy storage solutions. Strategic partnerships between battery manufacturers and original equipment manufacturers (OEMs) are crucial for ensuring seamless integration and widespread adoption of new technologies in the latest power sports vehicles. Market expansion strategies into emerging economies with a growing middle class and increasing interest in recreational activities also represent significant growth accelerators.
Key Players Shaping the Power Sports Batteries Market
- Panasonic
- CATL
- BYD
- GS Yuasa
- LG Chem
- East Penn Manufacturing
- Enersys
- Hitachi Chemical
- BAE Batterien
- Gotion
- Lishen
- TAB
- CSICP
- Clarios
- Microtex
- Zibo Torch Energy
- LEOCH
Notable Milestones in Power Sports Batteries Sector
- 2020 January: Panasonic announces a new generation of lightweight lithium-ion batteries for powersports vehicles, offering enhanced durability.
- 2021 April: CATL showcases its advanced battery management systems tailored for the harsh operating conditions of ATVs and snowmobiles.
- 2022 July: GS Yuasa introduces a new line of AGM batteries with improved cold-cranking performance for motorcycles.
- 2023 February: BYD expands its production capacity for lithium iron phosphate (LiFePO4) batteries, targeting the growing demand in the powersports aftermarket.
- 2024 June: LG Chem patents a novel battery chemistry promising faster charging and extended lifespan for powersports applications.
In-Depth Power Sports Batteries Market Outlook
The future of the power sports batteries market is exceptionally promising, driven by sustained innovation and expanding consumer engagement. Growth accelerators like the continued development of advanced lithium battery chemistries, the integration of smart battery technologies, and the increasing adoption of electric powertrains in power sports vehicles will shape the market's trajectory. Strategic collaborations between leading battery developers and prominent power sports brands will be pivotal in driving market penetration and unlocking new growth avenues, ensuring a dynamic and expanding future for the industry.
Power Sports Batteries Segmentation
-
1. Application
- 1.1. OEM
- 1.2. Aftermarket/ Replacement
-
2. Type
- 2.1. Conventional Batteries
- 2.2. AGM Batteries
- 2.3. Lithium Batteries
- 2.4. Others
Power Sports Batteries Segmentation By Geography
-
1. North America
- 1.1. United States
- 1.2. Canada
- 1.3. Mexico
-
2. South America
- 2.1. Brazil
- 2.2. Argentina
- 2.3. Rest of South America
-
3. Europe
- 3.1. United Kingdom
- 3.2. Germany
- 3.3. France
- 3.4. Italy
- 3.5. Spain
- 3.6. Russia
- 3.7. Benelux
- 3.8. Nordics
- 3.9. Rest of Europe
-
4. Middle East & Africa
- 4.1. Turkey
- 4.2. Israel
- 4.3. GCC
- 4.4. North Africa
- 4.5. South Africa
- 4.6. Rest of Middle East & Africa
-
5. Asia Pacific
- 5.1. China
- 5.2. India
- 5.3. Japan
- 5.4. South Korea
- 5.5. ASEAN
- 5.6. Oceania
- 5.7. Rest of Asia Pacific
Power Sports Batteries Regional Market Share
Geographic Coverage of Power Sports Batteries
Power Sports Batteries REPORT HIGHLIGHTS
| Aspects | Details |
|---|---|
| Study Period | 2020-2034 |
| Base Year | 2025 |
| Estimated Year | 2026 |
| Forecast Period | 2026-2034 |
| Historical Period | 2020-2025 |
| Growth Rate | CAGR of 5.8% from 2020-2034 |
| Segmentation |
|
Table of Contents
- 1. Introduction
- 1.1. Research Scope
- 1.2. Market Segmentation
- 1.3. Research Objective
- 1.4. Definitions and Assumptions
- 2. Executive Summary
- 2.1. Market Snapshot
- 3. Market Dynamics
- 3.1. Market Drivers
- 3.2. Market Restrains
- 3.3. Market Trends
- 3.4. Market Opportunities
- 4. Market Factor Analysis
- 4.1. Porters Five Forces
- 4.1.1. Bargaining Power of Suppliers
- 4.1.2. Bargaining Power of Buyers
- 4.1.3. Threat of New Entrants
- 4.1.4. Threat of Substitutes
- 4.1.5. Competitive Rivalry
- 4.2. PESTEL analysis
- 4.3. BCG Analysis
- 4.3.1. Stars (High Growth, High Market Share)
- 4.3.2. Cash Cows (Low Growth, High Market Share)
- 4.3.3. Question Mark (High Growth, Low Market Share)
- 4.3.4. Dogs (Low Growth, Low Market Share)
- 4.4. Ansoff Matrix Analysis
- 4.5. Supply Chain Analysis
- 4.6. Regulatory Landscape
- 4.7. Current Market Potential and Opportunity Assessment (TAM–SAM–SOM Framework)
- 4.8. VDR Analyst Note
- 4.1. Porters Five Forces
- 5. Market Analysis, Insights and Forecast 2021-2033
- 5.1. Market Analysis, Insights and Forecast - by Application
- 5.1.1. OEM
- 5.1.2. Aftermarket/ Replacement
- 5.2. Market Analysis, Insights and Forecast - by Type
- 5.2.1. Conventional Batteries
- 5.2.2. AGM Batteries
- 5.2.3. Lithium Batteries
- 5.2.4. Others
- 5.3. Market Analysis, Insights and Forecast - by Region
- 5.3.1. North America
- 5.3.2. South America
- 5.3.3. Europe
- 5.3.4. Middle East & Africa
- 5.3.5. Asia Pacific
- 5.1. Market Analysis, Insights and Forecast - by Application
- 6. Global Power Sports Batteries Analysis, Insights and Forecast, 2021-2033
- 6.1. Market Analysis, Insights and Forecast - by Application
- 6.1.1. OEM
- 6.1.2. Aftermarket/ Replacement
- 6.2. Market Analysis, Insights and Forecast - by Type
- 6.2.1. Conventional Batteries
- 6.2.2. AGM Batteries
- 6.2.3. Lithium Batteries
- 6.2.4. Others
- 6.1. Market Analysis, Insights and Forecast - by Application
- 7. North America Power Sports Batteries Analysis, Insights and Forecast, 2021-2033
- 7.1. Market Analysis, Insights and Forecast - by Application
- 7.1.1. OEM
- 7.1.2. Aftermarket/ Replacement
- 7.2. Market Analysis, Insights and Forecast - by Type
- 7.2.1. Conventional Batteries
- 7.2.2. AGM Batteries
- 7.2.3. Lithium Batteries
- 7.2.4. Others
- 7.1. Market Analysis, Insights and Forecast - by Application
- 8. South America Power Sports Batteries Analysis, Insights and Forecast, 2021-2033
- 8.1. Market Analysis, Insights and Forecast - by Application
- 8.1.1. OEM
- 8.1.2. Aftermarket/ Replacement
- 8.2. Market Analysis, Insights and Forecast - by Type
- 8.2.1. Conventional Batteries
- 8.2.2. AGM Batteries
- 8.2.3. Lithium Batteries
- 8.2.4. Others
- 8.1. Market Analysis, Insights and Forecast - by Application
- 9. Europe Power Sports Batteries Analysis, Insights and Forecast, 2021-2033
- 9.1. Market Analysis, Insights and Forecast - by Application
- 9.1.1. OEM
- 9.1.2. Aftermarket/ Replacement
- 9.2. Market Analysis, Insights and Forecast - by Type
- 9.2.1. Conventional Batteries
- 9.2.2. AGM Batteries
- 9.2.3. Lithium Batteries
- 9.2.4. Others
- 9.1. Market Analysis, Insights and Forecast - by Application
- 10. Middle East & Africa Power Sports Batteries Analysis, Insights and Forecast, 2021-2033
- 10.1. Market Analysis, Insights and Forecast - by Application
- 10.1.1. OEM
- 10.1.2. Aftermarket/ Replacement
- 10.2. Market Analysis, Insights and Forecast - by Type
- 10.2.1. Conventional Batteries
- 10.2.2. AGM Batteries
- 10.2.3. Lithium Batteries
- 10.2.4. Others
- 10.1. Market Analysis, Insights and Forecast - by Application
- 11. Asia Pacific Power Sports Batteries Analysis, Insights and Forecast, 2021-2033
- 11.1. Market Analysis, Insights and Forecast - by Application
- 11.1.1. OEM
- 11.1.2. Aftermarket/ Replacement
- 11.2. Market Analysis, Insights and Forecast - by Type
- 11.2.1. Conventional Batteries
- 11.2.2. AGM Batteries
- 11.2.3. Lithium Batteries
- 11.2.4. Others
- 11.1. Market Analysis, Insights and Forecast - by Application
- 12. Competitive Analysis
- 12.1. Company Profiles
- 12.1.1 Panasonic
- 12.1.1.1. Company Overview
- 12.1.1.2. Products
- 12.1.1.3. Company Financials
- 12.1.1.4. SWOT Analysis
- 12.1.2 CATL
- 12.1.2.1. Company Overview
- 12.1.2.2. Products
- 12.1.2.3. Company Financials
- 12.1.2.4. SWOT Analysis
- 12.1.3 BYD
- 12.1.3.1. Company Overview
- 12.1.3.2. Products
- 12.1.3.3. Company Financials
- 12.1.3.4. SWOT Analysis
- 12.1.4 GS Yuasa
- 12.1.4.1. Company Overview
- 12.1.4.2. Products
- 12.1.4.3. Company Financials
- 12.1.4.4. SWOT Analysis
- 12.1.5 LG Chem
- 12.1.5.1. Company Overview
- 12.1.5.2. Products
- 12.1.5.3. Company Financials
- 12.1.5.4. SWOT Analysis
- 12.1.6 East Penn Manufacturing
- 12.1.6.1. Company Overview
- 12.1.6.2. Products
- 12.1.6.3. Company Financials
- 12.1.6.4. SWOT Analysis
- 12.1.7 Enersys
- 12.1.7.1. Company Overview
- 12.1.7.2. Products
- 12.1.7.3. Company Financials
- 12.1.7.4. SWOT Analysis
- 12.1.8 Hitachi Chemical
- 12.1.8.1. Company Overview
- 12.1.8.2. Products
- 12.1.8.3. Company Financials
- 12.1.8.4. SWOT Analysis
- 12.1.9 BAE Batterien
- 12.1.9.1. Company Overview
- 12.1.9.2. Products
- 12.1.9.3. Company Financials
- 12.1.9.4. SWOT Analysis
- 12.1.10 Gotion
- 12.1.10.1. Company Overview
- 12.1.10.2. Products
- 12.1.10.3. Company Financials
- 12.1.10.4. SWOT Analysis
- 12.1.11 Lishen
- 12.1.11.1. Company Overview
- 12.1.11.2. Products
- 12.1.11.3. Company Financials
- 12.1.11.4. SWOT Analysis
- 12.1.12 TAB
- 12.1.12.1. Company Overview
- 12.1.12.2. Products
- 12.1.12.3. Company Financials
- 12.1.12.4. SWOT Analysis
- 12.1.13 CSICP
- 12.1.13.1. Company Overview
- 12.1.13.2. Products
- 12.1.13.3. Company Financials
- 12.1.13.4. SWOT Analysis
- 12.1.14 Clarios
- 12.1.14.1. Company Overview
- 12.1.14.2. Products
- 12.1.14.3. Company Financials
- 12.1.14.4. SWOT Analysis
- 12.1.15 Microtex
- 12.1.15.1. Company Overview
- 12.1.15.2. Products
- 12.1.15.3. Company Financials
- 12.1.15.4. SWOT Analysis
- 12.1.16 Zibo Torch Energy
- 12.1.16.1. Company Overview
- 12.1.16.2. Products
- 12.1.16.3. Company Financials
- 12.1.16.4. SWOT Analysis
- 12.1.17 LEOCH
- 12.1.17.1. Company Overview
- 12.1.17.2. Products
- 12.1.17.3. Company Financials
- 12.1.17.4. SWOT Analysis
- 12.1.1 Panasonic
- 12.2. Market Entropy
- 12.2.1 Company's Key Areas Served
- 12.2.2 Recent Developments
- 12.3. Company Market Share Analysis 2025
- 12.3.1 Top 5 Companies Market Share Analysis
- 12.3.2 Top 3 Companies Market Share Analysis
- 12.4. List of Potential Customers
- 13. Research Methodology
List of Figures
- Figure 1: Global Power Sports Batteries Revenue Breakdown (undefined, %) by Region 2025 & 2033
- Figure 2: Global Power Sports Batteries Volume Breakdown (K, %) by Region 2025 & 2033
- Figure 3: North America Power Sports Batteries Revenue (undefined), by Application 2025 & 2033
- Figure 4: North America Power Sports Batteries Volume (K), by Application 2025 & 2033
- Figure 5: North America Power Sports Batteries Revenue Share (%), by Application 2025 & 2033
- Figure 6: North America Power Sports Batteries Volume Share (%), by Application 2025 & 2033
- Figure 7: North America Power Sports Batteries Revenue (undefined), by Type 2025 & 2033
- Figure 8: North America Power Sports Batteries Volume (K), by Type 2025 & 2033
- Figure 9: North America Power Sports Batteries Revenue Share (%), by Type 2025 & 2033
- Figure 10: North America Power Sports Batteries Volume Share (%), by Type 2025 & 2033
- Figure 11: North America Power Sports Batteries Revenue (undefined), by Country 2025 & 2033
- Figure 12: North America Power Sports Batteries Volume (K), by Country 2025 & 2033
- Figure 13: North America Power Sports Batteries Revenue Share (%), by Country 2025 & 2033
- Figure 14: North America Power Sports Batteries Volume Share (%), by Country 2025 & 2033
- Figure 15: South America Power Sports Batteries Revenue (undefined), by Application 2025 & 2033
- Figure 16: South America Power Sports Batteries Volume (K), by Application 2025 & 2033
- Figure 17: South America Power Sports Batteries Revenue Share (%), by Application 2025 & 2033
- Figure 18: South America Power Sports Batteries Volume Share (%), by Application 2025 & 2033
- Figure 19: South America Power Sports Batteries Revenue (undefined), by Type 2025 & 2033
- Figure 20: South America Power Sports Batteries Volume (K), by Type 2025 & 2033
- Figure 21: South America Power Sports Batteries Revenue Share (%), by Type 2025 & 2033
- Figure 22: South America Power Sports Batteries Volume Share (%), by Type 2025 & 2033
- Figure 23: South America Power Sports Batteries Revenue (undefined), by Country 2025 & 2033
- Figure 24: South America Power Sports Batteries Volume (K), by Country 2025 & 2033
- Figure 25: South America Power Sports Batteries Revenue Share (%), by Country 2025 & 2033
- Figure 26: South America Power Sports Batteries Volume Share (%), by Country 2025 & 2033
- Figure 27: Europe Power Sports Batteries Revenue (undefined), by Application 2025 & 2033
- Figure 28: Europe Power Sports Batteries Volume (K), by Application 2025 & 2033
- Figure 29: Europe Power Sports Batteries Revenue Share (%), by Application 2025 & 2033
- Figure 30: Europe Power Sports Batteries Volume Share (%), by Application 2025 & 2033
- Figure 31: Europe Power Sports Batteries Revenue (undefined), by Type 2025 & 2033
- Figure 32: Europe Power Sports Batteries Volume (K), by Type 2025 & 2033
- Figure 33: Europe Power Sports Batteries Revenue Share (%), by Type 2025 & 2033
- Figure 34: Europe Power Sports Batteries Volume Share (%), by Type 2025 & 2033
- Figure 35: Europe Power Sports Batteries Revenue (undefined), by Country 2025 & 2033
- Figure 36: Europe Power Sports Batteries Volume (K), by Country 2025 & 2033
- Figure 37: Europe Power Sports Batteries Revenue Share (%), by Country 2025 & 2033
- Figure 38: Europe Power Sports Batteries Volume Share (%), by Country 2025 & 2033
- Figure 39: Middle East & Africa Power Sports Batteries Revenue (undefined), by Application 2025 & 2033
- Figure 40: Middle East & Africa Power Sports Batteries Volume (K), by Application 2025 & 2033
- Figure 41: Middle East & Africa Power Sports Batteries Revenue Share (%), by Application 2025 & 2033
- Figure 42: Middle East & Africa Power Sports Batteries Volume Share (%), by Application 2025 & 2033
- Figure 43: Middle East & Africa Power Sports Batteries Revenue (undefined), by Type 2025 & 2033
- Figure 44: Middle East & Africa Power Sports Batteries Volume (K), by Type 2025 & 2033
- Figure 45: Middle East & Africa Power Sports Batteries Revenue Share (%), by Type 2025 & 2033
- Figure 46: Middle East & Africa Power Sports Batteries Volume Share (%), by Type 2025 & 2033
- Figure 47: Middle East & Africa Power Sports Batteries Revenue (undefined), by Country 2025 & 2033
- Figure 48: Middle East & Africa Power Sports Batteries Volume (K), by Country 2025 & 2033
- Figure 49: Middle East & Africa Power Sports Batteries Revenue Share (%), by Country 2025 & 2033
- Figure 50: Middle East & Africa Power Sports Batteries Volume Share (%), by Country 2025 & 2033
- Figure 51: Asia Pacific Power Sports Batteries Revenue (undefined), by Application 2025 & 2033
- Figure 52: Asia Pacific Power Sports Batteries Volume (K), by Application 2025 & 2033
- Figure 53: Asia Pacific Power Sports Batteries Revenue Share (%), by Application 2025 & 2033
- Figure 54: Asia Pacific Power Sports Batteries Volume Share (%), by Application 2025 & 2033
- Figure 55: Asia Pacific Power Sports Batteries Revenue (undefined), by Type 2025 & 2033
- Figure 56: Asia Pacific Power Sports Batteries Volume (K), by Type 2025 & 2033
- Figure 57: Asia Pacific Power Sports Batteries Revenue Share (%), by Type 2025 & 2033
- Figure 58: Asia Pacific Power Sports Batteries Volume Share (%), by Type 2025 & 2033
- Figure 59: Asia Pacific Power Sports Batteries Revenue (undefined), by Country 2025 & 2033
- Figure 60: Asia Pacific Power Sports Batteries Volume (K), by Country 2025 & 2033
- Figure 61: Asia Pacific Power Sports Batteries Revenue Share (%), by Country 2025 & 2033
- Figure 62: Asia Pacific Power Sports Batteries Volume Share (%), by Country 2025 & 2033
List of Tables
- Table 1: Global Power Sports Batteries Revenue undefined Forecast, by Application 2020 & 2033
- Table 2: Global Power Sports Batteries Volume K Forecast, by Application 2020 & 2033
- Table 3: Global Power Sports Batteries Revenue undefined Forecast, by Type 2020 & 2033
- Table 4: Global Power Sports Batteries Volume K Forecast, by Type 2020 & 2033
- Table 5: Global Power Sports Batteries Revenue undefined Forecast, by Region 2020 & 2033
- Table 6: Global Power Sports Batteries Volume K Forecast, by Region 2020 & 2033
- Table 7: Global Power Sports Batteries Revenue undefined Forecast, by Application 2020 & 2033
- Table 8: Global Power Sports Batteries Volume K Forecast, by Application 2020 & 2033
- Table 9: Global Power Sports Batteries Revenue undefined Forecast, by Type 2020 & 2033
- Table 10: Global Power Sports Batteries Volume K Forecast, by Type 2020 & 2033
- Table 11: Global Power Sports Batteries Revenue undefined Forecast, by Country 2020 & 2033
- Table 12: Global Power Sports Batteries Volume K Forecast, by Country 2020 & 2033
- Table 13: United States Power Sports Batteries Revenue (undefined) Forecast, by Application 2020 & 2033
- Table 14: United States Power Sports Batteries Volume (K) Forecast, by Application 2020 & 2033
- Table 15: Canada Power Sports Batteries Revenue (undefined) Forecast, by Application 2020 & 2033
- Table 16: Canada Power Sports Batteries Volume (K) Forecast, by Application 2020 & 2033
- Table 17: Mexico Power Sports Batteries Revenue (undefined) Forecast, by Application 2020 & 2033
- Table 18: Mexico Power Sports Batteries Volume (K) Forecast, by Application 2020 & 2033
- Table 19: Global Power Sports Batteries Revenue undefined Forecast, by Application 2020 & 2033
- Table 20: Global Power Sports Batteries Volume K Forecast, by Application 2020 & 2033
- Table 21: Global Power Sports Batteries Revenue undefined Forecast, by Type 2020 & 2033
- Table 22: Global Power Sports Batteries Volume K Forecast, by Type 2020 & 2033
- Table 23: Global Power Sports Batteries Revenue undefined Forecast, by Country 2020 & 2033
- Table 24: Global Power Sports Batteries Volume K Forecast, by Country 2020 & 2033
- Table 25: Brazil Power Sports Batteries Revenue (undefined) Forecast, by Application 2020 & 2033
- Table 26: Brazil Power Sports Batteries Volume (K) Forecast, by Application 2020 & 2033
- Table 27: Argentina Power Sports Batteries Revenue (undefined) Forecast, by Application 2020 & 2033
- Table 28: Argentina Power Sports Batteries Volume (K) Forecast, by Application 2020 & 2033
- Table 29: Rest of South America Power Sports Batteries Revenue (undefined) Forecast, by Application 2020 & 2033
- Table 30: Rest of South America Power Sports Batteries Volume (K) Forecast, by Application 2020 & 2033
- Table 31: Global Power Sports Batteries Revenue undefined Forecast, by Application 2020 & 2033
- Table 32: Global Power Sports Batteries Volume K Forecast, by Application 2020 & 2033
- Table 33: Global Power Sports Batteries Revenue undefined Forecast, by Type 2020 & 2033
- Table 34: Global Power Sports Batteries Volume K Forecast, by Type 2020 & 2033
- Table 35: Global Power Sports Batteries Revenue undefined Forecast, by Country 2020 & 2033
- Table 36: Global Power Sports Batteries Volume K Forecast, by Country 2020 & 2033
- Table 37: United Kingdom Power Sports Batteries Revenue (undefined) Forecast, by Application 2020 & 2033
- Table 38: United Kingdom Power Sports Batteries Volume (K) Forecast, by Application 2020 & 2033
- Table 39: Germany Power Sports Batteries Revenue (undefined) Forecast, by Application 2020 & 2033
- Table 40: Germany Power Sports Batteries Volume (K) Forecast, by Application 2020 & 2033
- Table 41: France Power Sports Batteries Revenue (undefined) Forecast, by Application 2020 & 2033
- Table 42: France Power Sports Batteries Volume (K) Forecast, by Application 2020 & 2033
- Table 43: Italy Power Sports Batteries Revenue (undefined) Forecast, by Application 2020 & 2033
- Table 44: Italy Power Sports Batteries Volume (K) Forecast, by Application 2020 & 2033
- Table 45: Spain Power Sports Batteries Revenue (undefined) Forecast, by Application 2020 & 2033
- Table 46: Spain Power Sports Batteries Volume (K) Forecast, by Application 2020 & 2033
- Table 47: Russia Power Sports Batteries Revenue (undefined) Forecast, by Application 2020 & 2033
- Table 48: Russia Power Sports Batteries Volume (K) Forecast, by Application 2020 & 2033
- Table 49: Benelux Power Sports Batteries Revenue (undefined) Forecast, by Application 2020 & 2033
- Table 50: Benelux Power Sports Batteries Volume (K) Forecast, by Application 2020 & 2033
- Table 51: Nordics Power Sports Batteries Revenue (undefined) Forecast, by Application 2020 & 2033
- Table 52: Nordics Power Sports Batteries Volume (K) Forecast, by Application 2020 & 2033
- Table 53: Rest of Europe Power Sports Batteries Revenue (undefined) Forecast, by Application 2020 & 2033
- Table 54: Rest of Europe Power Sports Batteries Volume (K) Forecast, by Application 2020 & 2033
- Table 55: Global Power Sports Batteries Revenue undefined Forecast, by Application 2020 & 2033
- Table 56: Global Power Sports Batteries Volume K Forecast, by Application 2020 & 2033
- Table 57: Global Power Sports Batteries Revenue undefined Forecast, by Type 2020 & 2033
- Table 58: Global Power Sports Batteries Volume K Forecast, by Type 2020 & 2033
- Table 59: Global Power Sports Batteries Revenue undefined Forecast, by Country 2020 & 2033
- Table 60: Global Power Sports Batteries Volume K Forecast, by Country 2020 & 2033
- Table 61: Turkey Power Sports Batteries Revenue (undefined) Forecast, by Application 2020 & 2033
- Table 62: Turkey Power Sports Batteries Volume (K) Forecast, by Application 2020 & 2033
- Table 63: Israel Power Sports Batteries Revenue (undefined) Forecast, by Application 2020 & 2033
- Table 64: Israel Power Sports Batteries Volume (K) Forecast, by Application 2020 & 2033
- Table 65: GCC Power Sports Batteries Revenue (undefined) Forecast, by Application 2020 & 2033
- Table 66: GCC Power Sports Batteries Volume (K) Forecast, by Application 2020 & 2033
- Table 67: North Africa Power Sports Batteries Revenue (undefined) Forecast, by Application 2020 & 2033
- Table 68: North Africa Power Sports Batteries Volume (K) Forecast, by Application 2020 & 2033
- Table 69: South Africa Power Sports Batteries Revenue (undefined) Forecast, by Application 2020 & 2033
- Table 70: South Africa Power Sports Batteries Volume (K) Forecast, by Application 2020 & 2033
- Table 71: Rest of Middle East & Africa Power Sports Batteries Revenue (undefined) Forecast, by Application 2020 & 2033
- Table 72: Rest of Middle East & Africa Power Sports Batteries Volume (K) Forecast, by Application 2020 & 2033
- Table 73: Global Power Sports Batteries Revenue undefined Forecast, by Application 2020 & 2033
- Table 74: Global Power Sports Batteries Volume K Forecast, by Application 2020 & 2033
- Table 75: Global Power Sports Batteries Revenue undefined Forecast, by Type 2020 & 2033
- Table 76: Global Power Sports Batteries Volume K Forecast, by Type 2020 & 2033
- Table 77: Global Power Sports Batteries Revenue undefined Forecast, by Country 2020 & 2033
- Table 78: Global Power Sports Batteries Volume K Forecast, by Country 2020 & 2033
- Table 79: China Power Sports Batteries Revenue (undefined) Forecast, by Application 2020 & 2033
- Table 80: China Power Sports Batteries Volume (K) Forecast, by Application 2020 & 2033
- Table 81: India Power Sports Batteries Revenue (undefined) Forecast, by Application 2020 & 2033
- Table 82: India Power Sports Batteries Volume (K) Forecast, by Application 2020 & 2033
- Table 83: Japan Power Sports Batteries Revenue (undefined) Forecast, by Application 2020 & 2033
- Table 84: Japan Power Sports Batteries Volume (K) Forecast, by Application 2020 & 2033
- Table 85: South Korea Power Sports Batteries Revenue (undefined) Forecast, by Application 2020 & 2033
- Table 86: South Korea Power Sports Batteries Volume (K) Forecast, by Application 2020 & 2033
- Table 87: ASEAN Power Sports Batteries Revenue (undefined) Forecast, by Application 2020 & 2033
- Table 88: ASEAN Power Sports Batteries Volume (K) Forecast, by Application 2020 & 2033
- Table 89: Oceania Power Sports Batteries Revenue (undefined) Forecast, by Application 2020 & 2033
- Table 90: Oceania Power Sports Batteries Volume (K) Forecast, by Application 2020 & 2033
- Table 91: Rest of Asia Pacific Power Sports Batteries Revenue (undefined) Forecast, by Application 2020 & 2033
- Table 92: Rest of Asia Pacific Power Sports Batteries Volume (K) Forecast, by Application 2020 & 2033
Frequently Asked Questions
1. What is the projected Compound Annual Growth Rate (CAGR) of the Power Sports Batteries?
The projected CAGR is approximately 5.8%.
2. Which companies are prominent players in the Power Sports Batteries?
Key companies in the market include Panasonic, CATL, BYD, GS Yuasa, LG Chem, East Penn Manufacturing, Enersys, Hitachi Chemical, BAE Batterien, Gotion, Lishen, TAB, CSICP, Clarios, Microtex, Zibo Torch Energy, LEOCH.
3. What are the main segments of the Power Sports Batteries?
The market segments include Application, Type.
4. Can you provide details about the market size?
The market size is estimated to be USD XXX N/A as of 2022.
5. What are some drivers contributing to market growth?
N/A
6. What are the notable trends driving market growth?
N/A
7. Are there any restraints impacting market growth?
N/A
8. Can you provide examples of recent developments in the market?
N/A
9. What pricing options are available for accessing the report?
Pricing options include single-user, multi-user, and enterprise licenses priced at USD 3950.00, USD 5925.00, and USD 7900.00 respectively.
10. Is the market size provided in terms of value or volume?
The market size is provided in terms of value, measured in N/A and volume, measured in K.
11. Are there any specific market keywords associated with the report?
Yes, the market keyword associated with the report is "Power Sports Batteries," which aids in identifying and referencing the specific market segment covered.
12. How do I determine which pricing option suits my needs best?
The pricing options vary based on user requirements and access needs. Individual users may opt for single-user licenses, while businesses requiring broader access may choose multi-user or enterprise licenses for cost-effective access to the report.
13. Are there any additional resources or data provided in the Power Sports Batteries report?
While the report offers comprehensive insights, it's advisable to review the specific contents or supplementary materials provided to ascertain if additional resources or data are available.
14. How can I stay updated on further developments or reports in the Power Sports Batteries?
To stay informed about further developments, trends, and reports in the Power Sports Batteries, consider subscribing to industry newsletters, following relevant companies and organizations, or regularly checking reputable industry news sources and publications.
Methodology
Step 1 - Identification of Relevant Samples Size from Population Database


Step 2 - Approaches for Defining Global Market Size (Value, Volume* & Price*)

Note*: In applicable scenarios
Step 3 - Data Sources
Primary Research
- Web Analytics
- Survey Reports
- Research Institute
- Latest Research Reports
- Opinion Leaders
Secondary Research
- Annual Reports
- White Paper
- Latest Press Release
- Industry Association
- Paid Database
- Investor Presentations

Step 4 - Data Triangulation
Involves using different sources of information in order to increase the validity of a study
These sources are likely to be stakeholders in a program - participants, other researchers, program staff, other community members, and so on.
Then we put all data in single framework & apply various statistical tools to find out the dynamic on the market.
During the analysis stage, feedback from the stakeholder groups would be compared to determine areas of agreement as well as areas of divergence