
Key Insights
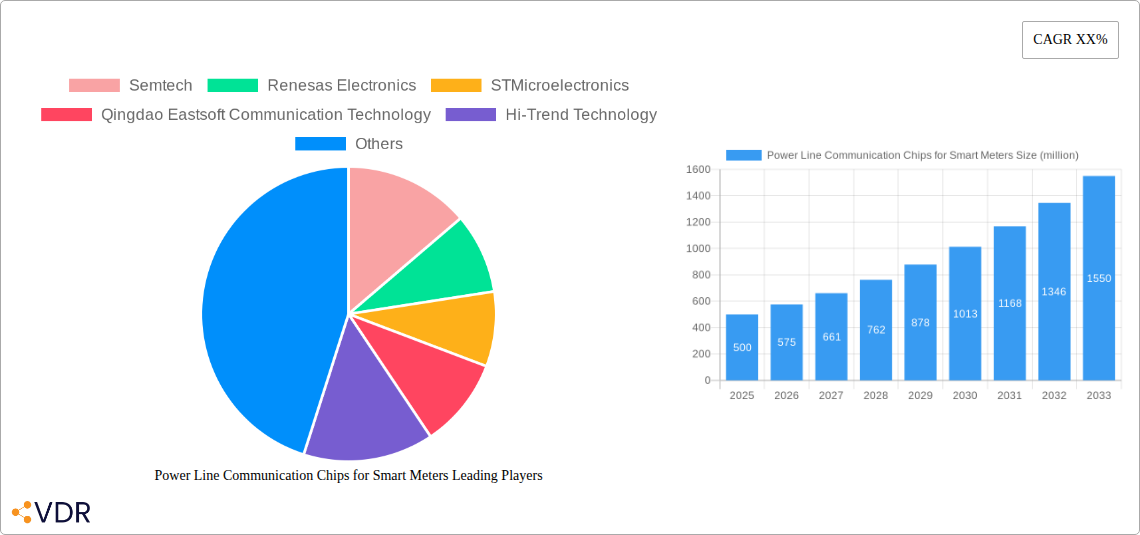
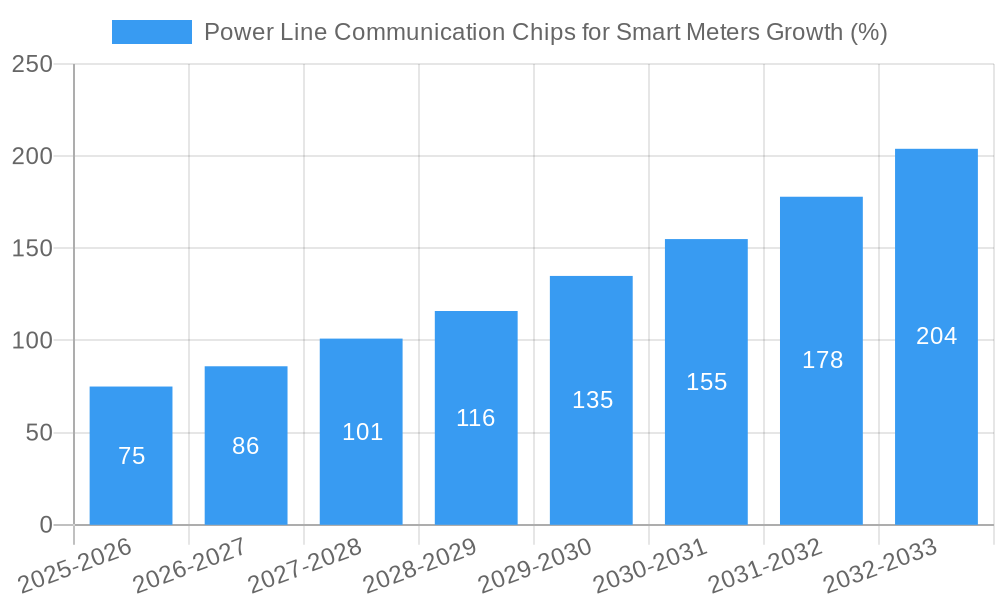
The global market for Power Line Communication (PLC) chips for smart meters is experiencing robust growth, driven by the increasing adoption of smart grids and the need for efficient, reliable energy management solutions. The market, estimated at $500 million in 2025, is projected to witness a Compound Annual Growth Rate (CAGR) of 15% from 2025 to 2033, reaching approximately $1.5 billion by 2033. Key drivers include government initiatives promoting smart city infrastructure, the expanding demand for advanced metering infrastructure (AMI), and the growing need for real-time data monitoring and analysis in utility networks. Technological advancements in PLC chip technology, such as improved power efficiency, higher data rates, and enhanced noise immunity, further fuel market expansion. The segment encompassing high-frequency PLC chips is expected to dominate, due to their capacity for greater data throughput and wider application in advanced smart metering systems. Leading players like Semtech, Renesas Electronics, and STMicroelectronics are investing heavily in R&D and strategic partnerships to consolidate their market positions. However, challenges such as interoperability issues between different PLC technologies and the high initial investment costs associated with smart meter deployments could potentially hinder market growth to some degree.
Despite these challenges, the long-term outlook for PLC chips in the smart meter sector remains positive. The increasing focus on renewable energy integration and the need for grid modernization will continue to drive demand for sophisticated smart metering solutions. The market is witnessing a shift towards more sophisticated data analytics capabilities within smart metering, enabling utilities to optimize energy distribution and enhance grid reliability. This trend, coupled with continuous improvements in PLC technology and declining costs, is expected to sustain the impressive growth trajectory of this market segment well into the next decade. The competitive landscape is characterized by both established players and emerging companies, fostering innovation and pushing the boundaries of PLC technology for enhanced smart metering applications.
Power Line Communication (PLC) Chips for Smart Meters Market Report: 2019-2033
This comprehensive report delivers an in-depth analysis of the Power Line Communication (PLC) Chips for Smart Meters market, providing crucial insights for industry professionals, investors, and strategic decision-makers. The study covers the period 2019-2033, with a focus on the forecast period 2025-2033, using 2025 as the base year and estimated year. The parent market is the Smart Meter market, and the child market is PLC Chips specifically for smart meter applications. The report projects a market size of xx million units by 2033.
Power Line Communication Chips for Smart Meters Market Dynamics & Structure
This section analyzes the market's competitive landscape, technological advancements, regulatory influences, and market trends. We delve into market concentration, identifying key players such as Semtech, Renesas Electronics, STMicroelectronics, Qingdao Eastsoft Communication Technology, Hi-Trend Technology, Leaguer (Shenzhen) Microelectronics, Beijing Smartchip Microelectronics Technology, Triductor Technology, and Hisilicon. The analysis incorporates M&A activity, assessing deal volumes and their impact on market share. Innovation barriers, including technological limitations and regulatory hurdles, are also examined.
- Market Concentration: The market exhibits a moderately concentrated structure, with the top 5 players holding approximately xx% of the market share in 2025.
- Technological Innovation: Key drivers include advancements in PLC technology (e.g., G3-PLC, PRIME), improved power efficiency, and enhanced data security features.
- Regulatory Framework: Government regulations promoting smart grid initiatives and energy efficiency significantly impact market growth.
- Competitive Substitutes: Alternative communication technologies like cellular and Wi-Fi pose competitive challenges.
- End-User Demographics: The primary end-users are utility companies and smart meter manufacturers.
- M&A Trends: The number of M&A deals in the PLC chip sector increased by xx% between 2020 and 2024, driven by consolidation and technological integration.
Power Line Communication Chips for Smart Meters Growth Trends & Insights
This section provides a detailed analysis of market size evolution, adoption rates, and technological disruptions using a combination of qualitative and quantitative data. We analyze the Compound Annual Growth Rate (CAGR) for the forecast period (2025-2033), along with market penetration rates across various regions and segments. The impact of consumer behavior shifts (e.g., increasing demand for smart energy management solutions) is also assessed. The analysis leverages extensive secondary research, including industry reports, company filings, and news articles, to present a comprehensive picture of market growth trends. Key factors influencing adoption are identified and their impact on future growth is evaluated.
- CAGR (2025-2033): xx%
- Market Penetration: xx% in 2025, projected to reach xx% by 2033.
Dominant Regions, Countries, or Segments in Power Line Communication Chips for Smart Meters
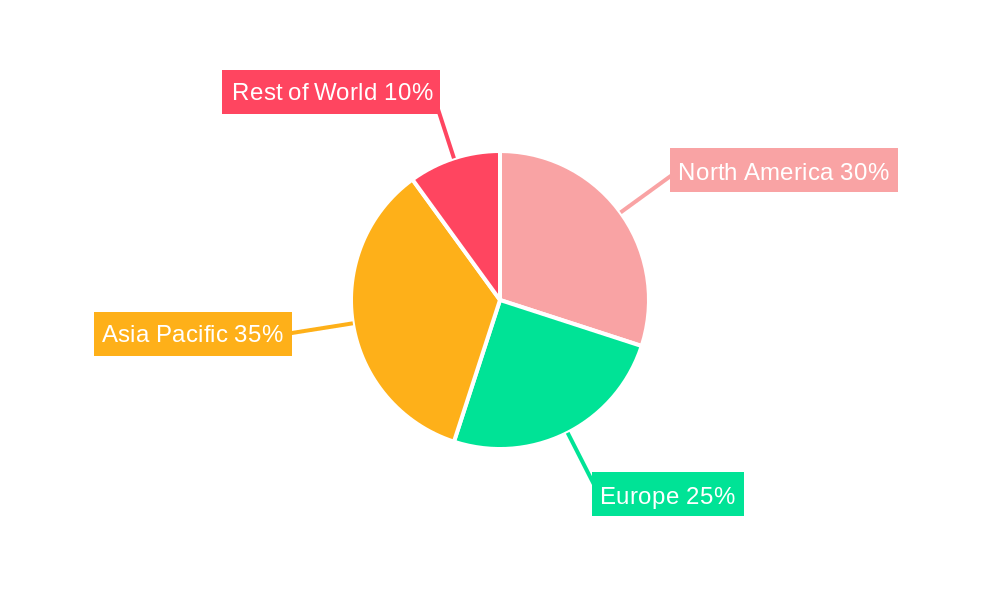
This section identifies the leading regions and segments driving market growth. We analyze market share and growth potential for each region, considering factors such as economic policies, infrastructure development, and regulatory environments. For example, North America and Europe are expected to maintain strong growth due to widespread smart grid deployments, while Asia-Pacific exhibits high growth potential driven by increasing urbanization and government initiatives. Country-specific analyses highlight market size, growth trends, and key drivers.
- Leading Region: North America (xx% market share in 2025)
- Key Drivers (North America): Robust regulatory support, well-established smart grid infrastructure, and high adoption rates among utility companies.
- Leading Segment: Residential (xx% market share in 2025)
- Key Drivers (Residential Segment): Increasing consumer awareness of energy efficiency and smart home technologies.
Power Line Communication Chips for Smart Meters Product Landscape
This section provides an overview of the PLC chip product landscape, highlighting key features, applications, and performance metrics. Innovations in PLC technology, such as improved data rates, power efficiency, and security protocols, are discussed. Unique selling propositions (USPs) of different chipsets and technological advancements in areas like noise immunity and range extension are also detailed.
Key Drivers, Barriers & Challenges in Power Line Communication Chips for Smart Meters
This section identifies key growth drivers and challenges facing the market. Drivers include increasing demand for smart meters, government initiatives promoting smart grids, and technological advancements in PLC technology. Challenges include interoperability issues, security concerns, and the high initial investment costs associated with smart meter deployments.
- Key Drivers: Government regulations supporting smart grid deployments, increasing demand for energy efficiency, and technological advancements in PLC technology.
- Key Challenges: Security concerns, interoperability issues across different PLC standards, and high initial investment costs.
Emerging Opportunities in Power Line Communication Chips for Smart Meters
This section highlights emerging opportunities, such as the growing adoption of smart meters in developing countries, the integration of PLC chips with other smart grid technologies, and the potential for new applications in areas like smart agriculture and water management.
Growth Accelerators in the Power Line Communication Chips for Smart Meters Industry
Technological breakthroughs, strategic partnerships between chip manufacturers and smart meter providers, and market expansion strategies (e.g., targeting new geographical regions) are key catalysts driving long-term market growth.
Key Players Shaping the Power Line Communication Chips for Smart Meters Market
- Semtech
- Renesas Electronics
- STMicroelectronics
- Qingdao Eastsoft Communication Technology
- Hi-Trend Technology
- Leaguer (Shenzhen) Microelectronics
- Beijing Smartchip Microelectronics Technology
- Triductor Technology
- Hisilicon
Notable Milestones in Power Line Communication Chips for Smart Meters Sector
- 2020: Semtech launched a new generation of PLC chips with enhanced security features.
- 2022: Renesas Electronics acquired a smaller PLC chip manufacturer, expanding its product portfolio.
- 2023: Significant investments in R&D by major players were announced focusing on improving PLC's range and speed.
In-Depth Power Line Communication Chips for Smart Meters Market Outlook
The market for PLC chips in smart meters is poised for significant growth, driven by ongoing smart grid deployments and the increasing demand for energy-efficient solutions. Strategic partnerships and technological innovations are expected to further accelerate market expansion in the coming years, presenting substantial opportunities for industry players. The market is projected to continue its upward trajectory, with a steady increase in demand from both developed and developing economies.
Power Line Communication Chips for Smart Meters Segmentation
-
1. Application
- 1.1. Residential Smart Meter
- 1.2. Commercial Smart Meter
- 1.3. Industrial Smart Meter
- 1.4. Municipal Smart Meter
-
2. Types
- 2.1. OFDM Power Line Communication Chips
- 2.2. HPLC Power Line Communication Chips
- 2.3. BPSK Power Line Communication Chips
Power Line Communication Chips for Smart Meters Segmentation By Geography
-
1. North America
- 1.1. United States
- 1.2. Canada
- 1.3. Mexico
-
2. South America
- 2.1. Brazil
- 2.2. Argentina
- 2.3. Rest of South America
-
3. Europe
- 3.1. United Kingdom
- 3.2. Germany
- 3.3. France
- 3.4. Italy
- 3.5. Spain
- 3.6. Russia
- 3.7. Benelux
- 3.8. Nordics
- 3.9. Rest of Europe
-
4. Middle East & Africa
- 4.1. Turkey
- 4.2. Israel
- 4.3. GCC
- 4.4. North Africa
- 4.5. South Africa
- 4.6. Rest of Middle East & Africa
-
5. Asia Pacific
- 5.1. China
- 5.2. India
- 5.3. Japan
- 5.4. South Korea
- 5.5. ASEAN
- 5.6. Oceania
- 5.7. Rest of Asia Pacific
Power Line Communication Chips for Smart Meters REPORT HIGHLIGHTS
| Aspects | Details |
|---|---|
| Study Period | 2019-2033 |
| Base Year | 2024 |
| Estimated Year | 2025 |
| Forecast Period | 2025-2033 |
| Historical Period | 2019-2024 |
| Growth Rate | CAGR of XX% from 2019-2033 |
| Segmentation |
|
Table of Contents
- 1. Introduction
- 1.1. Research Scope
- 1.2. Market Segmentation
- 1.3. Research Methodology
- 1.4. Definitions and Assumptions
- 2. Executive Summary
- 2.1. Introduction
- 3. Market Dynamics
- 3.1. Introduction
- 3.2. Market Drivers
- 3.3. Market Restrains
- 3.4. Market Trends
- 4. Market Factor Analysis
- 4.1. Porters Five Forces
- 4.2. Supply/Value Chain
- 4.3. PESTEL analysis
- 4.4. Market Entropy
- 4.5. Patent/Trademark Analysis
- 5. Global Power Line Communication Chips for Smart Meters Analysis, Insights and Forecast, 2019-2031
- 5.1. Market Analysis, Insights and Forecast - by Application
- 5.1.1. Residential Smart Meter
- 5.1.2. Commercial Smart Meter
- 5.1.3. Industrial Smart Meter
- 5.1.4. Municipal Smart Meter
- 5.2. Market Analysis, Insights and Forecast - by Types
- 5.2.1. OFDM Power Line Communication Chips
- 5.2.2. HPLC Power Line Communication Chips
- 5.2.3. BPSK Power Line Communication Chips
- 5.3. Market Analysis, Insights and Forecast - by Region
- 5.3.1. North America
- 5.3.2. South America
- 5.3.3. Europe
- 5.3.4. Middle East & Africa
- 5.3.5. Asia Pacific
- 5.1. Market Analysis, Insights and Forecast - by Application
- 6. North America Power Line Communication Chips for Smart Meters Analysis, Insights and Forecast, 2019-2031
- 6.1. Market Analysis, Insights and Forecast - by Application
- 6.1.1. Residential Smart Meter
- 6.1.2. Commercial Smart Meter
- 6.1.3. Industrial Smart Meter
- 6.1.4. Municipal Smart Meter
- 6.2. Market Analysis, Insights and Forecast - by Types
- 6.2.1. OFDM Power Line Communication Chips
- 6.2.2. HPLC Power Line Communication Chips
- 6.2.3. BPSK Power Line Communication Chips
- 6.1. Market Analysis, Insights and Forecast - by Application
- 7. South America Power Line Communication Chips for Smart Meters Analysis, Insights and Forecast, 2019-2031
- 7.1. Market Analysis, Insights and Forecast - by Application
- 7.1.1. Residential Smart Meter
- 7.1.2. Commercial Smart Meter
- 7.1.3. Industrial Smart Meter
- 7.1.4. Municipal Smart Meter
- 7.2. Market Analysis, Insights and Forecast - by Types
- 7.2.1. OFDM Power Line Communication Chips
- 7.2.2. HPLC Power Line Communication Chips
- 7.2.3. BPSK Power Line Communication Chips
- 7.1. Market Analysis, Insights and Forecast - by Application
- 8. Europe Power Line Communication Chips for Smart Meters Analysis, Insights and Forecast, 2019-2031
- 8.1. Market Analysis, Insights and Forecast - by Application
- 8.1.1. Residential Smart Meter
- 8.1.2. Commercial Smart Meter
- 8.1.3. Industrial Smart Meter
- 8.1.4. Municipal Smart Meter
- 8.2. Market Analysis, Insights and Forecast - by Types
- 8.2.1. OFDM Power Line Communication Chips
- 8.2.2. HPLC Power Line Communication Chips
- 8.2.3. BPSK Power Line Communication Chips
- 8.1. Market Analysis, Insights and Forecast - by Application
- 9. Middle East & Africa Power Line Communication Chips for Smart Meters Analysis, Insights and Forecast, 2019-2031
- 9.1. Market Analysis, Insights and Forecast - by Application
- 9.1.1. Residential Smart Meter
- 9.1.2. Commercial Smart Meter
- 9.1.3. Industrial Smart Meter
- 9.1.4. Municipal Smart Meter
- 9.2. Market Analysis, Insights and Forecast - by Types
- 9.2.1. OFDM Power Line Communication Chips
- 9.2.2. HPLC Power Line Communication Chips
- 9.2.3. BPSK Power Line Communication Chips
- 9.1. Market Analysis, Insights and Forecast - by Application
- 10. Asia Pacific Power Line Communication Chips for Smart Meters Analysis, Insights and Forecast, 2019-2031
- 10.1. Market Analysis, Insights and Forecast - by Application
- 10.1.1. Residential Smart Meter
- 10.1.2. Commercial Smart Meter
- 10.1.3. Industrial Smart Meter
- 10.1.4. Municipal Smart Meter
- 10.2. Market Analysis, Insights and Forecast - by Types
- 10.2.1. OFDM Power Line Communication Chips
- 10.2.2. HPLC Power Line Communication Chips
- 10.2.3. BPSK Power Line Communication Chips
- 10.1. Market Analysis, Insights and Forecast - by Application
- 11. Competitive Analysis
- 11.1. Global Market Share Analysis 2024
- 11.2. Company Profiles
- 11.2.1 Semtech
- 11.2.1.1. Overview
- 11.2.1.2. Products
- 11.2.1.3. SWOT Analysis
- 11.2.1.4. Recent Developments
- 11.2.1.5. Financials (Based on Availability)
- 11.2.2 Renesas Electronics
- 11.2.2.1. Overview
- 11.2.2.2. Products
- 11.2.2.3. SWOT Analysis
- 11.2.2.4. Recent Developments
- 11.2.2.5. Financials (Based on Availability)
- 11.2.3 STMicroelectronics
- 11.2.3.1. Overview
- 11.2.3.2. Products
- 11.2.3.3. SWOT Analysis
- 11.2.3.4. Recent Developments
- 11.2.3.5. Financials (Based on Availability)
- 11.2.4 Qingdao Eastsoft Communication Technology
- 11.2.4.1. Overview
- 11.2.4.2. Products
- 11.2.4.3. SWOT Analysis
- 11.2.4.4. Recent Developments
- 11.2.4.5. Financials (Based on Availability)
- 11.2.5 Hi-Trend Technology
- 11.2.5.1. Overview
- 11.2.5.2. Products
- 11.2.5.3. SWOT Analysis
- 11.2.5.4. Recent Developments
- 11.2.5.5. Financials (Based on Availability)
- 11.2.6 Leaguer (Shenzhen) Microelectronics
- 11.2.6.1. Overview
- 11.2.6.2. Products
- 11.2.6.3. SWOT Analysis
- 11.2.6.4. Recent Developments
- 11.2.6.5. Financials (Based on Availability)
- 11.2.7 Beijing Smartchip Microelectronics Technology
- 11.2.7.1. Overview
- 11.2.7.2. Products
- 11.2.7.3. SWOT Analysis
- 11.2.7.4. Recent Developments
- 11.2.7.5. Financials (Based on Availability)
- 11.2.8 Triductor Technology
- 11.2.8.1. Overview
- 11.2.8.2. Products
- 11.2.8.3. SWOT Analysis
- 11.2.8.4. Recent Developments
- 11.2.8.5. Financials (Based on Availability)
- 11.2.9 Hisilicon
- 11.2.9.1. Overview
- 11.2.9.2. Products
- 11.2.9.3. SWOT Analysis
- 11.2.9.4. Recent Developments
- 11.2.9.5. Financials (Based on Availability)
- 11.2.1 Semtech
List of Figures
- Figure 1: Global Power Line Communication Chips for Smart Meters Revenue Breakdown (million, %) by Region 2024 & 2032
- Figure 2: North America Power Line Communication Chips for Smart Meters Revenue (million), by Application 2024 & 2032
- Figure 3: North America Power Line Communication Chips for Smart Meters Revenue Share (%), by Application 2024 & 2032
- Figure 4: North America Power Line Communication Chips for Smart Meters Revenue (million), by Types 2024 & 2032
- Figure 5: North America Power Line Communication Chips for Smart Meters Revenue Share (%), by Types 2024 & 2032
- Figure 6: North America Power Line Communication Chips for Smart Meters Revenue (million), by Country 2024 & 2032
- Figure 7: North America Power Line Communication Chips for Smart Meters Revenue Share (%), by Country 2024 & 2032
- Figure 8: South America Power Line Communication Chips for Smart Meters Revenue (million), by Application 2024 & 2032
- Figure 9: South America Power Line Communication Chips for Smart Meters Revenue Share (%), by Application 2024 & 2032
- Figure 10: South America Power Line Communication Chips for Smart Meters Revenue (million), by Types 2024 & 2032
- Figure 11: South America Power Line Communication Chips for Smart Meters Revenue Share (%), by Types 2024 & 2032
- Figure 12: South America Power Line Communication Chips for Smart Meters Revenue (million), by Country 2024 & 2032
- Figure 13: South America Power Line Communication Chips for Smart Meters Revenue Share (%), by Country 2024 & 2032
- Figure 14: Europe Power Line Communication Chips for Smart Meters Revenue (million), by Application 2024 & 2032
- Figure 15: Europe Power Line Communication Chips for Smart Meters Revenue Share (%), by Application 2024 & 2032
- Figure 16: Europe Power Line Communication Chips for Smart Meters Revenue (million), by Types 2024 & 2032
- Figure 17: Europe Power Line Communication Chips for Smart Meters Revenue Share (%), by Types 2024 & 2032
- Figure 18: Europe Power Line Communication Chips for Smart Meters Revenue (million), by Country 2024 & 2032
- Figure 19: Europe Power Line Communication Chips for Smart Meters Revenue Share (%), by Country 2024 & 2032
- Figure 20: Middle East & Africa Power Line Communication Chips for Smart Meters Revenue (million), by Application 2024 & 2032
- Figure 21: Middle East & Africa Power Line Communication Chips for Smart Meters Revenue Share (%), by Application 2024 & 2032
- Figure 22: Middle East & Africa Power Line Communication Chips for Smart Meters Revenue (million), by Types 2024 & 2032
- Figure 23: Middle East & Africa Power Line Communication Chips for Smart Meters Revenue Share (%), by Types 2024 & 2032
- Figure 24: Middle East & Africa Power Line Communication Chips for Smart Meters Revenue (million), by Country 2024 & 2032
- Figure 25: Middle East & Africa Power Line Communication Chips for Smart Meters Revenue Share (%), by Country 2024 & 2032
- Figure 26: Asia Pacific Power Line Communication Chips for Smart Meters Revenue (million), by Application 2024 & 2032
- Figure 27: Asia Pacific Power Line Communication Chips for Smart Meters Revenue Share (%), by Application 2024 & 2032
- Figure 28: Asia Pacific Power Line Communication Chips for Smart Meters Revenue (million), by Types 2024 & 2032
- Figure 29: Asia Pacific Power Line Communication Chips for Smart Meters Revenue Share (%), by Types 2024 & 2032
- Figure 30: Asia Pacific Power Line Communication Chips for Smart Meters Revenue (million), by Country 2024 & 2032
- Figure 31: Asia Pacific Power Line Communication Chips for Smart Meters Revenue Share (%), by Country 2024 & 2032
List of Tables
- Table 1: Global Power Line Communication Chips for Smart Meters Revenue million Forecast, by Region 2019 & 2032
- Table 2: Global Power Line Communication Chips for Smart Meters Revenue million Forecast, by Application 2019 & 2032
- Table 3: Global Power Line Communication Chips for Smart Meters Revenue million Forecast, by Types 2019 & 2032
- Table 4: Global Power Line Communication Chips for Smart Meters Revenue million Forecast, by Region 2019 & 2032
- Table 5: Global Power Line Communication Chips for Smart Meters Revenue million Forecast, by Application 2019 & 2032
- Table 6: Global Power Line Communication Chips for Smart Meters Revenue million Forecast, by Types 2019 & 2032
- Table 7: Global Power Line Communication Chips for Smart Meters Revenue million Forecast, by Country 2019 & 2032
- Table 8: United States Power Line Communication Chips for Smart Meters Revenue (million) Forecast, by Application 2019 & 2032
- Table 9: Canada Power Line Communication Chips for Smart Meters Revenue (million) Forecast, by Application 2019 & 2032
- Table 10: Mexico Power Line Communication Chips for Smart Meters Revenue (million) Forecast, by Application 2019 & 2032
- Table 11: Global Power Line Communication Chips for Smart Meters Revenue million Forecast, by Application 2019 & 2032
- Table 12: Global Power Line Communication Chips for Smart Meters Revenue million Forecast, by Types 2019 & 2032
- Table 13: Global Power Line Communication Chips for Smart Meters Revenue million Forecast, by Country 2019 & 2032
- Table 14: Brazil Power Line Communication Chips for Smart Meters Revenue (million) Forecast, by Application 2019 & 2032
- Table 15: Argentina Power Line Communication Chips for Smart Meters Revenue (million) Forecast, by Application 2019 & 2032
- Table 16: Rest of South America Power Line Communication Chips for Smart Meters Revenue (million) Forecast, by Application 2019 & 2032
- Table 17: Global Power Line Communication Chips for Smart Meters Revenue million Forecast, by Application 2019 & 2032
- Table 18: Global Power Line Communication Chips for Smart Meters Revenue million Forecast, by Types 2019 & 2032
- Table 19: Global Power Line Communication Chips for Smart Meters Revenue million Forecast, by Country 2019 & 2032
- Table 20: United Kingdom Power Line Communication Chips for Smart Meters Revenue (million) Forecast, by Application 2019 & 2032
- Table 21: Germany Power Line Communication Chips for Smart Meters Revenue (million) Forecast, by Application 2019 & 2032
- Table 22: France Power Line Communication Chips for Smart Meters Revenue (million) Forecast, by Application 2019 & 2032
- Table 23: Italy Power Line Communication Chips for Smart Meters Revenue (million) Forecast, by Application 2019 & 2032
- Table 24: Spain Power Line Communication Chips for Smart Meters Revenue (million) Forecast, by Application 2019 & 2032
- Table 25: Russia Power Line Communication Chips for Smart Meters Revenue (million) Forecast, by Application 2019 & 2032
- Table 26: Benelux Power Line Communication Chips for Smart Meters Revenue (million) Forecast, by Application 2019 & 2032
- Table 27: Nordics Power Line Communication Chips for Smart Meters Revenue (million) Forecast, by Application 2019 & 2032
- Table 28: Rest of Europe Power Line Communication Chips for Smart Meters Revenue (million) Forecast, by Application 2019 & 2032
- Table 29: Global Power Line Communication Chips for Smart Meters Revenue million Forecast, by Application 2019 & 2032
- Table 30: Global Power Line Communication Chips for Smart Meters Revenue million Forecast, by Types 2019 & 2032
- Table 31: Global Power Line Communication Chips for Smart Meters Revenue million Forecast, by Country 2019 & 2032
- Table 32: Turkey Power Line Communication Chips for Smart Meters Revenue (million) Forecast, by Application 2019 & 2032
- Table 33: Israel Power Line Communication Chips for Smart Meters Revenue (million) Forecast, by Application 2019 & 2032
- Table 34: GCC Power Line Communication Chips for Smart Meters Revenue (million) Forecast, by Application 2019 & 2032
- Table 35: North Africa Power Line Communication Chips for Smart Meters Revenue (million) Forecast, by Application 2019 & 2032
- Table 36: South Africa Power Line Communication Chips for Smart Meters Revenue (million) Forecast, by Application 2019 & 2032
- Table 37: Rest of Middle East & Africa Power Line Communication Chips for Smart Meters Revenue (million) Forecast, by Application 2019 & 2032
- Table 38: Global Power Line Communication Chips for Smart Meters Revenue million Forecast, by Application 2019 & 2032
- Table 39: Global Power Line Communication Chips for Smart Meters Revenue million Forecast, by Types 2019 & 2032
- Table 40: Global Power Line Communication Chips for Smart Meters Revenue million Forecast, by Country 2019 & 2032
- Table 41: China Power Line Communication Chips for Smart Meters Revenue (million) Forecast, by Application 2019 & 2032
- Table 42: India Power Line Communication Chips for Smart Meters Revenue (million) Forecast, by Application 2019 & 2032
- Table 43: Japan Power Line Communication Chips for Smart Meters Revenue (million) Forecast, by Application 2019 & 2032
- Table 44: South Korea Power Line Communication Chips for Smart Meters Revenue (million) Forecast, by Application 2019 & 2032
- Table 45: ASEAN Power Line Communication Chips for Smart Meters Revenue (million) Forecast, by Application 2019 & 2032
- Table 46: Oceania Power Line Communication Chips for Smart Meters Revenue (million) Forecast, by Application 2019 & 2032
- Table 47: Rest of Asia Pacific Power Line Communication Chips for Smart Meters Revenue (million) Forecast, by Application 2019 & 2032
Frequently Asked Questions
1. What is the projected Compound Annual Growth Rate (CAGR) of the Power Line Communication Chips for Smart Meters?
The projected CAGR is approximately XX%.
2. Which companies are prominent players in the Power Line Communication Chips for Smart Meters?
Key companies in the market include Semtech, Renesas Electronics, STMicroelectronics, Qingdao Eastsoft Communication Technology, Hi-Trend Technology, Leaguer (Shenzhen) Microelectronics, Beijing Smartchip Microelectronics Technology, Triductor Technology, Hisilicon.
3. What are the main segments of the Power Line Communication Chips for Smart Meters?
The market segments include Application, Types.
4. Can you provide details about the market size?
The market size is estimated to be USD XXX million as of 2022.
5. What are some drivers contributing to market growth?
N/A
6. What are the notable trends driving market growth?
N/A
7. Are there any restraints impacting market growth?
N/A
8. Can you provide examples of recent developments in the market?
N/A
9. What pricing options are available for accessing the report?
Pricing options include single-user, multi-user, and enterprise licenses priced at USD 2900.00, USD 4350.00, and USD 5800.00 respectively.
10. Is the market size provided in terms of value or volume?
The market size is provided in terms of value, measured in million.
11. Are there any specific market keywords associated with the report?
Yes, the market keyword associated with the report is "Power Line Communication Chips for Smart Meters," which aids in identifying and referencing the specific market segment covered.
12. How do I determine which pricing option suits my needs best?
The pricing options vary based on user requirements and access needs. Individual users may opt for single-user licenses, while businesses requiring broader access may choose multi-user or enterprise licenses for cost-effective access to the report.
13. Are there any additional resources or data provided in the Power Line Communication Chips for Smart Meters report?
While the report offers comprehensive insights, it's advisable to review the specific contents or supplementary materials provided to ascertain if additional resources or data are available.
14. How can I stay updated on further developments or reports in the Power Line Communication Chips for Smart Meters?
To stay informed about further developments, trends, and reports in the Power Line Communication Chips for Smart Meters, consider subscribing to industry newsletters, following relevant companies and organizations, or regularly checking reputable industry news sources and publications.
Methodology
Step 1 - Identification of Relevant Samples Size from Population Database


Step 2 - Approaches for Defining Global Market Size (Value, Volume* & Price*)

Note*: In applicable scenarios
Step 3 - Data Sources
Primary Research
- Web Analytics
- Survey Reports
- Research Institute
- Latest Research Reports
- Opinion Leaders
Secondary Research
- Annual Reports
- White Paper
- Latest Press Release
- Industry Association
- Paid Database
- Investor Presentations

Step 4 - Data Triangulation
Involves using different sources of information in order to increase the validity of a study
These sources are likely to be stakeholders in a program - participants, other researchers, program staff, other community members, and so on.
Then we put all data in single framework & apply various statistical tools to find out the dynamic on the market.
During the analysis stage, feedback from the stakeholder groups would be compared to determine areas of agreement as well as areas of divergence


