

Key Insights
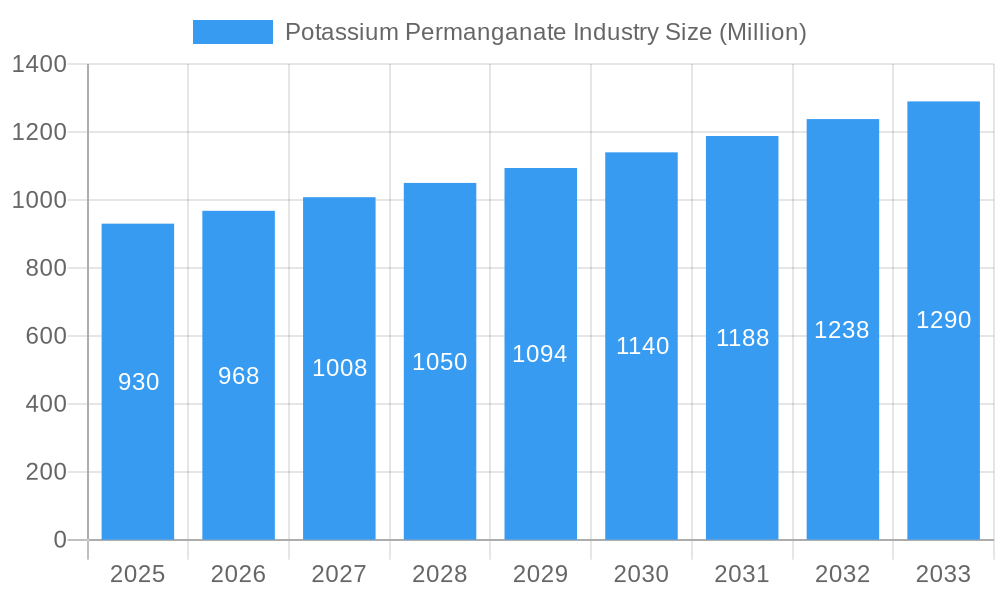
The potassium permanganate market, currently valued at $0.93 billion in 2025, is projected to experience robust growth, driven by its diverse applications across various industries. A compound annual growth rate (CAGR) of 4.11% from 2025 to 2033 indicates a significant expansion, reaching an estimated market size of approximately $1.37 billion by 2033. This growth is fueled by increasing demand in water treatment, where potassium permanganate's strong oxidizing properties are crucial for disinfection and purification. Furthermore, its use as a bleaching agent in textile manufacturing and as a disinfectant in the healthcare sector contributes significantly to market expansion. The rising awareness of waterborne diseases and stricter regulations concerning water quality are key drivers. However, the market faces challenges such as stringent regulations regarding its handling and disposal due to its hazardous nature. This necessitates investments in safer handling technologies and responsible disposal practices, which could influence market growth in the long term. Competitive dynamics within the market are shaped by a blend of established players like Carus Group Inc., Nippon Chemical Industrial CO LTD, and Univar Solutions Inc., and regional manufacturers, each vying for market share based on product quality, pricing strategies, and geographical reach. The market segmentation, while not explicitly detailed, likely includes various grades of potassium permanganate catering to different applications and regional preferences, influencing pricing and demand patterns.
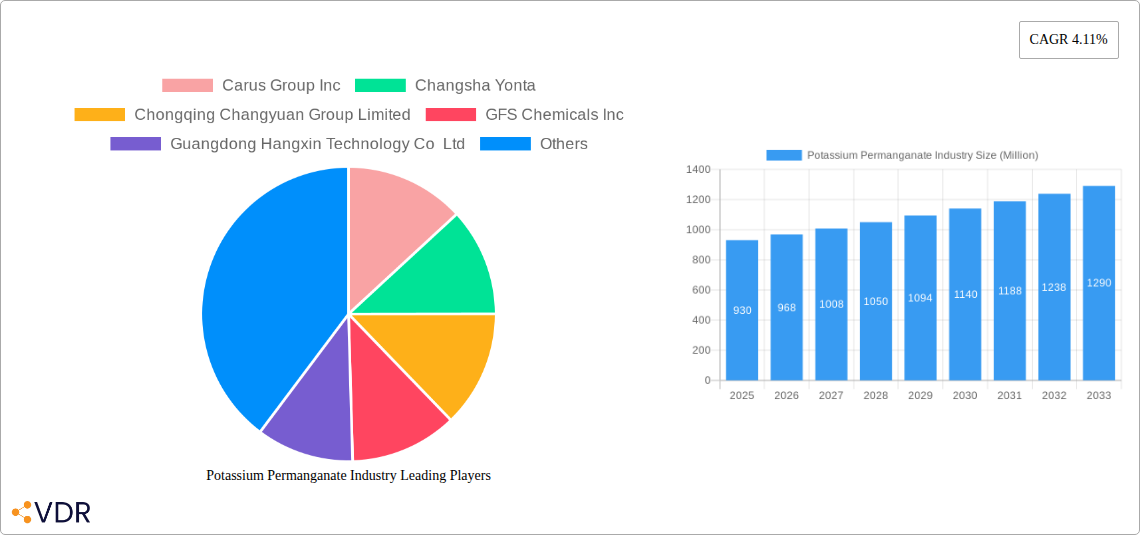
Potassium Permanganate Industry Market Size (In Million)
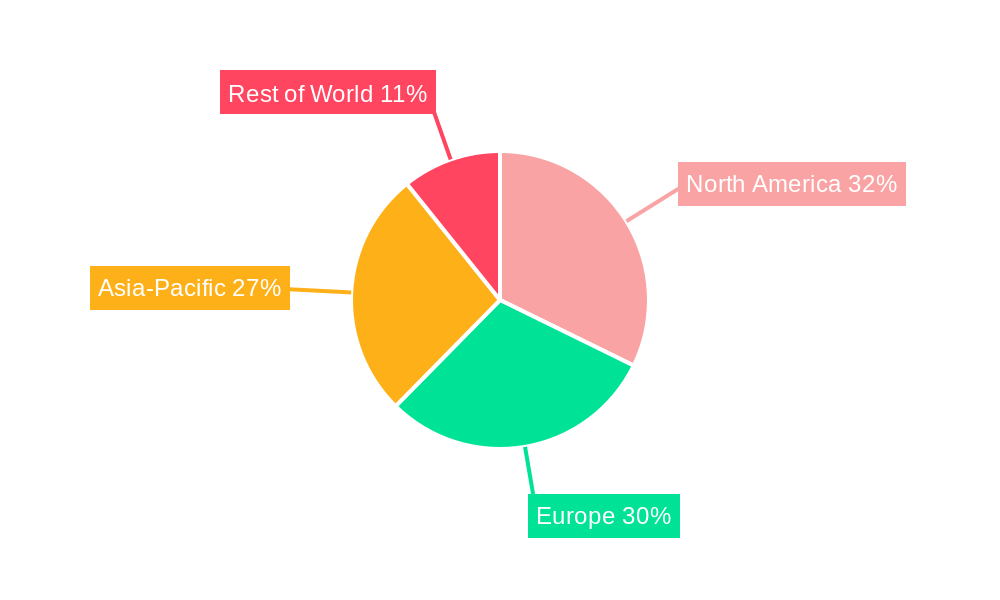
The competitive landscape is expected to intensify as technological advancements lead to more efficient and cost-effective production methods. Furthermore, the development of innovative applications for potassium permanganate, possibly in emerging fields like environmental remediation and advanced oxidation processes, could create further growth opportunities. However, fluctuations in raw material prices, especially manganese ore, could pose challenges to profitability. The geographic distribution of the market is likely skewed towards regions with robust industrial activities and a high concentration of water treatment facilities. While precise regional breakdown is unavailable, it's safe to assume that North America, Europe, and Asia-Pacific would hold a significant portion of the global market share. Future growth will heavily depend on sustainable practices within the industry, regulatory compliance, and continuous innovation to meet evolving customer needs.
Potassium Permanganate Industry Company Market Share
Potassium Permanganate Industry Market Report: 2019-2033
This comprehensive report provides an in-depth analysis of the Potassium Permanganate industry, encompassing market dynamics, growth trends, regional performance, and competitive landscapes. The study covers the period from 2019 to 2033, with 2025 serving as the base and estimated year. The report is crucial for industry professionals, investors, and researchers seeking actionable insights into this dynamic market. Parent markets include the chemical industry and water treatment, while key child markets are water purification, textile manufacturing, and pharmaceutical applications.
Potassium Permanganate Industry Market Dynamics & Structure
This section thoroughly analyzes the competitive landscape of the Potassium Permanganate market, providing a detailed breakdown of market share distribution among key industry participants. We meticulously examine the pivotal role of technological advancements in fostering innovation, the overarching influence of regulatory frameworks on industry practices, and the significant impact of substitute products. Furthermore, the analysis delves into the characteristics of end-user demographics and the prevailing dynamics of mergers and acquisitions (M&A). The market structure is characterized by a strategic blend of large-scale multinational corporations and agile, smaller regional players, each contributing to the market's vibrant ecosystem.
- Market Concentration: The market exhibits a moderately concentrated structure, with a few prominent players commanding a substantial market share, estimated to be around (xx%). This concentration indicates a competitive environment where strategic positioning and operational efficiency are crucial for sustained success.
- Technological Innovation: Key drivers of innovation include significant advancements in production processes, leading to notable cost reductions and substantial improvements in product purity. However, barriers to entry for new technologies remain high due to the significant capital investment requirements for their implementation and scaling.
- Regulatory Framework: Stringent environmental regulations play a critical role in shaping production methods and waste disposal practices. These regulations present both formidable challenges, necessitating compliance and investment in sustainable technologies, and lucrative opportunities for companies that can pioneer and offer innovative, environmentally friendly solutions.
- Competitive Product Substitutes: The market faces competitive pressure from a range of alternative disinfectants and oxidants. The availability and efficacy of these substitutes directly influence market share dynamics and necessitate continuous product development and differentiation for Potassium Permanganate manufacturers.
- End-User Demographics: Robust growth is primarily fueled by sustained demand from a diverse array of critical sectors, including water treatment, textiles, and the pharmaceutical industry. Evolving consumer preferences, particularly a growing inclination towards sustainable and eco-friendly solutions, are significantly shaping market trends and product development strategies.
- M&A Trends: Over the past five years, the frequency of M&A activities has averaged approximately (xx) deals annually. The primary strategic focus of these transactions has been on expanding geographic reach and enhancing existing product portfolios, underscoring a trend towards market consolidation and synergistic growth.
Potassium Permanganate Industry Growth Trends & Insights
This section leverages comprehensive and detailed market data to conduct an in-depth analysis of the market size evolution from 2019 through to 2033. It meticulously explores the adoption rates of Potassium Permanganate across various industry sectors, critically examines the disruptive impact of technological advancements, and rigorously investigates the shifts in consumer behavior that are directly influencing demand patterns.
The Potassium Permanganate market experienced a period of significant and robust growth during the historical period (2019-2024), characterized by a Compound Annual Growth Rate (CAGR) of xx%. This positive growth trajectory is strongly projected to persist throughout the forecast period (2025-2033), primarily propelled by escalating demand from the vital water treatment sector and other key industrial applications. The penetration of Potassium Permanganate into emerging economies represents a substantial and largely untapped growth potential for manufacturers. Furthermore, ongoing technological advancements in both production techniques and novel applications are actively contributing to the market's expansion. Changes in consumer preferences, particularly the growing demand for eco-friendly and sustainable solutions, are also exerting a notable influence on overall market demand. The overall estimated market size for 2025 stands at approximately xx Million, with projections indicating a significant increase to xx Million by the year 2033.
Dominant Regions, Countries, or Segments in Potassium Permanganate Industry
This section meticulously identifies and highlights the leading regions and market segments that are currently the primary drivers of market growth. We conduct a thorough analysis of the key factors contributing to dominance, including current market share proportions and future growth potential within these areas.
- Asia-Pacific Dominance: The Asia-Pacific region currently holds a substantial and commanding market share, estimated at xx%, largely attributable to the exceptionally high demand for water treatment chemicals within its rapidly developing economies.
- Key Growth Drivers: The region's growth is propelled by a confluence of factors including rapid industrialization, escalating urbanization, and the implementation of stringent environmental regulations designed to improve public health and environmental quality. Additionally, favorable government policies and significant investments in infrastructure development are acting as potent catalysts for increased demand.
- North America & Europe: These established regions continue to maintain considerable market shares, accounting for xx% and xx% respectively, and contribute significantly to the overall global market revenue. These mature markets are characterized by stable demand patterns and a pronounced emphasis on sustainability and advanced technological applications.
- Emerging Markets: Significant growth opportunities are identified within Latin America and Africa. These regions are experiencing increased infrastructure development and a rising demand for effective water purification solutions, presenting fertile ground for market expansion.
Potassium Permanganate Industry Product Landscape
The Potassium Permanganate market offers diverse product forms, including granular, powder, and liquid solutions, each tailored to specific applications. Ongoing innovations focus on improving product purity, enhancing solubility, and developing specialized formulations for niche applications. Recent advancements include the development of more efficient and environmentally friendly production processes. Unique selling propositions revolve around purity, efficacy, and sustainable production methods.
Key Drivers, Barriers & Challenges in Potassium Permanganate Industry
Key Drivers: The escalating demand from the critical water treatment sector, the expanding range of industrial applications, and the growing utilization within the pharmaceutical industry are identified as the primary catalysts for market growth. Concurrently, continuous technological advancements in production methodologies are enhancing operational efficiency and contributing to significant cost reductions.
Key Challenges: Significant challenges include the inherent volatility in raw material prices, which can directly impact profit margins. The imposition of stringent environmental regulations necessitates substantial compliance costs for manufacturers. Furthermore, intense competition from substitute products continues to exert pressure on market share. Persistent supply chain disruptions, often exacerbated by geopolitical factors, also pose a considerable threat to market stability and predictable operations.
Emerging Opportunities in Potassium Permanganate Industry
Untapped markets in developing economies represent significant and promising opportunities for expansion and market penetration. Continuous innovations in formulation and application techniques are actively creating new avenues for growth and product diversification. Emerging applications within advanced oxidation processes (AOPs) present particularly substantial potential for future market development. Moreover, the intensifying global focus on sustainable and environmentally responsible solutions is directly driving increased demand for Potassium Permanganate products that are manufactured and utilized in an eco-friendly manner.
Growth Accelerators in the Potassium Permanganate Industry Industry
Technological advancements in production and application methods are crucial growth drivers. Strategic partnerships for market expansion and access to new technologies are accelerating growth. Increasing investment in research and development to cater to specific application needs further supports market expansion.
Key Players Shaping the Potassium Permanganate Industry Market
- Carus Group Inc
- Changsha Yonta
- Chongqing Changyuan Group Limited
- GFS Chemicals Inc
- Guangdong Hangxin Technology Co Ltd
- Libox Chem (India) Pvt Ltd
- Magnesia
- Milport Enterprises Inc
- Nippon Chemical Industrial CO LTD
- Otto Chemie Pvt Ltd
- Univar Solutions Inc
- Universal Chemicals & Industries Pvt Ltd
- List Not Exhaustive
Notable Milestones in Potassium Permanganate Industry Sector
- 2022: Launch of a new, more environmentally friendly Potassium Permanganate production process by [Company Name].
- 2021: Acquisition of [Company A] by [Company B], expanding market reach and product portfolio.
- 2020: Introduction of a new high-purity Potassium Permanganate product line by [Company Name]. (Further milestones will be detailed in the full report)
In-Depth Potassium Permanganate Industry Market Outlook
The Potassium Permanganate market is poised for continued growth driven by increasing demand across diverse sectors. Strategic investments in R&D, partnerships to expand market reach, and focus on sustainable production methods will drive future market potential. Opportunities exist in emerging markets and specialized applications. The market presents significant prospects for established players and new entrants.
Potassium Permanganate Industry Segmentation
-
1. End-user Industry
- 1.1. Pharmaceutical
- 1.2. Water Treatment
- 1.3. Food and Beverage
- 1.4. Agriculture
- 1.5. Other End-user Industries
Potassium Permanganate Industry Segmentation By Geography
-
1. Asia Pacific
- 1.1. China
- 1.2. India
- 1.3. Japan
- 1.4. South Korea
- 1.5. Rest of Asia Pacific
-
2. North America
- 2.1. United States
- 2.2. Canada
- 2.3. Mexico
-
3. Europe
- 3.1. Germany
- 3.2. United Kingdom
- 3.3. France
- 3.4. Italy
- 3.5. Rest of Europe
-
4. South America
- 4.1. Brazil
- 4.2. Argentina
- 4.3. Rest of South America
-
5. Middle East and Africa
- 5.1. Saudi Arabia
- 5.2. South Africa
- 5.3. Rest of Middle East and Africa
Potassium Permanganate Industry Regional Market Share
Geographic Coverage of Potassium Permanganate Industry
Potassium Permanganate Industry REPORT HIGHLIGHTS
| Aspects | Details |
|---|---|
| Study Period | 2020-2034 |
| Base Year | 2025 |
| Estimated Year | 2026 |
| Forecast Period | 2026-2034 |
| Historical Period | 2020-2025 |
| Growth Rate | CAGR of 4.11% from 2020-2034 |
| Segmentation |
|
Table of Contents
- 1. Introduction
- 1.1. Research Scope
- 1.2. Market Segmentation
- 1.3. Research Objective
- 1.4. Definitions and Assumptions
- 2. Executive Summary
- 2.1. Market Snapshot
- 3. Market Dynamics
- 3.1. Market Drivers
- 3.2. Market Restrains
- 3.3. Market Trends
- 3.4. Market Opportunities
- 4. Market Factor Analysis
- 4.1. Porters Five Forces
- 4.1.1. Bargaining Power of Suppliers
- 4.1.2. Bargaining Power of Buyers
- 4.1.3. Threat of New Entrants
- 4.1.4. Threat of Substitutes
- 4.1.5. Competitive Rivalry
- 4.2. PESTEL analysis
- 4.3. BCG Analysis
- 4.3.1. Stars (High Growth, High Market Share)
- 4.3.2. Cash Cows (Low Growth, High Market Share)
- 4.3.3. Question Mark (High Growth, Low Market Share)
- 4.3.4. Dogs (Low Growth, Low Market Share)
- 4.4. Ansoff Matrix Analysis
- 4.5. Supply Chain Analysis
- 4.6. Regulatory Landscape
- 4.7. Current Market Potential and Opportunity Assessment (TAM–SAM–SOM Framework)
- 4.8. VDR Analyst Note
- 4.1. Porters Five Forces
- 5. Market Analysis, Insights and Forecast 2021-2033
- 5.1. Market Analysis, Insights and Forecast - by End-user Industry
- 5.1.1. Pharmaceutical
- 5.1.2. Water Treatment
- 5.1.3. Food and Beverage
- 5.1.4. Agriculture
- 5.1.5. Other End-user Industries
- 5.2. Market Analysis, Insights and Forecast - by Region
- 5.2.1. Asia Pacific
- 5.2.2. North America
- 5.2.3. Europe
- 5.2.4. South America
- 5.2.5. Middle East and Africa
- 5.1. Market Analysis, Insights and Forecast - by End-user Industry
- 6. Global Potassium Permanganate Industry Analysis, Insights and Forecast, 2021-2033
- 6.1. Market Analysis, Insights and Forecast - by End-user Industry
- 6.1.1. Pharmaceutical
- 6.1.2. Water Treatment
- 6.1.3. Food and Beverage
- 6.1.4. Agriculture
- 6.1.5. Other End-user Industries
- 6.1. Market Analysis, Insights and Forecast - by End-user Industry
- 7. Asia Pacific Potassium Permanganate Industry Analysis, Insights and Forecast, 2021-2033
- 7.1. Market Analysis, Insights and Forecast - by End-user Industry
- 7.1.1. Pharmaceutical
- 7.1.2. Water Treatment
- 7.1.3. Food and Beverage
- 7.1.4. Agriculture
- 7.1.5. Other End-user Industries
- 7.1. Market Analysis, Insights and Forecast - by End-user Industry
- 8. North America Potassium Permanganate Industry Analysis, Insights and Forecast, 2021-2033
- 8.1. Market Analysis, Insights and Forecast - by End-user Industry
- 8.1.1. Pharmaceutical
- 8.1.2. Water Treatment
- 8.1.3. Food and Beverage
- 8.1.4. Agriculture
- 8.1.5. Other End-user Industries
- 8.1. Market Analysis, Insights and Forecast - by End-user Industry
- 9. Europe Potassium Permanganate Industry Analysis, Insights and Forecast, 2021-2033
- 9.1. Market Analysis, Insights and Forecast - by End-user Industry
- 9.1.1. Pharmaceutical
- 9.1.2. Water Treatment
- 9.1.3. Food and Beverage
- 9.1.4. Agriculture
- 9.1.5. Other End-user Industries
- 9.1. Market Analysis, Insights and Forecast - by End-user Industry
- 10. South America Potassium Permanganate Industry Analysis, Insights and Forecast, 2021-2033
- 10.1. Market Analysis, Insights and Forecast - by End-user Industry
- 10.1.1. Pharmaceutical
- 10.1.2. Water Treatment
- 10.1.3. Food and Beverage
- 10.1.4. Agriculture
- 10.1.5. Other End-user Industries
- 10.1. Market Analysis, Insights and Forecast - by End-user Industry
- 11. Middle East and Africa Potassium Permanganate Industry Analysis, Insights and Forecast, 2021-2033
- 11.1. Market Analysis, Insights and Forecast - by End-user Industry
- 11.1.1. Pharmaceutical
- 11.1.2. Water Treatment
- 11.1.3. Food and Beverage
- 11.1.4. Agriculture
- 11.1.5. Other End-user Industries
- 11.1. Market Analysis, Insights and Forecast - by End-user Industry
- 12. Competitive Analysis
- 12.1. Company Profiles
- 12.1.1 Carus Group Inc
- 12.1.1.1. Company Overview
- 12.1.1.2. Products
- 12.1.1.3. Company Financials
- 12.1.1.4. SWOT Analysis
- 12.1.2 Changsha Yonta
- 12.1.2.1. Company Overview
- 12.1.2.2. Products
- 12.1.2.3. Company Financials
- 12.1.2.4. SWOT Analysis
- 12.1.3 Chongqing Changyuan Group Limited
- 12.1.3.1. Company Overview
- 12.1.3.2. Products
- 12.1.3.3. Company Financials
- 12.1.3.4. SWOT Analysis
- 12.1.4 GFS Chemicals Inc
- 12.1.4.1. Company Overview
- 12.1.4.2. Products
- 12.1.4.3. Company Financials
- 12.1.4.4. SWOT Analysis
- 12.1.5 Guangdong Hangxin Technology Co Ltd
- 12.1.5.1. Company Overview
- 12.1.5.2. Products
- 12.1.5.3. Company Financials
- 12.1.5.4. SWOT Analysis
- 12.1.6 Libox Chem (India) Pvt Ltd
- 12.1.6.1. Company Overview
- 12.1.6.2. Products
- 12.1.6.3. Company Financials
- 12.1.6.4. SWOT Analysis
- 12.1.7 Magnesia
- 12.1.7.1. Company Overview
- 12.1.7.2. Products
- 12.1.7.3. Company Financials
- 12.1.7.4. SWOT Analysis
- 12.1.8 Milport Enterprises Inc
- 12.1.8.1. Company Overview
- 12.1.8.2. Products
- 12.1.8.3. Company Financials
- 12.1.8.4. SWOT Analysis
- 12.1.9 Nippon Chemical Industrial CO LTD
- 12.1.9.1. Company Overview
- 12.1.9.2. Products
- 12.1.9.3. Company Financials
- 12.1.9.4. SWOT Analysis
- 12.1.10 Otto Chemie Pvt Ltd
- 12.1.10.1. Company Overview
- 12.1.10.2. Products
- 12.1.10.3. Company Financials
- 12.1.10.4. SWOT Analysis
- 12.1.11 Univar Solutions Inc
- 12.1.11.1. Company Overview
- 12.1.11.2. Products
- 12.1.11.3. Company Financials
- 12.1.11.4. SWOT Analysis
- 12.1.12 Universal Chemicals & Industries Pvt Ltd *List Not Exhaustive
- 12.1.12.1. Company Overview
- 12.1.12.2. Products
- 12.1.12.3. Company Financials
- 12.1.12.4. SWOT Analysis
- 12.1.1 Carus Group Inc
- 12.2. Market Entropy
- 12.2.1 Company's Key Areas Served
- 12.2.2 Recent Developments
- 12.3. Company Market Share Analysis 2025
- 12.3.1 Top 5 Companies Market Share Analysis
- 12.3.2 Top 3 Companies Market Share Analysis
- 12.4. List of Potential Customers
- 13. Research Methodology
List of Figures
- Figure 1: Global Potassium Permanganate Industry Revenue Breakdown (Million, %) by Region 2025 & 2033
- Figure 2: Global Potassium Permanganate Industry Volume Breakdown (Billion, %) by Region 2025 & 2033
- Figure 3: Asia Pacific Potassium Permanganate Industry Revenue (Million), by End-user Industry 2025 & 2033
- Figure 4: Asia Pacific Potassium Permanganate Industry Volume (Billion), by End-user Industry 2025 & 2033
- Figure 5: Asia Pacific Potassium Permanganate Industry Revenue Share (%), by End-user Industry 2025 & 2033
- Figure 6: Asia Pacific Potassium Permanganate Industry Volume Share (%), by End-user Industry 2025 & 2033
- Figure 7: Asia Pacific Potassium Permanganate Industry Revenue (Million), by Country 2025 & 2033
- Figure 8: Asia Pacific Potassium Permanganate Industry Volume (Billion), by Country 2025 & 2033
- Figure 9: Asia Pacific Potassium Permanganate Industry Revenue Share (%), by Country 2025 & 2033
- Figure 10: Asia Pacific Potassium Permanganate Industry Volume Share (%), by Country 2025 & 2033
- Figure 11: North America Potassium Permanganate Industry Revenue (Million), by End-user Industry 2025 & 2033
- Figure 12: North America Potassium Permanganate Industry Volume (Billion), by End-user Industry 2025 & 2033
- Figure 13: North America Potassium Permanganate Industry Revenue Share (%), by End-user Industry 2025 & 2033
- Figure 14: North America Potassium Permanganate Industry Volume Share (%), by End-user Industry 2025 & 2033
- Figure 15: North America Potassium Permanganate Industry Revenue (Million), by Country 2025 & 2033
- Figure 16: North America Potassium Permanganate Industry Volume (Billion), by Country 2025 & 2033
- Figure 17: North America Potassium Permanganate Industry Revenue Share (%), by Country 2025 & 2033
- Figure 18: North America Potassium Permanganate Industry Volume Share (%), by Country 2025 & 2033
- Figure 19: Europe Potassium Permanganate Industry Revenue (Million), by End-user Industry 2025 & 2033
- Figure 20: Europe Potassium Permanganate Industry Volume (Billion), by End-user Industry 2025 & 2033
- Figure 21: Europe Potassium Permanganate Industry Revenue Share (%), by End-user Industry 2025 & 2033
- Figure 22: Europe Potassium Permanganate Industry Volume Share (%), by End-user Industry 2025 & 2033
- Figure 23: Europe Potassium Permanganate Industry Revenue (Million), by Country 2025 & 2033
- Figure 24: Europe Potassium Permanganate Industry Volume (Billion), by Country 2025 & 2033
- Figure 25: Europe Potassium Permanganate Industry Revenue Share (%), by Country 2025 & 2033
- Figure 26: Europe Potassium Permanganate Industry Volume Share (%), by Country 2025 & 2033
- Figure 27: South America Potassium Permanganate Industry Revenue (Million), by End-user Industry 2025 & 2033
- Figure 28: South America Potassium Permanganate Industry Volume (Billion), by End-user Industry 2025 & 2033
- Figure 29: South America Potassium Permanganate Industry Revenue Share (%), by End-user Industry 2025 & 2033
- Figure 30: South America Potassium Permanganate Industry Volume Share (%), by End-user Industry 2025 & 2033
- Figure 31: South America Potassium Permanganate Industry Revenue (Million), by Country 2025 & 2033
- Figure 32: South America Potassium Permanganate Industry Volume (Billion), by Country 2025 & 2033
- Figure 33: South America Potassium Permanganate Industry Revenue Share (%), by Country 2025 & 2033
- Figure 34: South America Potassium Permanganate Industry Volume Share (%), by Country 2025 & 2033
- Figure 35: Middle East and Africa Potassium Permanganate Industry Revenue (Million), by End-user Industry 2025 & 2033
- Figure 36: Middle East and Africa Potassium Permanganate Industry Volume (Billion), by End-user Industry 2025 & 2033
- Figure 37: Middle East and Africa Potassium Permanganate Industry Revenue Share (%), by End-user Industry 2025 & 2033
- Figure 38: Middle East and Africa Potassium Permanganate Industry Volume Share (%), by End-user Industry 2025 & 2033
- Figure 39: Middle East and Africa Potassium Permanganate Industry Revenue (Million), by Country 2025 & 2033
- Figure 40: Middle East and Africa Potassium Permanganate Industry Volume (Billion), by Country 2025 & 2033
- Figure 41: Middle East and Africa Potassium Permanganate Industry Revenue Share (%), by Country 2025 & 2033
- Figure 42: Middle East and Africa Potassium Permanganate Industry Volume Share (%), by Country 2025 & 2033
List of Tables
- Table 1: Global Potassium Permanganate Industry Revenue Million Forecast, by End-user Industry 2020 & 2033
- Table 2: Global Potassium Permanganate Industry Volume Billion Forecast, by End-user Industry 2020 & 2033
- Table 3: Global Potassium Permanganate Industry Revenue Million Forecast, by Region 2020 & 2033
- Table 4: Global Potassium Permanganate Industry Volume Billion Forecast, by Region 2020 & 2033
- Table 5: Global Potassium Permanganate Industry Revenue Million Forecast, by End-user Industry 2020 & 2033
- Table 6: Global Potassium Permanganate Industry Volume Billion Forecast, by End-user Industry 2020 & 2033
- Table 7: Global Potassium Permanganate Industry Revenue Million Forecast, by Country 2020 & 2033
- Table 8: Global Potassium Permanganate Industry Volume Billion Forecast, by Country 2020 & 2033
- Table 9: China Potassium Permanganate Industry Revenue (Million) Forecast, by Application 2020 & 2033
- Table 10: China Potassium Permanganate Industry Volume (Billion) Forecast, by Application 2020 & 2033
- Table 11: India Potassium Permanganate Industry Revenue (Million) Forecast, by Application 2020 & 2033
- Table 12: India Potassium Permanganate Industry Volume (Billion) Forecast, by Application 2020 & 2033
- Table 13: Japan Potassium Permanganate Industry Revenue (Million) Forecast, by Application 2020 & 2033
- Table 14: Japan Potassium Permanganate Industry Volume (Billion) Forecast, by Application 2020 & 2033
- Table 15: South Korea Potassium Permanganate Industry Revenue (Million) Forecast, by Application 2020 & 2033
- Table 16: South Korea Potassium Permanganate Industry Volume (Billion) Forecast, by Application 2020 & 2033
- Table 17: Rest of Asia Pacific Potassium Permanganate Industry Revenue (Million) Forecast, by Application 2020 & 2033
- Table 18: Rest of Asia Pacific Potassium Permanganate Industry Volume (Billion) Forecast, by Application 2020 & 2033
- Table 19: Global Potassium Permanganate Industry Revenue Million Forecast, by End-user Industry 2020 & 2033
- Table 20: Global Potassium Permanganate Industry Volume Billion Forecast, by End-user Industry 2020 & 2033
- Table 21: Global Potassium Permanganate Industry Revenue Million Forecast, by Country 2020 & 2033
- Table 22: Global Potassium Permanganate Industry Volume Billion Forecast, by Country 2020 & 2033
- Table 23: United States Potassium Permanganate Industry Revenue (Million) Forecast, by Application 2020 & 2033
- Table 24: United States Potassium Permanganate Industry Volume (Billion) Forecast, by Application 2020 & 2033
- Table 25: Canada Potassium Permanganate Industry Revenue (Million) Forecast, by Application 2020 & 2033
- Table 26: Canada Potassium Permanganate Industry Volume (Billion) Forecast, by Application 2020 & 2033
- Table 27: Mexico Potassium Permanganate Industry Revenue (Million) Forecast, by Application 2020 & 2033
- Table 28: Mexico Potassium Permanganate Industry Volume (Billion) Forecast, by Application 2020 & 2033
- Table 29: Global Potassium Permanganate Industry Revenue Million Forecast, by End-user Industry 2020 & 2033
- Table 30: Global Potassium Permanganate Industry Volume Billion Forecast, by End-user Industry 2020 & 2033
- Table 31: Global Potassium Permanganate Industry Revenue Million Forecast, by Country 2020 & 2033
- Table 32: Global Potassium Permanganate Industry Volume Billion Forecast, by Country 2020 & 2033
- Table 33: Germany Potassium Permanganate Industry Revenue (Million) Forecast, by Application 2020 & 2033
- Table 34: Germany Potassium Permanganate Industry Volume (Billion) Forecast, by Application 2020 & 2033
- Table 35: United Kingdom Potassium Permanganate Industry Revenue (Million) Forecast, by Application 2020 & 2033
- Table 36: United Kingdom Potassium Permanganate Industry Volume (Billion) Forecast, by Application 2020 & 2033
- Table 37: France Potassium Permanganate Industry Revenue (Million) Forecast, by Application 2020 & 2033
- Table 38: France Potassium Permanganate Industry Volume (Billion) Forecast, by Application 2020 & 2033
- Table 39: Italy Potassium Permanganate Industry Revenue (Million) Forecast, by Application 2020 & 2033
- Table 40: Italy Potassium Permanganate Industry Volume (Billion) Forecast, by Application 2020 & 2033
- Table 41: Rest of Europe Potassium Permanganate Industry Revenue (Million) Forecast, by Application 2020 & 2033
- Table 42: Rest of Europe Potassium Permanganate Industry Volume (Billion) Forecast, by Application 2020 & 2033
- Table 43: Global Potassium Permanganate Industry Revenue Million Forecast, by End-user Industry 2020 & 2033
- Table 44: Global Potassium Permanganate Industry Volume Billion Forecast, by End-user Industry 2020 & 2033
- Table 45: Global Potassium Permanganate Industry Revenue Million Forecast, by Country 2020 & 2033
- Table 46: Global Potassium Permanganate Industry Volume Billion Forecast, by Country 2020 & 2033
- Table 47: Brazil Potassium Permanganate Industry Revenue (Million) Forecast, by Application 2020 & 2033
- Table 48: Brazil Potassium Permanganate Industry Volume (Billion) Forecast, by Application 2020 & 2033
- Table 49: Argentina Potassium Permanganate Industry Revenue (Million) Forecast, by Application 2020 & 2033
- Table 50: Argentina Potassium Permanganate Industry Volume (Billion) Forecast, by Application 2020 & 2033
- Table 51: Rest of South America Potassium Permanganate Industry Revenue (Million) Forecast, by Application 2020 & 2033
- Table 52: Rest of South America Potassium Permanganate Industry Volume (Billion) Forecast, by Application 2020 & 2033
- Table 53: Global Potassium Permanganate Industry Revenue Million Forecast, by End-user Industry 2020 & 2033
- Table 54: Global Potassium Permanganate Industry Volume Billion Forecast, by End-user Industry 2020 & 2033
- Table 55: Global Potassium Permanganate Industry Revenue Million Forecast, by Country 2020 & 2033
- Table 56: Global Potassium Permanganate Industry Volume Billion Forecast, by Country 2020 & 2033
- Table 57: Saudi Arabia Potassium Permanganate Industry Revenue (Million) Forecast, by Application 2020 & 2033
- Table 58: Saudi Arabia Potassium Permanganate Industry Volume (Billion) Forecast, by Application 2020 & 2033
- Table 59: South Africa Potassium Permanganate Industry Revenue (Million) Forecast, by Application 2020 & 2033
- Table 60: South Africa Potassium Permanganate Industry Volume (Billion) Forecast, by Application 2020 & 2033
- Table 61: Rest of Middle East and Africa Potassium Permanganate Industry Revenue (Million) Forecast, by Application 2020 & 2033
- Table 62: Rest of Middle East and Africa Potassium Permanganate Industry Volume (Billion) Forecast, by Application 2020 & 2033
Frequently Asked Questions
1. What is the projected Compound Annual Growth Rate (CAGR) of the Potassium Permanganate Industry?
The projected CAGR is approximately 4.11%.
2. Which companies are prominent players in the Potassium Permanganate Industry?
Key companies in the market include Carus Group Inc, Changsha Yonta, Chongqing Changyuan Group Limited, GFS Chemicals Inc, Guangdong Hangxin Technology Co Ltd, Libox Chem (India) Pvt Ltd, Magnesia, Milport Enterprises Inc, Nippon Chemical Industrial CO LTD, Otto Chemie Pvt Ltd, Univar Solutions Inc, Universal Chemicals & Industries Pvt Ltd *List Not Exhaustive.
3. What are the main segments of the Potassium Permanganate Industry?
The market segments include End-user Industry.
4. Can you provide details about the market size?
The market size is estimated to be USD 0.93 Million as of 2022.
5. What are some drivers contributing to market growth?
Growing Need for High-Quality Water Treatment; Increasing Usage in the Pharmaceutical Industry; Other Drivers.
6. What are the notable trends driving market growth?
Growing Demand from Pharmaceutical Industry.
7. Are there any restraints impacting market growth?
Growing Need for High-Quality Water Treatment; Increasing Usage in the Pharmaceutical Industry; Other Drivers.
8. Can you provide examples of recent developments in the market?
Recent developments in the market studied will be covered in the complete report.
9. What pricing options are available for accessing the report?
Pricing options include single-user, multi-user, and enterprise licenses priced at USD 4750, USD 5250, and USD 8750 respectively.
10. Is the market size provided in terms of value or volume?
The market size is provided in terms of value, measured in Million and volume, measured in Billion.
11. Are there any specific market keywords associated with the report?
Yes, the market keyword associated with the report is "Potassium Permanganate Industry," which aids in identifying and referencing the specific market segment covered.
12. How do I determine which pricing option suits my needs best?
The pricing options vary based on user requirements and access needs. Individual users may opt for single-user licenses, while businesses requiring broader access may choose multi-user or enterprise licenses for cost-effective access to the report.
13. Are there any additional resources or data provided in the Potassium Permanganate Industry report?
While the report offers comprehensive insights, it's advisable to review the specific contents or supplementary materials provided to ascertain if additional resources or data are available.
14. How can I stay updated on further developments or reports in the Potassium Permanganate Industry?
To stay informed about further developments, trends, and reports in the Potassium Permanganate Industry, consider subscribing to industry newsletters, following relevant companies and organizations, or regularly checking reputable industry news sources and publications.
Methodology
Step 1 - Identification of Relevant Samples Size from Population Database


Step 2 - Approaches for Defining Global Market Size (Value, Volume* & Price*)

Note*: In applicable scenarios
Step 3 - Data Sources
Primary Research
- Web Analytics
- Survey Reports
- Research Institute
- Latest Research Reports
- Opinion Leaders
Secondary Research
- Annual Reports
- White Paper
- Latest Press Release
- Industry Association
- Paid Database
- Investor Presentations

Step 4 - Data Triangulation
Involves using different sources of information in order to increase the validity of a study
These sources are likely to be stakeholders in a program - participants, other researchers, program staff, other community members, and so on.
Then we put all data in single framework & apply various statistical tools to find out the dynamic on the market.
During the analysis stage, feedback from the stakeholder groups would be compared to determine areas of agreement as well as areas of divergence