
Key Insights
The portable tent market, encompassing lightweight backpacking tents, ultralight shelters, and compact camping tents, is experiencing robust growth, driven by the surging popularity of outdoor activities like backpacking, hiking, and camping. The market's expansion is fueled by several key factors. Firstly, increased disposable incomes and a growing interest in adventure travel and nature-based tourism are propelling demand for high-quality, portable camping equipment. Secondly, advancements in tent design and materials, leading to lighter, more durable, and weather-resistant options, are attracting a wider range of consumers. The rise of minimalist backpacking and ultralight hiking trends further enhances the market appeal. Technological innovations like improved ventilation systems, self-supporting designs, and innovative waterproofing technologies contribute significantly to the premiumization of the portable tent segment. Established players like The North Face and newer specialized brands like Zpacks are capitalizing on these trends, leading to increased product diversity and price points catering to various budget levels.
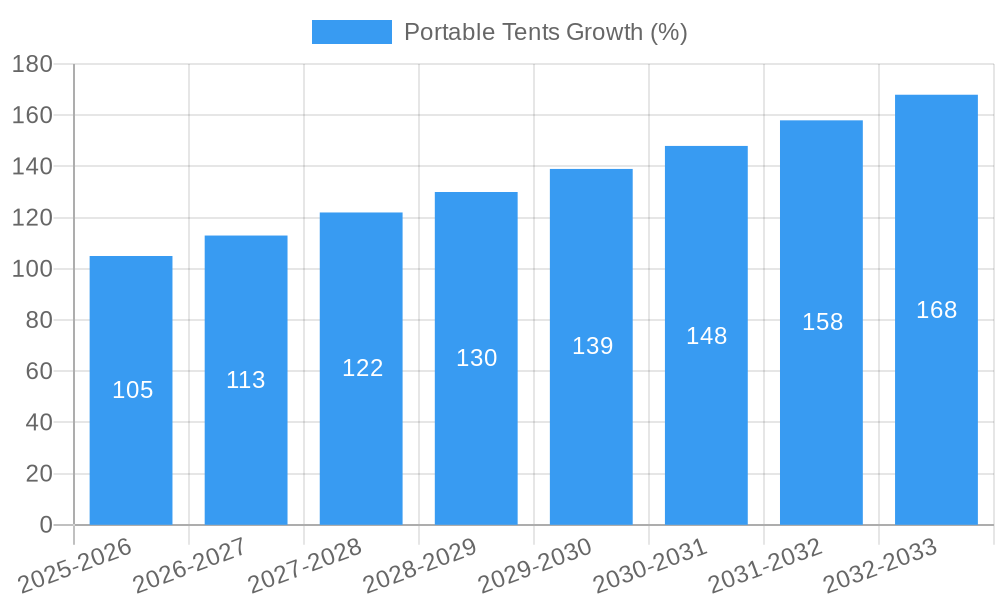
However, certain challenges persist. Fluctuating raw material prices, particularly for high-performance fabrics, can impact production costs and profitability. Environmental concerns related to the manufacturing and disposal of tents also play a role. Furthermore, competition from established players and emerging brands necessitates continuous innovation and marketing efforts to maintain market share. While the market exhibits significant growth potential across diverse geographic regions, factors like seasonal demand patterns and the impact of weather events need consideration in forecasting accurate market performance. A conservative estimate suggests a market size of approximately $1.5 billion in 2025, with a compound annual growth rate (CAGR) of 7% projected through 2033, leading to a market size exceeding $2.8 billion by the end of the forecast period. This growth is predicated on the continuing rise in outdoor recreation participation and the sustained development of innovative tent technologies.
Portable Tents Market Report: 2019-2033
This comprehensive report provides an in-depth analysis of the portable tents market, encompassing market dynamics, growth trends, regional dominance, product landscape, key players, and future outlook. The study period spans from 2019 to 2033, with 2025 serving as both the base and estimated year. The forecast period covers 2025-2033, and the historical period encompasses 2019-2024. This report is crucial for industry professionals, investors, and businesses seeking to understand and capitalize on opportunities within this dynamic market segment. The market is segmented by type (e.g., backpacking tents, dome tents, camping tents), material (e.g., nylon, polyester), and end-user (e.g., outdoor enthusiasts, campers, professionals). The parent market is the broader outdoor recreation equipment market, while the child market includes niche segments like ultralight backpacking gear. The report projects a market size of xx million units by 2033.
Portable Tents Market Dynamics & Structure
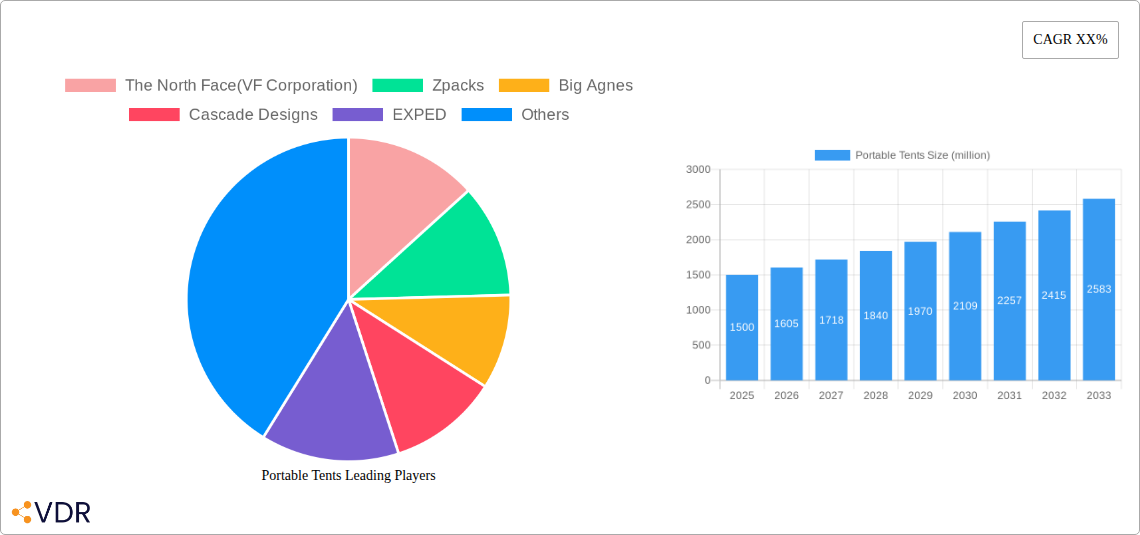
The portable tents market is characterized by moderate concentration, with several key players commanding significant market share. The North Face (VF Corporation), Big Agnes, and Hilleberg, for example, hold a combined xx% market share in 2025 (estimated). Technological innovation, driven by advancements in materials (lighter, stronger fabrics) and designs (improved ventilation and waterproofing), is a major driver. Regulatory frameworks concerning product safety and environmental impact also play a role. Competitive substitutes include shelters and tarps, which pose a challenge to higher-priced tent models. The end-user demographic is expanding, encompassing a wider range of outdoor enthusiasts and professionals, leading to increased demand. Mergers and acquisitions (M&A) activity has been moderate in recent years, with an estimated xx M&A deals in the historical period, largely focused on consolidation and expansion into new markets.
- Market Concentration: Moderately concentrated, with top 5 players holding xx% market share (2025 est.).
- Innovation Drivers: Lightweight materials, improved ventilation, advanced waterproofing technologies.
- Regulatory Frameworks: Safety standards, environmental regulations impacting material choices.
- Competitive Substitutes: Tarps, bivy sacks, lightweight shelters.
- End-User Demographics: Expanding to include a broader range of ages and activity levels.
- M&A Trends: Moderate activity, focused on consolidation and market expansion (xx deals 2019-2024).
Portable Tents Growth Trends & Insights
The portable tents market has experienced steady growth during the historical period (2019-2024), with a CAGR of xx%. This growth is attributed to several factors, including increased participation in outdoor activities like camping, hiking, and backpacking. Technological disruptions, such as the introduction of ultralight tents and improved tent designs, have also driven adoption rates. Consumer behavior shifts toward experiences over material possessions have further fueled market expansion. We project continued growth in the forecast period (2025-2033), with a CAGR of xx%, driven by increasing disposable income in developing economies and growing interest in outdoor recreation. Market penetration is expected to rise from xx% in 2025 to xx% by 2033.
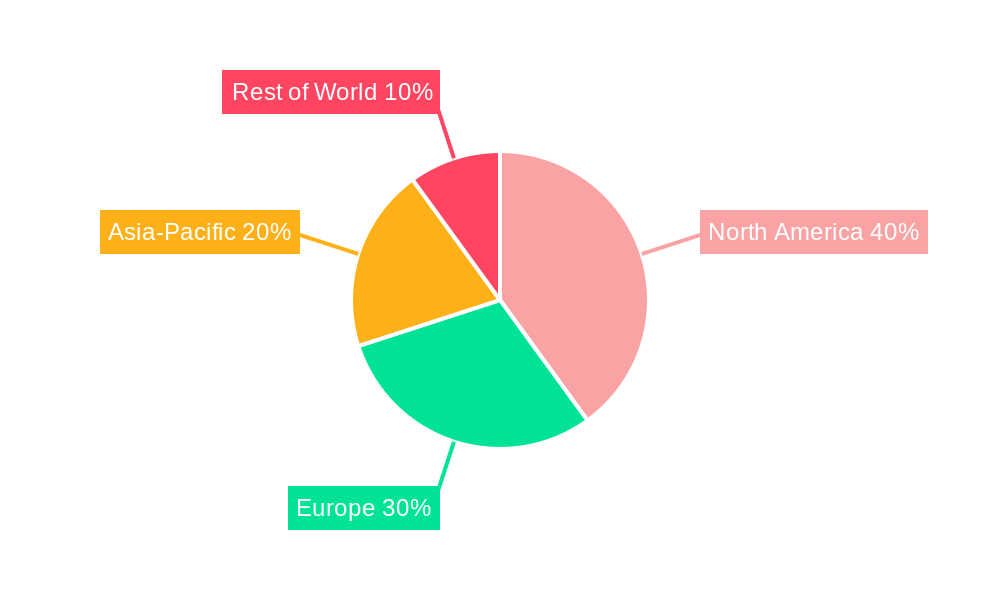
Dominant Regions, Countries, or Segments in Portable Tents
North America currently dominates the portable tents market, accounting for xx% of global sales in 2025 (estimated), driven by high participation rates in outdoor activities and strong consumer spending. Europe follows closely, holding xx% market share. The strong presence of established outdoor brands and a well-developed distribution network contribute to this dominance. Growth is anticipated in Asia-Pacific, fueled by rising disposable incomes and increasing popularity of outdoor recreation.
- North America: High participation in outdoor activities, strong consumer spending, established brands.
- Europe: Developed outdoor recreation market, strong consumer preference for high-quality products.
- Asia-Pacific: Rapidly growing disposable incomes, increasing interest in outdoor recreation.
Portable Tents Product Landscape
The portable tent market offers a diverse range of products, categorized by size, weight, features, and material. Innovations focus on lightweight, durable materials, improved ventilation systems, and enhanced ease of setup. Key features include waterproof fabrics, integrated rainflies, and adjustable poles for customization. Unique selling propositions often revolve around superior weather protection, minimalist designs for backpacking, and ease of use. Technological advancements such as self-inflating air mattresses, integrated lighting, and improved waterproofing technologies are continuously shaping the product landscape.
Key Drivers, Barriers & Challenges in Portable Tents
Key Drivers:
- Rising disposable incomes globally fueling demand for leisure activities.
- Increased popularity of outdoor recreation, particularly among younger demographics.
- Technological advancements resulting in lighter, more durable, and easier-to-use tents.
Key Challenges & Restraints:
- Fluctuations in raw material prices impacting production costs.
- Intense competition from numerous brands impacting pricing strategies.
- Environmental concerns about the impact of production and disposal of tents.
Emerging Opportunities in Portable Tents
- Growing demand for eco-friendly and sustainable tents made from recycled materials.
- Expansion into niche markets like glamping and luxury camping.
- Development of smart tents incorporating technology for enhanced comfort and safety.
Growth Accelerators in the Portable Tents Industry
Strategic partnerships between tent manufacturers and outdoor apparel brands are fostering synergistic growth. Technological breakthroughs in materials science, resulting in lighter and stronger fabrics, are expanding the market for ultralight backpacking tents. Expansion into emerging markets, particularly in Asia and South America, offers substantial growth potential.
Key Players Shaping the Portable Tents Market
- The North Face (VF Corporation)
- Zpacks
- Big Agnes
- Cascade Designs
- EXPED
- Gossamer Gear
- Hilleberg
- Kelty
- Marmot Mountain
- Mountain Laurel Designs
- NEMO Equipment
- Recreational Equipment
- Sea to Summit
- Six Moon Designs
- SlingFin
- Tarptent
Notable Milestones in Portable Tents Sector
- 2020: Introduction of several ultralight tent models by key players.
- 2022: Significant increase in demand driven by post-pandemic outdoor recreation surge.
- 2023: Several companies launch sustainability initiatives focused on recycled materials.
In-Depth Portable Tents Market Outlook
The portable tents market is poised for continued growth over the forecast period (2025-2033). This growth will be propelled by sustained interest in outdoor recreation, technological advancements, and expansion into new geographic markets. Strategic opportunities exist for companies focused on sustainable products, innovative designs, and effective marketing to reach a broader range of consumers. The market is expected to witness further consolidation and increased competition as new entrants and innovative products emerge.
Portable Tents Segmentation
-
1. Application
- 1.1. Supermarkets(Offline)
- 1.2. Exclusive Stores(Offline)
- 1.3. Online
-
2. Types
- 2.1. 1P
- 2.2. 2P
- 2.3. 3P
- 2.4. 4P
Portable Tents Segmentation By Geography
-
1. North America
- 1.1. United States
- 1.2. Canada
- 1.3. Mexico
-
2. South America
- 2.1. Brazil
- 2.2. Argentina
- 2.3. Rest of South America
-
3. Europe
- 3.1. United Kingdom
- 3.2. Germany
- 3.3. France
- 3.4. Italy
- 3.5. Spain
- 3.6. Russia
- 3.7. Benelux
- 3.8. Nordics
- 3.9. Rest of Europe
-
4. Middle East & Africa
- 4.1. Turkey
- 4.2. Israel
- 4.3. GCC
- 4.4. North Africa
- 4.5. South Africa
- 4.6. Rest of Middle East & Africa
-
5. Asia Pacific
- 5.1. China
- 5.2. India
- 5.3. Japan
- 5.4. South Korea
- 5.5. ASEAN
- 5.6. Oceania
- 5.7. Rest of Asia Pacific
Portable Tents REPORT HIGHLIGHTS
| Aspects | Details |
|---|---|
| Study Period | 2019-2033 |
| Base Year | 2024 |
| Estimated Year | 2025 |
| Forecast Period | 2025-2033 |
| Historical Period | 2019-2024 |
| Growth Rate | CAGR of XX% from 2019-2033 |
| Segmentation |
|
Table of Contents
- 1. Introduction
- 1.1. Research Scope
- 1.2. Market Segmentation
- 1.3. Research Methodology
- 1.4. Definitions and Assumptions
- 2. Executive Summary
- 2.1. Introduction
- 3. Market Dynamics
- 3.1. Introduction
- 3.2. Market Drivers
- 3.3. Market Restrains
- 3.4. Market Trends
- 4. Market Factor Analysis
- 4.1. Porters Five Forces
- 4.2. Supply/Value Chain
- 4.3. PESTEL analysis
- 4.4. Market Entropy
- 4.5. Patent/Trademark Analysis
- 5. Global Portable Tents Analysis, Insights and Forecast, 2019-2031
- 5.1. Market Analysis, Insights and Forecast - by Application
- 5.1.1. Supermarkets(Offline)
- 5.1.2. Exclusive Stores(Offline)
- 5.1.3. Online
- 5.2. Market Analysis, Insights and Forecast - by Types
- 5.2.1. 1P
- 5.2.2. 2P
- 5.2.3. 3P
- 5.2.4. 4P
- 5.3. Market Analysis, Insights and Forecast - by Region
- 5.3.1. North America
- 5.3.2. South America
- 5.3.3. Europe
- 5.3.4. Middle East & Africa
- 5.3.5. Asia Pacific
- 5.1. Market Analysis, Insights and Forecast - by Application
- 6. North America Portable Tents Analysis, Insights and Forecast, 2019-2031
- 6.1. Market Analysis, Insights and Forecast - by Application
- 6.1.1. Supermarkets(Offline)
- 6.1.2. Exclusive Stores(Offline)
- 6.1.3. Online
- 6.2. Market Analysis, Insights and Forecast - by Types
- 6.2.1. 1P
- 6.2.2. 2P
- 6.2.3. 3P
- 6.2.4. 4P
- 6.1. Market Analysis, Insights and Forecast - by Application
- 7. South America Portable Tents Analysis, Insights and Forecast, 2019-2031
- 7.1. Market Analysis, Insights and Forecast - by Application
- 7.1.1. Supermarkets(Offline)
- 7.1.2. Exclusive Stores(Offline)
- 7.1.3. Online
- 7.2. Market Analysis, Insights and Forecast - by Types
- 7.2.1. 1P
- 7.2.2. 2P
- 7.2.3. 3P
- 7.2.4. 4P
- 7.1. Market Analysis, Insights and Forecast - by Application
- 8. Europe Portable Tents Analysis, Insights and Forecast, 2019-2031
- 8.1. Market Analysis, Insights and Forecast - by Application
- 8.1.1. Supermarkets(Offline)
- 8.1.2. Exclusive Stores(Offline)
- 8.1.3. Online
- 8.2. Market Analysis, Insights and Forecast - by Types
- 8.2.1. 1P
- 8.2.2. 2P
- 8.2.3. 3P
- 8.2.4. 4P
- 8.1. Market Analysis, Insights and Forecast - by Application
- 9. Middle East & Africa Portable Tents Analysis, Insights and Forecast, 2019-2031
- 9.1. Market Analysis, Insights and Forecast - by Application
- 9.1.1. Supermarkets(Offline)
- 9.1.2. Exclusive Stores(Offline)
- 9.1.3. Online
- 9.2. Market Analysis, Insights and Forecast - by Types
- 9.2.1. 1P
- 9.2.2. 2P
- 9.2.3. 3P
- 9.2.4. 4P
- 9.1. Market Analysis, Insights and Forecast - by Application
- 10. Asia Pacific Portable Tents Analysis, Insights and Forecast, 2019-2031
- 10.1. Market Analysis, Insights and Forecast - by Application
- 10.1.1. Supermarkets(Offline)
- 10.1.2. Exclusive Stores(Offline)
- 10.1.3. Online
- 10.2. Market Analysis, Insights and Forecast - by Types
- 10.2.1. 1P
- 10.2.2. 2P
- 10.2.3. 3P
- 10.2.4. 4P
- 10.1. Market Analysis, Insights and Forecast - by Application
- 11. Competitive Analysis
- 11.1. Global Market Share Analysis 2024
- 11.2. Company Profiles
- 11.2.1 The North Face(VF Corporation)
- 11.2.1.1. Overview
- 11.2.1.2. Products
- 11.2.1.3. SWOT Analysis
- 11.2.1.4. Recent Developments
- 11.2.1.5. Financials (Based on Availability)
- 11.2.2 Zpacks
- 11.2.2.1. Overview
- 11.2.2.2. Products
- 11.2.2.3. SWOT Analysis
- 11.2.2.4. Recent Developments
- 11.2.2.5. Financials (Based on Availability)
- 11.2.3 Big Agnes
- 11.2.3.1. Overview
- 11.2.3.2. Products
- 11.2.3.3. SWOT Analysis
- 11.2.3.4. Recent Developments
- 11.2.3.5. Financials (Based on Availability)
- 11.2.4 Cascade Designs
- 11.2.4.1. Overview
- 11.2.4.2. Products
- 11.2.4.3. SWOT Analysis
- 11.2.4.4. Recent Developments
- 11.2.4.5. Financials (Based on Availability)
- 11.2.5 EXPED
- 11.2.5.1. Overview
- 11.2.5.2. Products
- 11.2.5.3. SWOT Analysis
- 11.2.5.4. Recent Developments
- 11.2.5.5. Financials (Based on Availability)
- 11.2.6 Gossamer Gear
- 11.2.6.1. Overview
- 11.2.6.2. Products
- 11.2.6.3. SWOT Analysis
- 11.2.6.4. Recent Developments
- 11.2.6.5. Financials (Based on Availability)
- 11.2.7 Hilleberg
- 11.2.7.1. Overview
- 11.2.7.2. Products
- 11.2.7.3. SWOT Analysis
- 11.2.7.4. Recent Developments
- 11.2.7.5. Financials (Based on Availability)
- 11.2.8 Kelty
- 11.2.8.1. Overview
- 11.2.8.2. Products
- 11.2.8.3. SWOT Analysis
- 11.2.8.4. Recent Developments
- 11.2.8.5. Financials (Based on Availability)
- 11.2.9 Marmot Mountain
- 11.2.9.1. Overview
- 11.2.9.2. Products
- 11.2.9.3. SWOT Analysis
- 11.2.9.4. Recent Developments
- 11.2.9.5. Financials (Based on Availability)
- 11.2.10 Mountain Laurel Designs
- 11.2.10.1. Overview
- 11.2.10.2. Products
- 11.2.10.3. SWOT Analysis
- 11.2.10.4. Recent Developments
- 11.2.10.5. Financials (Based on Availability)
- 11.2.11 NEMO Equipment
- 11.2.11.1. Overview
- 11.2.11.2. Products
- 11.2.11.3. SWOT Analysis
- 11.2.11.4. Recent Developments
- 11.2.11.5. Financials (Based on Availability)
- 11.2.12 Recreational Equipment
- 11.2.12.1. Overview
- 11.2.12.2. Products
- 11.2.12.3. SWOT Analysis
- 11.2.12.4. Recent Developments
- 11.2.12.5. Financials (Based on Availability)
- 11.2.13 Sea to Summit
- 11.2.13.1. Overview
- 11.2.13.2. Products
- 11.2.13.3. SWOT Analysis
- 11.2.13.4. Recent Developments
- 11.2.13.5. Financials (Based on Availability)
- 11.2.14 Six Moon Designs
- 11.2.14.1. Overview
- 11.2.14.2. Products
- 11.2.14.3. SWOT Analysis
- 11.2.14.4. Recent Developments
- 11.2.14.5. Financials (Based on Availability)
- 11.2.15 SlingFin
- 11.2.15.1. Overview
- 11.2.15.2. Products
- 11.2.15.3. SWOT Analysis
- 11.2.15.4. Recent Developments
- 11.2.15.5. Financials (Based on Availability)
- 11.2.16 Tarptent
- 11.2.16.1. Overview
- 11.2.16.2. Products
- 11.2.16.3. SWOT Analysis
- 11.2.16.4. Recent Developments
- 11.2.16.5. Financials (Based on Availability)
- 11.2.1 The North Face(VF Corporation)
List of Figures
- Figure 1: Global Portable Tents Revenue Breakdown (million, %) by Region 2024 & 2032
- Figure 2: Global Portable Tents Volume Breakdown (K, %) by Region 2024 & 2032
- Figure 3: North America Portable Tents Revenue (million), by Application 2024 & 2032
- Figure 4: North America Portable Tents Volume (K), by Application 2024 & 2032
- Figure 5: North America Portable Tents Revenue Share (%), by Application 2024 & 2032
- Figure 6: North America Portable Tents Volume Share (%), by Application 2024 & 2032
- Figure 7: North America Portable Tents Revenue (million), by Types 2024 & 2032
- Figure 8: North America Portable Tents Volume (K), by Types 2024 & 2032
- Figure 9: North America Portable Tents Revenue Share (%), by Types 2024 & 2032
- Figure 10: North America Portable Tents Volume Share (%), by Types 2024 & 2032
- Figure 11: North America Portable Tents Revenue (million), by Country 2024 & 2032
- Figure 12: North America Portable Tents Volume (K), by Country 2024 & 2032
- Figure 13: North America Portable Tents Revenue Share (%), by Country 2024 & 2032
- Figure 14: North America Portable Tents Volume Share (%), by Country 2024 & 2032
- Figure 15: South America Portable Tents Revenue (million), by Application 2024 & 2032
- Figure 16: South America Portable Tents Volume (K), by Application 2024 & 2032
- Figure 17: South America Portable Tents Revenue Share (%), by Application 2024 & 2032
- Figure 18: South America Portable Tents Volume Share (%), by Application 2024 & 2032
- Figure 19: South America Portable Tents Revenue (million), by Types 2024 & 2032
- Figure 20: South America Portable Tents Volume (K), by Types 2024 & 2032
- Figure 21: South America Portable Tents Revenue Share (%), by Types 2024 & 2032
- Figure 22: South America Portable Tents Volume Share (%), by Types 2024 & 2032
- Figure 23: South America Portable Tents Revenue (million), by Country 2024 & 2032
- Figure 24: South America Portable Tents Volume (K), by Country 2024 & 2032
- Figure 25: South America Portable Tents Revenue Share (%), by Country 2024 & 2032
- Figure 26: South America Portable Tents Volume Share (%), by Country 2024 & 2032
- Figure 27: Europe Portable Tents Revenue (million), by Application 2024 & 2032
- Figure 28: Europe Portable Tents Volume (K), by Application 2024 & 2032
- Figure 29: Europe Portable Tents Revenue Share (%), by Application 2024 & 2032
- Figure 30: Europe Portable Tents Volume Share (%), by Application 2024 & 2032
- Figure 31: Europe Portable Tents Revenue (million), by Types 2024 & 2032
- Figure 32: Europe Portable Tents Volume (K), by Types 2024 & 2032
- Figure 33: Europe Portable Tents Revenue Share (%), by Types 2024 & 2032
- Figure 34: Europe Portable Tents Volume Share (%), by Types 2024 & 2032
- Figure 35: Europe Portable Tents Revenue (million), by Country 2024 & 2032
- Figure 36: Europe Portable Tents Volume (K), by Country 2024 & 2032
- Figure 37: Europe Portable Tents Revenue Share (%), by Country 2024 & 2032
- Figure 38: Europe Portable Tents Volume Share (%), by Country 2024 & 2032
- Figure 39: Middle East & Africa Portable Tents Revenue (million), by Application 2024 & 2032
- Figure 40: Middle East & Africa Portable Tents Volume (K), by Application 2024 & 2032
- Figure 41: Middle East & Africa Portable Tents Revenue Share (%), by Application 2024 & 2032
- Figure 42: Middle East & Africa Portable Tents Volume Share (%), by Application 2024 & 2032
- Figure 43: Middle East & Africa Portable Tents Revenue (million), by Types 2024 & 2032
- Figure 44: Middle East & Africa Portable Tents Volume (K), by Types 2024 & 2032
- Figure 45: Middle East & Africa Portable Tents Revenue Share (%), by Types 2024 & 2032
- Figure 46: Middle East & Africa Portable Tents Volume Share (%), by Types 2024 & 2032
- Figure 47: Middle East & Africa Portable Tents Revenue (million), by Country 2024 & 2032
- Figure 48: Middle East & Africa Portable Tents Volume (K), by Country 2024 & 2032
- Figure 49: Middle East & Africa Portable Tents Revenue Share (%), by Country 2024 & 2032
- Figure 50: Middle East & Africa Portable Tents Volume Share (%), by Country 2024 & 2032
- Figure 51: Asia Pacific Portable Tents Revenue (million), by Application 2024 & 2032
- Figure 52: Asia Pacific Portable Tents Volume (K), by Application 2024 & 2032
- Figure 53: Asia Pacific Portable Tents Revenue Share (%), by Application 2024 & 2032
- Figure 54: Asia Pacific Portable Tents Volume Share (%), by Application 2024 & 2032
- Figure 55: Asia Pacific Portable Tents Revenue (million), by Types 2024 & 2032
- Figure 56: Asia Pacific Portable Tents Volume (K), by Types 2024 & 2032
- Figure 57: Asia Pacific Portable Tents Revenue Share (%), by Types 2024 & 2032
- Figure 58: Asia Pacific Portable Tents Volume Share (%), by Types 2024 & 2032
- Figure 59: Asia Pacific Portable Tents Revenue (million), by Country 2024 & 2032
- Figure 60: Asia Pacific Portable Tents Volume (K), by Country 2024 & 2032
- Figure 61: Asia Pacific Portable Tents Revenue Share (%), by Country 2024 & 2032
- Figure 62: Asia Pacific Portable Tents Volume Share (%), by Country 2024 & 2032
List of Tables
- Table 1: Global Portable Tents Revenue million Forecast, by Region 2019 & 2032
- Table 2: Global Portable Tents Volume K Forecast, by Region 2019 & 2032
- Table 3: Global Portable Tents Revenue million Forecast, by Application 2019 & 2032
- Table 4: Global Portable Tents Volume K Forecast, by Application 2019 & 2032
- Table 5: Global Portable Tents Revenue million Forecast, by Types 2019 & 2032
- Table 6: Global Portable Tents Volume K Forecast, by Types 2019 & 2032
- Table 7: Global Portable Tents Revenue million Forecast, by Region 2019 & 2032
- Table 8: Global Portable Tents Volume K Forecast, by Region 2019 & 2032
- Table 9: Global Portable Tents Revenue million Forecast, by Application 2019 & 2032
- Table 10: Global Portable Tents Volume K Forecast, by Application 2019 & 2032
- Table 11: Global Portable Tents Revenue million Forecast, by Types 2019 & 2032
- Table 12: Global Portable Tents Volume K Forecast, by Types 2019 & 2032
- Table 13: Global Portable Tents Revenue million Forecast, by Country 2019 & 2032
- Table 14: Global Portable Tents Volume K Forecast, by Country 2019 & 2032
- Table 15: United States Portable Tents Revenue (million) Forecast, by Application 2019 & 2032
- Table 16: United States Portable Tents Volume (K) Forecast, by Application 2019 & 2032
- Table 17: Canada Portable Tents Revenue (million) Forecast, by Application 2019 & 2032
- Table 18: Canada Portable Tents Volume (K) Forecast, by Application 2019 & 2032
- Table 19: Mexico Portable Tents Revenue (million) Forecast, by Application 2019 & 2032
- Table 20: Mexico Portable Tents Volume (K) Forecast, by Application 2019 & 2032
- Table 21: Global Portable Tents Revenue million Forecast, by Application 2019 & 2032
- Table 22: Global Portable Tents Volume K Forecast, by Application 2019 & 2032
- Table 23: Global Portable Tents Revenue million Forecast, by Types 2019 & 2032
- Table 24: Global Portable Tents Volume K Forecast, by Types 2019 & 2032
- Table 25: Global Portable Tents Revenue million Forecast, by Country 2019 & 2032
- Table 26: Global Portable Tents Volume K Forecast, by Country 2019 & 2032
- Table 27: Brazil Portable Tents Revenue (million) Forecast, by Application 2019 & 2032
- Table 28: Brazil Portable Tents Volume (K) Forecast, by Application 2019 & 2032
- Table 29: Argentina Portable Tents Revenue (million) Forecast, by Application 2019 & 2032
- Table 30: Argentina Portable Tents Volume (K) Forecast, by Application 2019 & 2032
- Table 31: Rest of South America Portable Tents Revenue (million) Forecast, by Application 2019 & 2032
- Table 32: Rest of South America Portable Tents Volume (K) Forecast, by Application 2019 & 2032
- Table 33: Global Portable Tents Revenue million Forecast, by Application 2019 & 2032
- Table 34: Global Portable Tents Volume K Forecast, by Application 2019 & 2032
- Table 35: Global Portable Tents Revenue million Forecast, by Types 2019 & 2032
- Table 36: Global Portable Tents Volume K Forecast, by Types 2019 & 2032
- Table 37: Global Portable Tents Revenue million Forecast, by Country 2019 & 2032
- Table 38: Global Portable Tents Volume K Forecast, by Country 2019 & 2032
- Table 39: United Kingdom Portable Tents Revenue (million) Forecast, by Application 2019 & 2032
- Table 40: United Kingdom Portable Tents Volume (K) Forecast, by Application 2019 & 2032
- Table 41: Germany Portable Tents Revenue (million) Forecast, by Application 2019 & 2032
- Table 42: Germany Portable Tents Volume (K) Forecast, by Application 2019 & 2032
- Table 43: France Portable Tents Revenue (million) Forecast, by Application 2019 & 2032
- Table 44: France Portable Tents Volume (K) Forecast, by Application 2019 & 2032
- Table 45: Italy Portable Tents Revenue (million) Forecast, by Application 2019 & 2032
- Table 46: Italy Portable Tents Volume (K) Forecast, by Application 2019 & 2032
- Table 47: Spain Portable Tents Revenue (million) Forecast, by Application 2019 & 2032
- Table 48: Spain Portable Tents Volume (K) Forecast, by Application 2019 & 2032
- Table 49: Russia Portable Tents Revenue (million) Forecast, by Application 2019 & 2032
- Table 50: Russia Portable Tents Volume (K) Forecast, by Application 2019 & 2032
- Table 51: Benelux Portable Tents Revenue (million) Forecast, by Application 2019 & 2032
- Table 52: Benelux Portable Tents Volume (K) Forecast, by Application 2019 & 2032
- Table 53: Nordics Portable Tents Revenue (million) Forecast, by Application 2019 & 2032
- Table 54: Nordics Portable Tents Volume (K) Forecast, by Application 2019 & 2032
- Table 55: Rest of Europe Portable Tents Revenue (million) Forecast, by Application 2019 & 2032
- Table 56: Rest of Europe Portable Tents Volume (K) Forecast, by Application 2019 & 2032
- Table 57: Global Portable Tents Revenue million Forecast, by Application 2019 & 2032
- Table 58: Global Portable Tents Volume K Forecast, by Application 2019 & 2032
- Table 59: Global Portable Tents Revenue million Forecast, by Types 2019 & 2032
- Table 60: Global Portable Tents Volume K Forecast, by Types 2019 & 2032
- Table 61: Global Portable Tents Revenue million Forecast, by Country 2019 & 2032
- Table 62: Global Portable Tents Volume K Forecast, by Country 2019 & 2032
- Table 63: Turkey Portable Tents Revenue (million) Forecast, by Application 2019 & 2032
- Table 64: Turkey Portable Tents Volume (K) Forecast, by Application 2019 & 2032
- Table 65: Israel Portable Tents Revenue (million) Forecast, by Application 2019 & 2032
- Table 66: Israel Portable Tents Volume (K) Forecast, by Application 2019 & 2032
- Table 67: GCC Portable Tents Revenue (million) Forecast, by Application 2019 & 2032
- Table 68: GCC Portable Tents Volume (K) Forecast, by Application 2019 & 2032
- Table 69: North Africa Portable Tents Revenue (million) Forecast, by Application 2019 & 2032
- Table 70: North Africa Portable Tents Volume (K) Forecast, by Application 2019 & 2032
- Table 71: South Africa Portable Tents Revenue (million) Forecast, by Application 2019 & 2032
- Table 72: South Africa Portable Tents Volume (K) Forecast, by Application 2019 & 2032
- Table 73: Rest of Middle East & Africa Portable Tents Revenue (million) Forecast, by Application 2019 & 2032
- Table 74: Rest of Middle East & Africa Portable Tents Volume (K) Forecast, by Application 2019 & 2032
- Table 75: Global Portable Tents Revenue million Forecast, by Application 2019 & 2032
- Table 76: Global Portable Tents Volume K Forecast, by Application 2019 & 2032
- Table 77: Global Portable Tents Revenue million Forecast, by Types 2019 & 2032
- Table 78: Global Portable Tents Volume K Forecast, by Types 2019 & 2032
- Table 79: Global Portable Tents Revenue million Forecast, by Country 2019 & 2032
- Table 80: Global Portable Tents Volume K Forecast, by Country 2019 & 2032
- Table 81: China Portable Tents Revenue (million) Forecast, by Application 2019 & 2032
- Table 82: China Portable Tents Volume (K) Forecast, by Application 2019 & 2032
- Table 83: India Portable Tents Revenue (million) Forecast, by Application 2019 & 2032
- Table 84: India Portable Tents Volume (K) Forecast, by Application 2019 & 2032
- Table 85: Japan Portable Tents Revenue (million) Forecast, by Application 2019 & 2032
- Table 86: Japan Portable Tents Volume (K) Forecast, by Application 2019 & 2032
- Table 87: South Korea Portable Tents Revenue (million) Forecast, by Application 2019 & 2032
- Table 88: South Korea Portable Tents Volume (K) Forecast, by Application 2019 & 2032
- Table 89: ASEAN Portable Tents Revenue (million) Forecast, by Application 2019 & 2032
- Table 90: ASEAN Portable Tents Volume (K) Forecast, by Application 2019 & 2032
- Table 91: Oceania Portable Tents Revenue (million) Forecast, by Application 2019 & 2032
- Table 92: Oceania Portable Tents Volume (K) Forecast, by Application 2019 & 2032
- Table 93: Rest of Asia Pacific Portable Tents Revenue (million) Forecast, by Application 2019 & 2032
- Table 94: Rest of Asia Pacific Portable Tents Volume (K) Forecast, by Application 2019 & 2032
Frequently Asked Questions
1. What is the projected Compound Annual Growth Rate (CAGR) of the Portable Tents?
The projected CAGR is approximately XX%.
2. Which companies are prominent players in the Portable Tents?
Key companies in the market include The North Face(VF Corporation), Zpacks, Big Agnes, Cascade Designs, EXPED, Gossamer Gear, Hilleberg, Kelty, Marmot Mountain, Mountain Laurel Designs, NEMO Equipment, Recreational Equipment, Sea to Summit, Six Moon Designs, SlingFin, Tarptent.
3. What are the main segments of the Portable Tents?
The market segments include Application, Types.
4. Can you provide details about the market size?
The market size is estimated to be USD XXX million as of 2022.
5. What are some drivers contributing to market growth?
N/A
6. What are the notable trends driving market growth?
N/A
7. Are there any restraints impacting market growth?
N/A
8. Can you provide examples of recent developments in the market?
N/A
9. What pricing options are available for accessing the report?
Pricing options include single-user, multi-user, and enterprise licenses priced at USD 3350.00, USD 5025.00, and USD 6700.00 respectively.
10. Is the market size provided in terms of value or volume?
The market size is provided in terms of value, measured in million and volume, measured in K.
11. Are there any specific market keywords associated with the report?
Yes, the market keyword associated with the report is "Portable Tents," which aids in identifying and referencing the specific market segment covered.
12. How do I determine which pricing option suits my needs best?
The pricing options vary based on user requirements and access needs. Individual users may opt for single-user licenses, while businesses requiring broader access may choose multi-user or enterprise licenses for cost-effective access to the report.
13. Are there any additional resources or data provided in the Portable Tents report?
While the report offers comprehensive insights, it's advisable to review the specific contents or supplementary materials provided to ascertain if additional resources or data are available.
14. How can I stay updated on further developments or reports in the Portable Tents?
To stay informed about further developments, trends, and reports in the Portable Tents, consider subscribing to industry newsletters, following relevant companies and organizations, or regularly checking reputable industry news sources and publications.
Methodology
Step 1 - Identification of Relevant Samples Size from Population Database


Step 2 - Approaches for Defining Global Market Size (Value, Volume* & Price*)

Note*: In applicable scenarios
Step 3 - Data Sources
Primary Research
- Web Analytics
- Survey Reports
- Research Institute
- Latest Research Reports
- Opinion Leaders
Secondary Research
- Annual Reports
- White Paper
- Latest Press Release
- Industry Association
- Paid Database
- Investor Presentations

Step 4 - Data Triangulation
Involves using different sources of information in order to increase the validity of a study
These sources are likely to be stakeholders in a program - participants, other researchers, program staff, other community members, and so on.
Then we put all data in single framework & apply various statistical tools to find out the dynamic on the market.
During the analysis stage, feedback from the stakeholder groups would be compared to determine areas of agreement as well as areas of divergence


