Key Insights
The portable chromatography systems market, valued at $563.52 million in 2025, is projected to experience robust growth, driven by increasing demand from biotechnology and pharmaceutical companies, research laboratories, and environmental monitoring agencies. The market's expansion is fueled by several key factors. Firstly, the rising need for rapid, on-site analysis in diverse settings, such as field testing, clinical diagnostics, and environmental monitoring, is significantly boosting adoption. Secondly, advancements in miniaturization and sensor technology are leading to the development of more compact, user-friendly, and cost-effective portable chromatography systems. This is further complemented by the growing prevalence of point-of-care diagnostics and decentralized testing facilities. Finally, stringent regulations regarding environmental monitoring and the increasing need for efficient quality control in various industries are contributing to market growth. The market is segmented by portability (person-portable, transportable), type (portable gas chromatography systems, portable liquid chromatography systems), and end-user (biotechnology and pharmaceutical companies, research laboratories, others). While North America currently holds a significant market share due to advanced technological infrastructure and high adoption rates, the Asia-Pacific region is poised for substantial growth driven by rising healthcare expenditure and increasing research and development activities. Competition is relatively high, with established players such as Agilent Technologies and PerkinElmer alongside emerging companies innovating in this dynamic space.
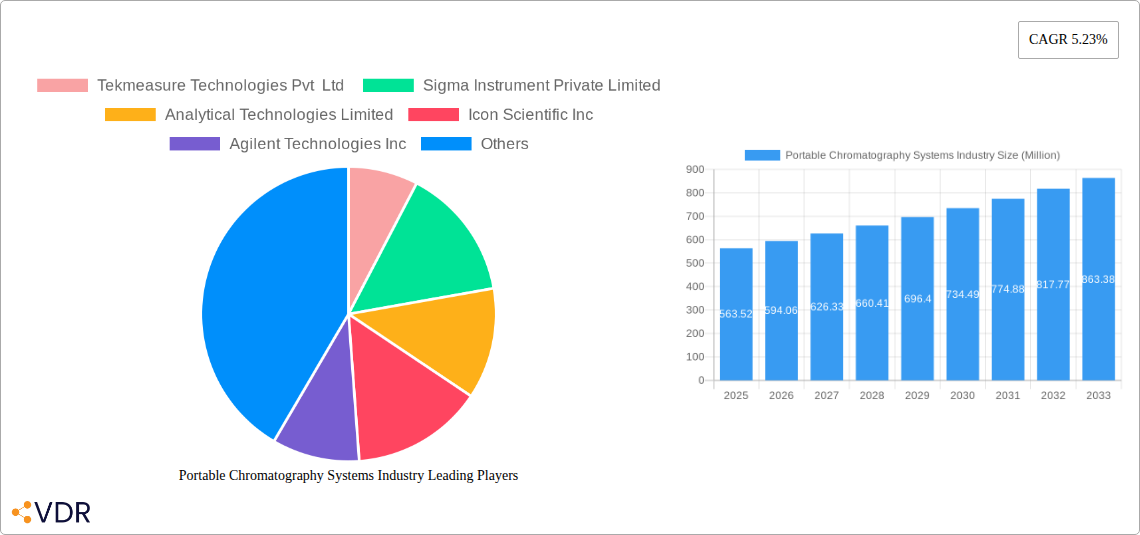
Portable Chromatography Systems Industry Market Size (In Million)
The forecast period from 2025 to 2033 anticipates a continued expansion, projected at a Compound Annual Growth Rate (CAGR) of 5.23%. This growth will likely be influenced by ongoing technological improvements, such as enhanced sensitivity, improved data analysis capabilities, and the integration of advanced functionalities like wireless connectivity and cloud-based data management. However, challenges remain, including the relatively high initial investment costs and the need for skilled personnel to operate and maintain these systems. Despite these restraints, the market’s trajectory indicates strong future potential, particularly in emerging markets where rapid diagnostics and decentralized testing are becoming increasingly important. Continuous innovation and strategic partnerships are expected to drive further penetration into various application areas, solidifying the portable chromatography systems market's position as a critical component in numerous industries.
Portable Chromatography Systems Industry Company Market Share
Portable Chromatography Systems Industry Market Report: 2019-2033
This comprehensive report provides an in-depth analysis of the Portable Chromatography Systems market, encompassing market dynamics, growth trends, regional dominance, product landscape, key players, and future outlook. The study period covers 2019-2033, with 2025 as the base year and a forecast period of 2025-2033. The report segments the market by End-User (Biotechnology and Pharmaceutical Companies, Research Laboratories, Others), Portability (Person Portable, Transportable), and Type (Portable Gas Chromatography Systems, Portable Liquid Chromatography Systems). The global market size is projected to reach xx Million units by 2033.
Portable Chromatography Systems Industry Market Dynamics & Structure
The portable chromatography systems market is a dynamic landscape characterized by a moderate level of concentration, where established companies are strategically enhancing their portfolios through technological innovation and targeted acquisitions. A significant driver for market expansion is the relentless pursuit of miniaturization and the development of highly sensitive, advanced sensor technologies. Furthermore, the industry's trajectory is heavily influenced by rigorous regulatory frameworks, particularly within the pharmaceutical, healthcare, and environmental sectors, which dictate product development, validation, and adoption standards. While facing competition from alternative analytical techniques, the core advantage of portable chromatography lies in its ability to deliver rapid, on-site analysis, meeting a critical need for immediate results. The sector anticipates a notable increase in mergers and acquisitions (M&A) activity as key players seek to consolidate their market positions, broaden their product offerings, and extend their global footprint.
- Market Concentration: Moderately concentrated, with the top 5 players collectively holding an estimated xx% of the global market share in 2025. This concentration is expected to see minor shifts due to strategic M&A.
- Technological Innovation: Key advancements focus on miniaturization for enhanced portability, significantly improved sensitivity through novel sensor designs, and the integration of robust wireless connectivity for seamless data transfer and remote monitoring.
- Regulatory Landscape: Stringent regulatory compliance remains a critical factor, especially for applications in pharmaceutical quality control, food safety, and environmental monitoring, demanding rigorous validation and adherence to international standards.
- Competitive Substitutes: While techniques such as spectroscopy and electrophoresis offer alternative analytical solutions, portable chromatography maintains a competitive edge in specific applications requiring separation and identification capabilities on-site.
- M&A Activity: Historically, M&A activity has been observed to be low to moderate. However, projections indicate a slight uptick in the forecast period as companies strategize for market consolidation and synergistic growth. Approximately xx M&A deals were recorded between 2019 and 2024.
- End-User Demographics: The primary growth impetus stems from the escalating adoption rates within the biotechnology, pharmaceutical, and environmental monitoring sectors, with increasing interest from emerging fields like food and beverage quality control.
Portable Chromatography Systems Industry Growth Trends & Insights
The portable chromatography systems market has demonstrated robust growth, achieving a Compound Annual Growth Rate (CAGR) of xx% during the historical period of 2019-2024. This expansion is primarily attributed to the escalating global demand for swift and accurate on-site analytical capabilities across a diverse range of industries. Developed regions currently lead in adoption rates, while emerging markets are presenting substantial growth opportunities with increasing investment in analytical infrastructure. Technological advancements, including the seamless integration of advanced sensor technologies and sophisticated data analytics platforms, are acting as significant catalysts for market acceleration. Consumer behavior is increasingly favoring compact, user-friendly devices that offer enhanced analytical precision and intuitive operation. The market is projected to sustain this strong growth trajectory through the forecast period, fueled by continuous innovation and the broadening spectrum of applications. Market penetration is anticipated to reach an impressive xx% by 2033.
- Market Size Evolution: The market has witnessed significant expansion from 2019 to 2024 and is projected to maintain a strong growth trajectory through to 2033, indicating sustained market vitality.
- Adoption Rates: High adoption is currently observed in mature economies, with a notable increase in penetration and demand anticipated in emerging markets as analytical infrastructure develops.
- Technological Disruptions: Continuous technological innovations, particularly in miniaturization, enhancing device sensitivity, and enabling wireless data transmission, are pivotal in driving broader adoption and expanding application areas.
- Consumer Behavior Shifts: A pronounced shift towards user-friendly, highly portable, and reliable analytical systems is evident, as end-users prioritize efficiency and ease of operation in field-based testing scenarios.
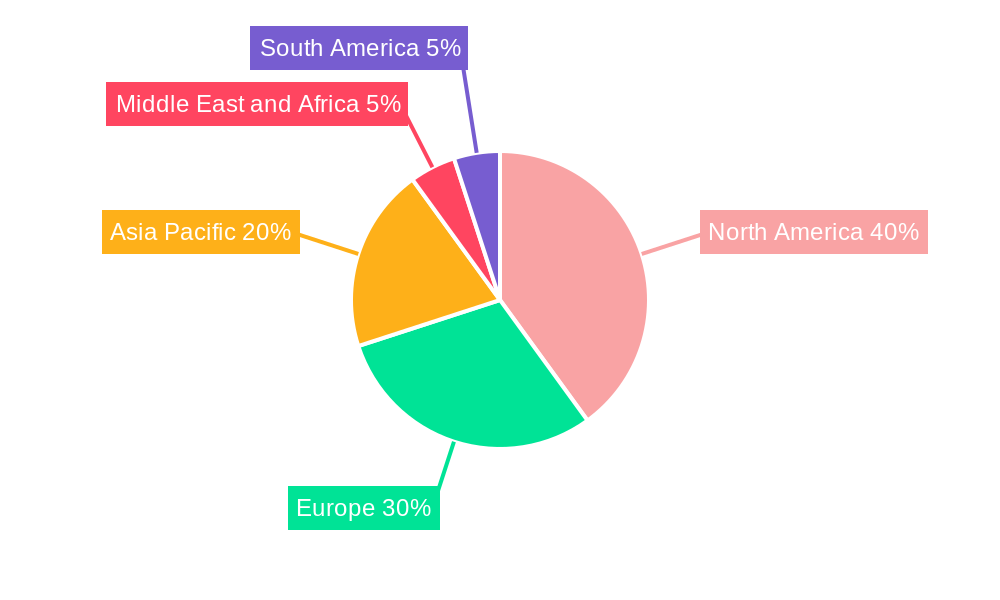
Dominant Regions, Countries, or Segments in Portable Chromatography Systems Industry
North America currently dominates the portable chromatography systems market, driven by strong technological advancements, robust regulatory frameworks, and significant investments in research and development within the biotechnology and pharmaceutical sectors. Within this region, the United States holds the largest market share, followed by Canada. Europe is another significant market, with strong growth driven by increasing environmental regulations and the presence of a large number of research laboratories. Asia-Pacific is a high-growth region, particularly driven by the expanding pharmaceutical industry in countries such as China and India. The biotechnology and pharmaceutical companies segment is the largest end-user, followed by research laboratories. Person-portable devices constitute a larger segment than transportable ones due to their ease of use and wide range of applications. Portable liquid chromatography systems hold a larger market share than portable gas chromatography systems due to their versatility and wider range of applications.
- North America: Largest market share, driven by strong R&D investment and robust regulatory frameworks.
- Europe: Significant market with considerable growth potential due to stringent environmental regulations.
- Asia-Pacific: High-growth region, fueled by expanding pharmaceutical and research sectors in countries like China and India.
- End-User Segment: Biotechnology and pharmaceutical companies dominate the market.
- Portability Segment: Person-portable systems hold a larger market share than transportable systems.
- Type Segment: Portable liquid chromatography systems dominate the market due to their versatility.
Portable Chromatography Systems Industry Product Landscape
The product landscape of portable chromatography systems is undergoing rapid and transformative evolution, characterized by significant advancements in miniaturization, enhanced sensitivity, and the integration of sophisticated data analysis tools. These next-generation systems are engineered to offer unparalleled portability, intuitive user interfaces, and drastically reduced analysis times, directly addressing the critical need for immediate, on-site testing. Key innovations driving this transformation include the widespread adoption of microfluidic devices for sample handling and separation, the development of advanced detector technologies for improved signal detection, and the seamless integration of wireless connectivity for real-time data management. Unique selling propositions are increasingly centered on exceptional ease of use, significantly shortened analysis durations, and the delivery of high-quality, reliable data. The relentless pursuit of improved sensitivity, greater portability, and enhanced robustness across diverse and challenging application environments fuels ongoing technological advancements in this sector.
Key Drivers, Barriers & Challenges in Portable Chromatography Systems Industry
Key Drivers: Increasing demand for on-site analysis, advancements in miniaturization and sensor technology, stringent environmental regulations, growing investment in research and development, and the expansion of the biotechnology and pharmaceutical industries. For instance, the rising need for rapid pathogen detection in healthcare and environmental monitoring has significantly boosted the demand for these systems.
Challenges: High initial costs, complex operational procedures, limited availability of skilled personnel, and potential regulatory hurdles in certain regions can hinder market growth. Supply chain disruptions can also impact availability and pricing. Competition from alternative analytical techniques may pose a challenge in certain applications.
Emerging Opportunities in Portable Chromatography Systems Industry
Untapped markets in developing regions, particularly in environmental monitoring and food safety testing, present significant growth opportunities. Integration of artificial intelligence (AI) for automated data analysis and the development of novel applications in point-of-care diagnostics are emerging trends. Evolving consumer preferences toward portable, user-friendly, and cost-effective systems will drive innovation.
Growth Accelerators in the Portable Chromatography Systems Industry Industry
Several pivotal factors are acting as significant growth accelerators for the portable chromatography systems industry. Foremost among these are groundbreaking technological advancements in miniaturization, leading to smaller and more portable devices, and the development of highly sensitive and selective sensor technologies that enhance analytical performance. Furthermore, sophisticated data analysis capabilities, often powered by AI and machine learning, are increasing the utility and accessibility of these systems. Strategic collaborations and partnerships between instrument manufacturers and software developers are crucial for enhancing product functionalities, expanding market reach, and offering integrated solutions. The strategic expansion into underserved markets, particularly in developing economies with burgeoning industrial and environmental monitoring needs, presents a substantial avenue for accelerated growth.
Key Players Shaping the Portable Chromatography Systems Industry Market
- Tekmeasure Technologies Pvt Ltd
- Sigma Instrument Private Limited
- Analytical Technologies Limited
- Icon Scientific Inc
- Agilent Technologies Inc
- PerkinElmer Inc
- INFICON
- Axcend
- FLIR Systems Inc
Notable Milestones in Portable Chromatography Systems Industry Sector
- 2020: Launch of a new portable GC system with improved sensitivity by Agilent Technologies Inc.
- 2021: Acquisition of a smaller chromatography company by PerkinElmer Inc., expanding its product portfolio.
- 2022: Introduction of a wireless-enabled portable LC system by Icon Scientific Inc.
- 2023: Release of a new portable chromatography system incorporating AI-driven data analysis by Axcend. (Note: These are examples; actual dates and details may vary.)
In-Depth Portable Chromatography Systems Industry Market Outlook
The outlook for the portable chromatography systems market is exceptionally promising, with expectations of sustained and robust growth driven by a confluence of factors. Continuous innovation in technological capabilities, the ever-expanding array of applications across diverse sectors, and the persistent demand for efficient on-site analysis are key market drivers. Strategic investments in cutting-edge research and development, coupled with the formation of strategic alliances, are anticipated to further catalyze market expansion. Emerging and high-potential applications, such as point-of-care diagnostics in healthcare and advanced environmental monitoring solutions, are set to unlock significant new market opportunities. In the coming years, the market is poised to witness the introduction of even more user-friendly, cost-effective, and high-performance portable chromatography systems, further solidifying their indispensable role in modern analytical workflows.
Portable Chromatography Systems Industry Segmentation
-
1. Portability
- 1.1. Person Portable
- 1.2. Transportable
-
2. Type
- 2.1. Portable Gas Chromatography Systems
- 2.2. Portable Liquid Chromatography Systems
-
3. End-User
- 3.1. Biotechnology and Pharmaceutical Companies
- 3.2. Research Laboratories
- 3.3. Others
Portable Chromatography Systems Industry Segmentation By Geography
-
1. North America
- 1.1. United States
- 1.2. Canada
- 1.3. Mexico
-
2. Europe
- 2.1. Germany
- 2.2. United Kingdom
- 2.3. France
- 2.4. Italy
- 2.5. Spain
- 2.6. Rest of Europe
-
3. Asia Pacific
- 3.1. China
- 3.2. Japan
- 3.3. India
- 3.4. Australia
- 3.5. South Korea
- 3.6. Rest of Asia Pacific
-
4. Middle East and Africa
- 4.1. GCC
- 4.2. South Africa
- 4.3. Rest of Middle East and Africa
-
5. South America
- 5.1. Brazil
- 5.2. Argentina
- 5.3. Rest of South America
Portable Chromatography Systems Industry Regional Market Share
Geographic Coverage of Portable Chromatography Systems Industry
Portable Chromatography Systems Industry REPORT HIGHLIGHTS
| Aspects | Details |
|---|---|
| Study Period | 2020-2034 |
| Base Year | 2025 |
| Estimated Year | 2026 |
| Forecast Period | 2026-2034 |
| Historical Period | 2020-2025 |
| Growth Rate | CAGR of 5.23% from 2020-2034 |
| Segmentation |
|
Table of Contents
- 1. Introduction
- 1.1. Research Scope
- 1.2. Market Segmentation
- 1.3. Research Objective
- 1.4. Definitions and Assumptions
- 2. Executive Summary
- 2.1. Market Snapshot
- 3. Market Dynamics
- 3.1. Market Drivers
- 3.2. Market Restrains
- 3.3. Market Trends
- 3.4. Market Opportunities
- 4. Market Factor Analysis
- 4.1. Porters Five Forces
- 4.1.1. Bargaining Power of Suppliers
- 4.1.2. Bargaining Power of Buyers
- 4.1.3. Threat of New Entrants
- 4.1.4. Threat of Substitutes
- 4.1.5. Competitive Rivalry
- 4.2. PESTEL analysis
- 4.3. BCG Analysis
- 4.3.1. Stars (High Growth, High Market Share)
- 4.3.2. Cash Cows (Low Growth, High Market Share)
- 4.3.3. Question Mark (High Growth, Low Market Share)
- 4.3.4. Dogs (Low Growth, Low Market Share)
- 4.4. Ansoff Matrix Analysis
- 4.5. Supply Chain Analysis
- 4.6. Regulatory Landscape
- 4.7. Current Market Potential and Opportunity Assessment (TAM–SAM–SOM Framework)
- 4.8. VDR Analyst Note
- 4.1. Porters Five Forces
- 5. Market Analysis, Insights and Forecast 2021-2033
- 5.1. Market Analysis, Insights and Forecast - by Portability
- 5.1.1. Person Portable
- 5.1.2. Transportable
- 5.2. Market Analysis, Insights and Forecast - by Type
- 5.2.1. Portable Gas Chromatography Systems
- 5.2.2. Portable Liquid Chromatography Systems
- 5.3. Market Analysis, Insights and Forecast - by End-User
- 5.3.1. Biotechnology and Pharmaceutical Companies
- 5.3.2. Research Laboratories
- 5.3.3. Others
- 5.4. Market Analysis, Insights and Forecast - by Region
- 5.4.1. North America
- 5.4.2. Europe
- 5.4.3. Asia Pacific
- 5.4.4. Middle East and Africa
- 5.4.5. South America
- 5.1. Market Analysis, Insights and Forecast - by Portability
- 6. Global Portable Chromatography Systems Industry Analysis, Insights and Forecast, 2021-2033
- 6.1. Market Analysis, Insights and Forecast - by Portability
- 6.1.1. Person Portable
- 6.1.2. Transportable
- 6.2. Market Analysis, Insights and Forecast - by Type
- 6.2.1. Portable Gas Chromatography Systems
- 6.2.2. Portable Liquid Chromatography Systems
- 6.3. Market Analysis, Insights and Forecast - by End-User
- 6.3.1. Biotechnology and Pharmaceutical Companies
- 6.3.2. Research Laboratories
- 6.3.3. Others
- 6.1. Market Analysis, Insights and Forecast - by Portability
- 7. North America Portable Chromatography Systems Industry Analysis, Insights and Forecast, 2021-2033
- 7.1. Market Analysis, Insights and Forecast - by Portability
- 7.1.1. Person Portable
- 7.1.2. Transportable
- 7.2. Market Analysis, Insights and Forecast - by Type
- 7.2.1. Portable Gas Chromatography Systems
- 7.2.2. Portable Liquid Chromatography Systems
- 7.3. Market Analysis, Insights and Forecast - by End-User
- 7.3.1. Biotechnology and Pharmaceutical Companies
- 7.3.2. Research Laboratories
- 7.3.3. Others
- 7.1. Market Analysis, Insights and Forecast - by Portability
- 8. Europe Portable Chromatography Systems Industry Analysis, Insights and Forecast, 2021-2033
- 8.1. Market Analysis, Insights and Forecast - by Portability
- 8.1.1. Person Portable
- 8.1.2. Transportable
- 8.2. Market Analysis, Insights and Forecast - by Type
- 8.2.1. Portable Gas Chromatography Systems
- 8.2.2. Portable Liquid Chromatography Systems
- 8.3. Market Analysis, Insights and Forecast - by End-User
- 8.3.1. Biotechnology and Pharmaceutical Companies
- 8.3.2. Research Laboratories
- 8.3.3. Others
- 8.1. Market Analysis, Insights and Forecast - by Portability
- 9. Asia Pacific Portable Chromatography Systems Industry Analysis, Insights and Forecast, 2021-2033
- 9.1. Market Analysis, Insights and Forecast - by Portability
- 9.1.1. Person Portable
- 9.1.2. Transportable
- 9.2. Market Analysis, Insights and Forecast - by Type
- 9.2.1. Portable Gas Chromatography Systems
- 9.2.2. Portable Liquid Chromatography Systems
- 9.3. Market Analysis, Insights and Forecast - by End-User
- 9.3.1. Biotechnology and Pharmaceutical Companies
- 9.3.2. Research Laboratories
- 9.3.3. Others
- 9.1. Market Analysis, Insights and Forecast - by Portability
- 10. Middle East and Africa Portable Chromatography Systems Industry Analysis, Insights and Forecast, 2021-2033
- 10.1. Market Analysis, Insights and Forecast - by Portability
- 10.1.1. Person Portable
- 10.1.2. Transportable
- 10.2. Market Analysis, Insights and Forecast - by Type
- 10.2.1. Portable Gas Chromatography Systems
- 10.2.2. Portable Liquid Chromatography Systems
- 10.3. Market Analysis, Insights and Forecast - by End-User
- 10.3.1. Biotechnology and Pharmaceutical Companies
- 10.3.2. Research Laboratories
- 10.3.3. Others
- 10.1. Market Analysis, Insights and Forecast - by Portability
- 11. South America Portable Chromatography Systems Industry Analysis, Insights and Forecast, 2021-2033
- 11.1. Market Analysis, Insights and Forecast - by Portability
- 11.1.1. Person Portable
- 11.1.2. Transportable
- 11.2. Market Analysis, Insights and Forecast - by Type
- 11.2.1. Portable Gas Chromatography Systems
- 11.2.2. Portable Liquid Chromatography Systems
- 11.3. Market Analysis, Insights and Forecast - by End-User
- 11.3.1. Biotechnology and Pharmaceutical Companies
- 11.3.2. Research Laboratories
- 11.3.3. Others
- 11.1. Market Analysis, Insights and Forecast - by Portability
- 12. Competitive Analysis
- 12.1. Company Profiles
- 12.1.1 Tekmeasure Technologies Pvt Ltd
- 12.1.1.1. Company Overview
- 12.1.1.2. Products
- 12.1.1.3. Company Financials
- 12.1.1.4. SWOT Analysis
- 12.1.2 Sigma Instrument Private Limited
- 12.1.2.1. Company Overview
- 12.1.2.2. Products
- 12.1.2.3. Company Financials
- 12.1.2.4. SWOT Analysis
- 12.1.3 Analytical Technologies Limited
- 12.1.3.1. Company Overview
- 12.1.3.2. Products
- 12.1.3.3. Company Financials
- 12.1.3.4. SWOT Analysis
- 12.1.4 Icon Scientific Inc
- 12.1.4.1. Company Overview
- 12.1.4.2. Products
- 12.1.4.3. Company Financials
- 12.1.4.4. SWOT Analysis
- 12.1.5 Agilent Technologies Inc
- 12.1.5.1. Company Overview
- 12.1.5.2. Products
- 12.1.5.3. Company Financials
- 12.1.5.4. SWOT Analysis
- 12.1.6 PerkinElmer Inc
- 12.1.6.1. Company Overview
- 12.1.6.2. Products
- 12.1.6.3. Company Financials
- 12.1.6.4. SWOT Analysis
- 12.1.7 INFICON
- 12.1.7.1. Company Overview
- 12.1.7.2. Products
- 12.1.7.3. Company Financials
- 12.1.7.4. SWOT Analysis
- 12.1.8 Axcend
- 12.1.8.1. Company Overview
- 12.1.8.2. Products
- 12.1.8.3. Company Financials
- 12.1.8.4. SWOT Analysis
- 12.1.9 FLIR Systems Inc
- 12.1.9.1. Company Overview
- 12.1.9.2. Products
- 12.1.9.3. Company Financials
- 12.1.9.4. SWOT Analysis
- 12.1.1 Tekmeasure Technologies Pvt Ltd
- 12.2. Market Entropy
- 12.2.1 Company's Key Areas Served
- 12.2.2 Recent Developments
- 12.3. Company Market Share Analysis 2025
- 12.3.1 Top 5 Companies Market Share Analysis
- 12.3.2 Top 3 Companies Market Share Analysis
- 12.4. List of Potential Customers
- 13. Research Methodology
List of Figures
- Figure 1: Global Portable Chromatography Systems Industry Revenue Breakdown (Million, %) by Region 2025 & 2033
- Figure 2: Global Portable Chromatography Systems Industry Volume Breakdown (K Unit, %) by Region 2025 & 2033
- Figure 3: North America Portable Chromatography Systems Industry Revenue (Million), by Portability 2025 & 2033
- Figure 4: North America Portable Chromatography Systems Industry Volume (K Unit), by Portability 2025 & 2033
- Figure 5: North America Portable Chromatography Systems Industry Revenue Share (%), by Portability 2025 & 2033
- Figure 6: North America Portable Chromatography Systems Industry Volume Share (%), by Portability 2025 & 2033
- Figure 7: North America Portable Chromatography Systems Industry Revenue (Million), by Type 2025 & 2033
- Figure 8: North America Portable Chromatography Systems Industry Volume (K Unit), by Type 2025 & 2033
- Figure 9: North America Portable Chromatography Systems Industry Revenue Share (%), by Type 2025 & 2033
- Figure 10: North America Portable Chromatography Systems Industry Volume Share (%), by Type 2025 & 2033
- Figure 11: North America Portable Chromatography Systems Industry Revenue (Million), by End-User 2025 & 2033
- Figure 12: North America Portable Chromatography Systems Industry Volume (K Unit), by End-User 2025 & 2033
- Figure 13: North America Portable Chromatography Systems Industry Revenue Share (%), by End-User 2025 & 2033
- Figure 14: North America Portable Chromatography Systems Industry Volume Share (%), by End-User 2025 & 2033
- Figure 15: North America Portable Chromatography Systems Industry Revenue (Million), by Country 2025 & 2033
- Figure 16: North America Portable Chromatography Systems Industry Volume (K Unit), by Country 2025 & 2033
- Figure 17: North America Portable Chromatography Systems Industry Revenue Share (%), by Country 2025 & 2033
- Figure 18: North America Portable Chromatography Systems Industry Volume Share (%), by Country 2025 & 2033
- Figure 19: Europe Portable Chromatography Systems Industry Revenue (Million), by Portability 2025 & 2033
- Figure 20: Europe Portable Chromatography Systems Industry Volume (K Unit), by Portability 2025 & 2033
- Figure 21: Europe Portable Chromatography Systems Industry Revenue Share (%), by Portability 2025 & 2033
- Figure 22: Europe Portable Chromatography Systems Industry Volume Share (%), by Portability 2025 & 2033
- Figure 23: Europe Portable Chromatography Systems Industry Revenue (Million), by Type 2025 & 2033
- Figure 24: Europe Portable Chromatography Systems Industry Volume (K Unit), by Type 2025 & 2033
- Figure 25: Europe Portable Chromatography Systems Industry Revenue Share (%), by Type 2025 & 2033
- Figure 26: Europe Portable Chromatography Systems Industry Volume Share (%), by Type 2025 & 2033
- Figure 27: Europe Portable Chromatography Systems Industry Revenue (Million), by End-User 2025 & 2033
- Figure 28: Europe Portable Chromatography Systems Industry Volume (K Unit), by End-User 2025 & 2033
- Figure 29: Europe Portable Chromatography Systems Industry Revenue Share (%), by End-User 2025 & 2033
- Figure 30: Europe Portable Chromatography Systems Industry Volume Share (%), by End-User 2025 & 2033
- Figure 31: Europe Portable Chromatography Systems Industry Revenue (Million), by Country 2025 & 2033
- Figure 32: Europe Portable Chromatography Systems Industry Volume (K Unit), by Country 2025 & 2033
- Figure 33: Europe Portable Chromatography Systems Industry Revenue Share (%), by Country 2025 & 2033
- Figure 34: Europe Portable Chromatography Systems Industry Volume Share (%), by Country 2025 & 2033
- Figure 35: Asia Pacific Portable Chromatography Systems Industry Revenue (Million), by Portability 2025 & 2033
- Figure 36: Asia Pacific Portable Chromatography Systems Industry Volume (K Unit), by Portability 2025 & 2033
- Figure 37: Asia Pacific Portable Chromatography Systems Industry Revenue Share (%), by Portability 2025 & 2033
- Figure 38: Asia Pacific Portable Chromatography Systems Industry Volume Share (%), by Portability 2025 & 2033
- Figure 39: Asia Pacific Portable Chromatography Systems Industry Revenue (Million), by Type 2025 & 2033
- Figure 40: Asia Pacific Portable Chromatography Systems Industry Volume (K Unit), by Type 2025 & 2033
- Figure 41: Asia Pacific Portable Chromatography Systems Industry Revenue Share (%), by Type 2025 & 2033
- Figure 42: Asia Pacific Portable Chromatography Systems Industry Volume Share (%), by Type 2025 & 2033
- Figure 43: Asia Pacific Portable Chromatography Systems Industry Revenue (Million), by End-User 2025 & 2033
- Figure 44: Asia Pacific Portable Chromatography Systems Industry Volume (K Unit), by End-User 2025 & 2033
- Figure 45: Asia Pacific Portable Chromatography Systems Industry Revenue Share (%), by End-User 2025 & 2033
- Figure 46: Asia Pacific Portable Chromatography Systems Industry Volume Share (%), by End-User 2025 & 2033
- Figure 47: Asia Pacific Portable Chromatography Systems Industry Revenue (Million), by Country 2025 & 2033
- Figure 48: Asia Pacific Portable Chromatography Systems Industry Volume (K Unit), by Country 2025 & 2033
- Figure 49: Asia Pacific Portable Chromatography Systems Industry Revenue Share (%), by Country 2025 & 2033
- Figure 50: Asia Pacific Portable Chromatography Systems Industry Volume Share (%), by Country 2025 & 2033
- Figure 51: Middle East and Africa Portable Chromatography Systems Industry Revenue (Million), by Portability 2025 & 2033
- Figure 52: Middle East and Africa Portable Chromatography Systems Industry Volume (K Unit), by Portability 2025 & 2033
- Figure 53: Middle East and Africa Portable Chromatography Systems Industry Revenue Share (%), by Portability 2025 & 2033
- Figure 54: Middle East and Africa Portable Chromatography Systems Industry Volume Share (%), by Portability 2025 & 2033
- Figure 55: Middle East and Africa Portable Chromatography Systems Industry Revenue (Million), by Type 2025 & 2033
- Figure 56: Middle East and Africa Portable Chromatography Systems Industry Volume (K Unit), by Type 2025 & 2033
- Figure 57: Middle East and Africa Portable Chromatography Systems Industry Revenue Share (%), by Type 2025 & 2033
- Figure 58: Middle East and Africa Portable Chromatography Systems Industry Volume Share (%), by Type 2025 & 2033
- Figure 59: Middle East and Africa Portable Chromatography Systems Industry Revenue (Million), by End-User 2025 & 2033
- Figure 60: Middle East and Africa Portable Chromatography Systems Industry Volume (K Unit), by End-User 2025 & 2033
- Figure 61: Middle East and Africa Portable Chromatography Systems Industry Revenue Share (%), by End-User 2025 & 2033
- Figure 62: Middle East and Africa Portable Chromatography Systems Industry Volume Share (%), by End-User 2025 & 2033
- Figure 63: Middle East and Africa Portable Chromatography Systems Industry Revenue (Million), by Country 2025 & 2033
- Figure 64: Middle East and Africa Portable Chromatography Systems Industry Volume (K Unit), by Country 2025 & 2033
- Figure 65: Middle East and Africa Portable Chromatography Systems Industry Revenue Share (%), by Country 2025 & 2033
- Figure 66: Middle East and Africa Portable Chromatography Systems Industry Volume Share (%), by Country 2025 & 2033
- Figure 67: South America Portable Chromatography Systems Industry Revenue (Million), by Portability 2025 & 2033
- Figure 68: South America Portable Chromatography Systems Industry Volume (K Unit), by Portability 2025 & 2033
- Figure 69: South America Portable Chromatography Systems Industry Revenue Share (%), by Portability 2025 & 2033
- Figure 70: South America Portable Chromatography Systems Industry Volume Share (%), by Portability 2025 & 2033
- Figure 71: South America Portable Chromatography Systems Industry Revenue (Million), by Type 2025 & 2033
- Figure 72: South America Portable Chromatography Systems Industry Volume (K Unit), by Type 2025 & 2033
- Figure 73: South America Portable Chromatography Systems Industry Revenue Share (%), by Type 2025 & 2033
- Figure 74: South America Portable Chromatography Systems Industry Volume Share (%), by Type 2025 & 2033
- Figure 75: South America Portable Chromatography Systems Industry Revenue (Million), by End-User 2025 & 2033
- Figure 76: South America Portable Chromatography Systems Industry Volume (K Unit), by End-User 2025 & 2033
- Figure 77: South America Portable Chromatography Systems Industry Revenue Share (%), by End-User 2025 & 2033
- Figure 78: South America Portable Chromatography Systems Industry Volume Share (%), by End-User 2025 & 2033
- Figure 79: South America Portable Chromatography Systems Industry Revenue (Million), by Country 2025 & 2033
- Figure 80: South America Portable Chromatography Systems Industry Volume (K Unit), by Country 2025 & 2033
- Figure 81: South America Portable Chromatography Systems Industry Revenue Share (%), by Country 2025 & 2033
- Figure 82: South America Portable Chromatography Systems Industry Volume Share (%), by Country 2025 & 2033
List of Tables
- Table 1: Global Portable Chromatography Systems Industry Revenue Million Forecast, by Portability 2020 & 2033
- Table 2: Global Portable Chromatography Systems Industry Volume K Unit Forecast, by Portability 2020 & 2033
- Table 3: Global Portable Chromatography Systems Industry Revenue Million Forecast, by Type 2020 & 2033
- Table 4: Global Portable Chromatography Systems Industry Volume K Unit Forecast, by Type 2020 & 2033
- Table 5: Global Portable Chromatography Systems Industry Revenue Million Forecast, by End-User 2020 & 2033
- Table 6: Global Portable Chromatography Systems Industry Volume K Unit Forecast, by End-User 2020 & 2033
- Table 7: Global Portable Chromatography Systems Industry Revenue Million Forecast, by Region 2020 & 2033
- Table 8: Global Portable Chromatography Systems Industry Volume K Unit Forecast, by Region 2020 & 2033
- Table 9: Global Portable Chromatography Systems Industry Revenue Million Forecast, by Portability 2020 & 2033
- Table 10: Global Portable Chromatography Systems Industry Volume K Unit Forecast, by Portability 2020 & 2033
- Table 11: Global Portable Chromatography Systems Industry Revenue Million Forecast, by Type 2020 & 2033
- Table 12: Global Portable Chromatography Systems Industry Volume K Unit Forecast, by Type 2020 & 2033
- Table 13: Global Portable Chromatography Systems Industry Revenue Million Forecast, by End-User 2020 & 2033
- Table 14: Global Portable Chromatography Systems Industry Volume K Unit Forecast, by End-User 2020 & 2033
- Table 15: Global Portable Chromatography Systems Industry Revenue Million Forecast, by Country 2020 & 2033
- Table 16: Global Portable Chromatography Systems Industry Volume K Unit Forecast, by Country 2020 & 2033
- Table 17: United States Portable Chromatography Systems Industry Revenue (Million) Forecast, by Application 2020 & 2033
- Table 18: United States Portable Chromatography Systems Industry Volume (K Unit) Forecast, by Application 2020 & 2033
- Table 19: Canada Portable Chromatography Systems Industry Revenue (Million) Forecast, by Application 2020 & 2033
- Table 20: Canada Portable Chromatography Systems Industry Volume (K Unit) Forecast, by Application 2020 & 2033
- Table 21: Mexico Portable Chromatography Systems Industry Revenue (Million) Forecast, by Application 2020 & 2033
- Table 22: Mexico Portable Chromatography Systems Industry Volume (K Unit) Forecast, by Application 2020 & 2033
- Table 23: Global Portable Chromatography Systems Industry Revenue Million Forecast, by Portability 2020 & 2033
- Table 24: Global Portable Chromatography Systems Industry Volume K Unit Forecast, by Portability 2020 & 2033
- Table 25: Global Portable Chromatography Systems Industry Revenue Million Forecast, by Type 2020 & 2033
- Table 26: Global Portable Chromatography Systems Industry Volume K Unit Forecast, by Type 2020 & 2033
- Table 27: Global Portable Chromatography Systems Industry Revenue Million Forecast, by End-User 2020 & 2033
- Table 28: Global Portable Chromatography Systems Industry Volume K Unit Forecast, by End-User 2020 & 2033
- Table 29: Global Portable Chromatography Systems Industry Revenue Million Forecast, by Country 2020 & 2033
- Table 30: Global Portable Chromatography Systems Industry Volume K Unit Forecast, by Country 2020 & 2033
- Table 31: Germany Portable Chromatography Systems Industry Revenue (Million) Forecast, by Application 2020 & 2033
- Table 32: Germany Portable Chromatography Systems Industry Volume (K Unit) Forecast, by Application 2020 & 2033
- Table 33: United Kingdom Portable Chromatography Systems Industry Revenue (Million) Forecast, by Application 2020 & 2033
- Table 34: United Kingdom Portable Chromatography Systems Industry Volume (K Unit) Forecast, by Application 2020 & 2033
- Table 35: France Portable Chromatography Systems Industry Revenue (Million) Forecast, by Application 2020 & 2033
- Table 36: France Portable Chromatography Systems Industry Volume (K Unit) Forecast, by Application 2020 & 2033
- Table 37: Italy Portable Chromatography Systems Industry Revenue (Million) Forecast, by Application 2020 & 2033
- Table 38: Italy Portable Chromatography Systems Industry Volume (K Unit) Forecast, by Application 2020 & 2033
- Table 39: Spain Portable Chromatography Systems Industry Revenue (Million) Forecast, by Application 2020 & 2033
- Table 40: Spain Portable Chromatography Systems Industry Volume (K Unit) Forecast, by Application 2020 & 2033
- Table 41: Rest of Europe Portable Chromatography Systems Industry Revenue (Million) Forecast, by Application 2020 & 2033
- Table 42: Rest of Europe Portable Chromatography Systems Industry Volume (K Unit) Forecast, by Application 2020 & 2033
- Table 43: Global Portable Chromatography Systems Industry Revenue Million Forecast, by Portability 2020 & 2033
- Table 44: Global Portable Chromatography Systems Industry Volume K Unit Forecast, by Portability 2020 & 2033
- Table 45: Global Portable Chromatography Systems Industry Revenue Million Forecast, by Type 2020 & 2033
- Table 46: Global Portable Chromatography Systems Industry Volume K Unit Forecast, by Type 2020 & 2033
- Table 47: Global Portable Chromatography Systems Industry Revenue Million Forecast, by End-User 2020 & 2033
- Table 48: Global Portable Chromatography Systems Industry Volume K Unit Forecast, by End-User 2020 & 2033
- Table 49: Global Portable Chromatography Systems Industry Revenue Million Forecast, by Country 2020 & 2033
- Table 50: Global Portable Chromatography Systems Industry Volume K Unit Forecast, by Country 2020 & 2033
- Table 51: China Portable Chromatography Systems Industry Revenue (Million) Forecast, by Application 2020 & 2033
- Table 52: China Portable Chromatography Systems Industry Volume (K Unit) Forecast, by Application 2020 & 2033
- Table 53: Japan Portable Chromatography Systems Industry Revenue (Million) Forecast, by Application 2020 & 2033
- Table 54: Japan Portable Chromatography Systems Industry Volume (K Unit) Forecast, by Application 2020 & 2033
- Table 55: India Portable Chromatography Systems Industry Revenue (Million) Forecast, by Application 2020 & 2033
- Table 56: India Portable Chromatography Systems Industry Volume (K Unit) Forecast, by Application 2020 & 2033
- Table 57: Australia Portable Chromatography Systems Industry Revenue (Million) Forecast, by Application 2020 & 2033
- Table 58: Australia Portable Chromatography Systems Industry Volume (K Unit) Forecast, by Application 2020 & 2033
- Table 59: South Korea Portable Chromatography Systems Industry Revenue (Million) Forecast, by Application 2020 & 2033
- Table 60: South Korea Portable Chromatography Systems Industry Volume (K Unit) Forecast, by Application 2020 & 2033
- Table 61: Rest of Asia Pacific Portable Chromatography Systems Industry Revenue (Million) Forecast, by Application 2020 & 2033
- Table 62: Rest of Asia Pacific Portable Chromatography Systems Industry Volume (K Unit) Forecast, by Application 2020 & 2033
- Table 63: Global Portable Chromatography Systems Industry Revenue Million Forecast, by Portability 2020 & 2033
- Table 64: Global Portable Chromatography Systems Industry Volume K Unit Forecast, by Portability 2020 & 2033
- Table 65: Global Portable Chromatography Systems Industry Revenue Million Forecast, by Type 2020 & 2033
- Table 66: Global Portable Chromatography Systems Industry Volume K Unit Forecast, by Type 2020 & 2033
- Table 67: Global Portable Chromatography Systems Industry Revenue Million Forecast, by End-User 2020 & 2033
- Table 68: Global Portable Chromatography Systems Industry Volume K Unit Forecast, by End-User 2020 & 2033
- Table 69: Global Portable Chromatography Systems Industry Revenue Million Forecast, by Country 2020 & 2033
- Table 70: Global Portable Chromatography Systems Industry Volume K Unit Forecast, by Country 2020 & 2033
- Table 71: GCC Portable Chromatography Systems Industry Revenue (Million) Forecast, by Application 2020 & 2033
- Table 72: GCC Portable Chromatography Systems Industry Volume (K Unit) Forecast, by Application 2020 & 2033
- Table 73: South Africa Portable Chromatography Systems Industry Revenue (Million) Forecast, by Application 2020 & 2033
- Table 74: South Africa Portable Chromatography Systems Industry Volume (K Unit) Forecast, by Application 2020 & 2033
- Table 75: Rest of Middle East and Africa Portable Chromatography Systems Industry Revenue (Million) Forecast, by Application 2020 & 2033
- Table 76: Rest of Middle East and Africa Portable Chromatography Systems Industry Volume (K Unit) Forecast, by Application 2020 & 2033
- Table 77: Global Portable Chromatography Systems Industry Revenue Million Forecast, by Portability 2020 & 2033
- Table 78: Global Portable Chromatography Systems Industry Volume K Unit Forecast, by Portability 2020 & 2033
- Table 79: Global Portable Chromatography Systems Industry Revenue Million Forecast, by Type 2020 & 2033
- Table 80: Global Portable Chromatography Systems Industry Volume K Unit Forecast, by Type 2020 & 2033
- Table 81: Global Portable Chromatography Systems Industry Revenue Million Forecast, by End-User 2020 & 2033
- Table 82: Global Portable Chromatography Systems Industry Volume K Unit Forecast, by End-User 2020 & 2033
- Table 83: Global Portable Chromatography Systems Industry Revenue Million Forecast, by Country 2020 & 2033
- Table 84: Global Portable Chromatography Systems Industry Volume K Unit Forecast, by Country 2020 & 2033
- Table 85: Brazil Portable Chromatography Systems Industry Revenue (Million) Forecast, by Application 2020 & 2033
- Table 86: Brazil Portable Chromatography Systems Industry Volume (K Unit) Forecast, by Application 2020 & 2033
- Table 87: Argentina Portable Chromatography Systems Industry Revenue (Million) Forecast, by Application 2020 & 2033
- Table 88: Argentina Portable Chromatography Systems Industry Volume (K Unit) Forecast, by Application 2020 & 2033
- Table 89: Rest of South America Portable Chromatography Systems Industry Revenue (Million) Forecast, by Application 2020 & 2033
- Table 90: Rest of South America Portable Chromatography Systems Industry Volume (K Unit) Forecast, by Application 2020 & 2033
Frequently Asked Questions
1. What is the projected Compound Annual Growth Rate (CAGR) of the Portable Chromatography Systems Industry?
The projected CAGR is approximately 5.23%.
2. Which companies are prominent players in the Portable Chromatography Systems Industry?
Key companies in the market include Tekmeasure Technologies Pvt Ltd , Sigma Instrument Private Limited, Analytical Technologies Limited, Icon Scientific Inc, Agilent Technologies Inc, PerkinElmer Inc, INFICON, Axcend, FLIR Systems Inc.
3. What are the main segments of the Portable Chromatography Systems Industry?
The market segments include Portability, Type, End-User.
4. Can you provide details about the market size?
The market size is estimated to be USD 563.52 Million as of 2022.
5. What are some drivers contributing to market growth?
; Advancements in Device Technologies; Growing Applications of Portable Chromatography Systems.
6. What are the notable trends driving market growth?
Transportable Chromatography Systems to Grow at a Significant Rate.
7. Are there any restraints impacting market growth?
; High Cost of Portable Chromatography Techniques.
8. Can you provide examples of recent developments in the market?
N/A
9. What pricing options are available for accessing the report?
Pricing options include single-user, multi-user, and enterprise licenses priced at USD 4750, USD 5250, and USD 8750 respectively.
10. Is the market size provided in terms of value or volume?
The market size is provided in terms of value, measured in Million and volume, measured in K Unit.
11. Are there any specific market keywords associated with the report?
Yes, the market keyword associated with the report is "Portable Chromatography Systems Industry," which aids in identifying and referencing the specific market segment covered.
12. How do I determine which pricing option suits my needs best?
The pricing options vary based on user requirements and access needs. Individual users may opt for single-user licenses, while businesses requiring broader access may choose multi-user or enterprise licenses for cost-effective access to the report.
13. Are there any additional resources or data provided in the Portable Chromatography Systems Industry report?
While the report offers comprehensive insights, it's advisable to review the specific contents or supplementary materials provided to ascertain if additional resources or data are available.
14. How can I stay updated on further developments or reports in the Portable Chromatography Systems Industry?
To stay informed about further developments, trends, and reports in the Portable Chromatography Systems Industry, consider subscribing to industry newsletters, following relevant companies and organizations, or regularly checking reputable industry news sources and publications.
Methodology
Step 1 - Identification of Relevant Samples Size from Population Database


Step 2 - Approaches for Defining Global Market Size (Value, Volume* & Price*)

Note*: In applicable scenarios
Step 3 - Data Sources
Primary Research
- Web Analytics
- Survey Reports
- Research Institute
- Latest Research Reports
- Opinion Leaders
Secondary Research
- Annual Reports
- White Paper
- Latest Press Release
- Industry Association
- Paid Database
- Investor Presentations

Step 4 - Data Triangulation
Involves using different sources of information in order to increase the validity of a study
These sources are likely to be stakeholders in a program - participants, other researchers, program staff, other community members, and so on.
Then we put all data in single framework & apply various statistical tools to find out the dynamic on the market.
During the analysis stage, feedback from the stakeholder groups would be compared to determine areas of agreement as well as areas of divergence

