

Key Insights
The Phthalic Anhydride Derivatives market is projected for substantial growth, with an estimated Compound Annual Growth Rate (CAGR) of 6.6% from 2024 to 2033. This expansion is driven by escalating demand across key sectors, notably construction and automotive. The construction industry's adoption of unsaturated polyester resins for fiberglass-reinforced plastics in infrastructure and housing is a primary growth catalyst. Concurrently, the automotive sector's utilization of alkyd resins in coatings and plasticizers for various components significantly boosts demand. Key market trends include technological innovations yielding enhanced resin formulations with superior durability and performance. However, the market faces challenges from stringent environmental regulations concerning volatile organic compounds (VOCs) and fluctuating raw material prices. The market is segmented by derivatives, including unsaturated polyester resins, alkyd resins, plasticizers, and others, and by end-user industries such as construction, automotive, electrical & electronics, aerospace, and others. Leading players like BASF SE, LANXESS, and Stepan Company are actively pursuing innovation and strategic partnerships to strengthen their market positions. The Asia-Pacific region, particularly China and India, offers significant growth potential due to rapid infrastructure development and industrialization. North America and Europe, established markets, continue to contribute substantially to overall revenue, supported by consistent demand from mature industries.
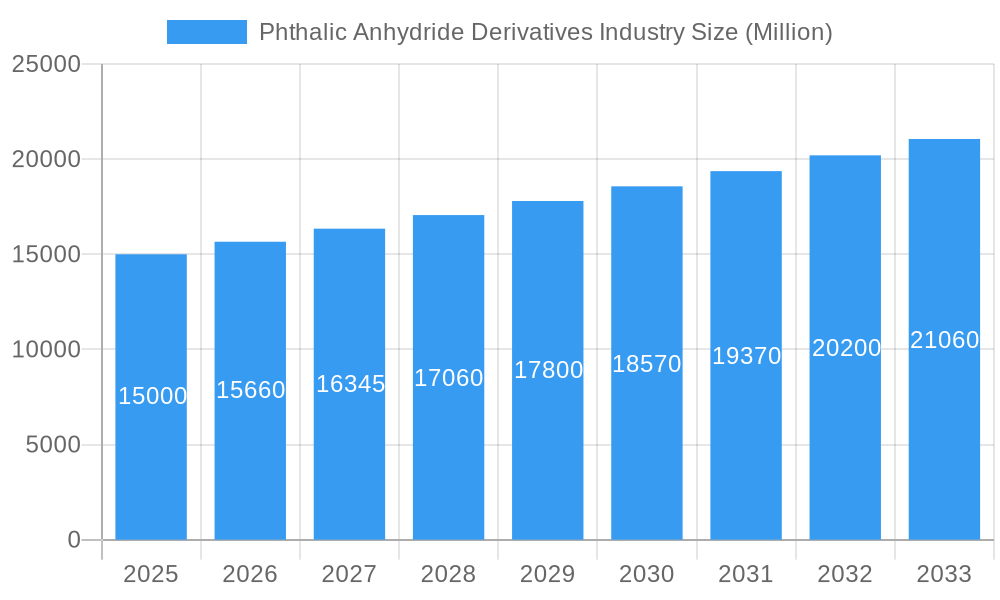
Phthalic Anhydride Derivatives Industry Market Size (In Billion)
The market's future trajectory depends on effectively addressing environmental concerns and raw material price volatility. Industry players are investing in sustainable manufacturing processes and exploring bio-based alternatives to minimize their environmental impact. The increasing demand for lightweight materials in automotive and aerospace applications presents considerable opportunities for phthalic anhydride derivatives in high-performance products. Furthermore, the growth of the electronics sector, especially in emerging economies, is expected to positively influence demand for phthalic anhydride derivatives in specialized coatings and insulation. The competitive landscape will likely be shaped by strategic mergers, acquisitions, and the development of new product lines tailored to specific end-user requirements. Consequently, the market is well-positioned for continued expansion, propelled by industrial growth, technological advancements, and strategic initiatives from major stakeholders.
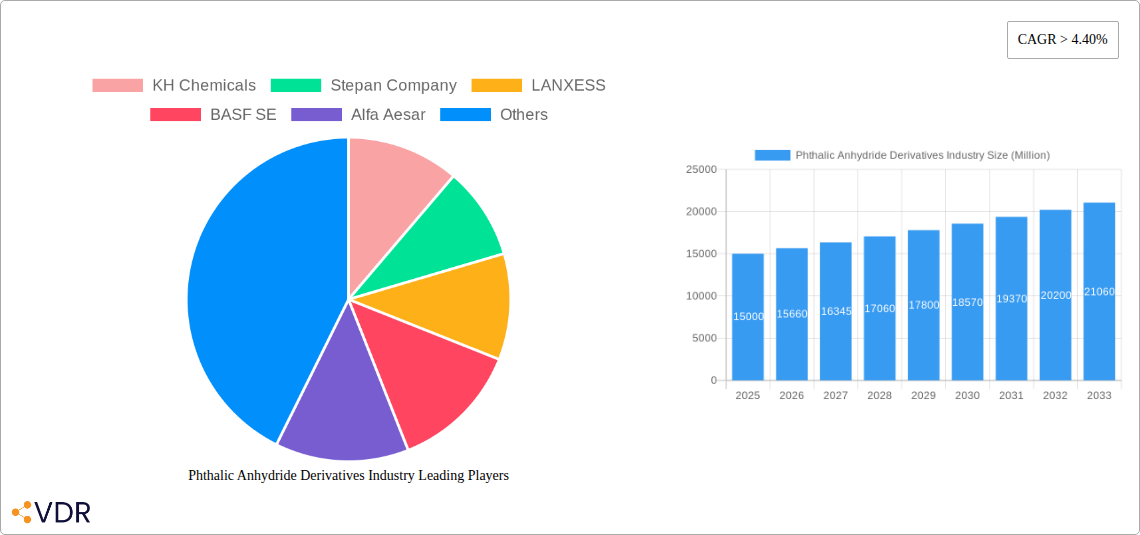
Phthalic Anhydride Derivatives Industry Company Market Share
Phthalic Anhydride Derivatives Industry Market Report: 2019-2033
This comprehensive report provides an in-depth analysis of the Phthalic Anhydride Derivatives market, encompassing market dynamics, growth trends, regional analysis, product landscape, key players, and future outlook. The report covers the period from 2019 to 2033, with 2025 as the base year and a forecast period from 2025 to 2033. The analysis is segmented by derivatives (Unsaturated Polyester Resins, Alkyd Resin, Plasticizer, Other) and end-user industries (Construction, Automotive, Electrical and Electronics, Aerospace, Others). This report is invaluable for industry professionals, investors, and strategic planners seeking a thorough understanding of this dynamic market.
Phthalic Anhydride Derivatives Industry Market Dynamics & Structure
The Phthalic Anhydride Derivatives market is characterized by moderate concentration, with key players like BASF SE and LANXESS holding significant market share. Technological innovation, particularly in sustainable and high-performance derivatives, is a key driver. Stringent environmental regulations regarding VOC emissions and hazardous waste disposal are shaping industry practices. Competition from alternative materials, such as bio-based resins, presents a challenge. M&A activity has been relatively modest in recent years, with a total of xx deals valued at approximately xx Million in the period 2019-2024. Shifting end-user demographics towards sustainable construction and electric vehicles is influencing demand.
- Market Concentration: Moderately concentrated, with top 5 players holding approximately 60% market share in 2024.
- Technological Innovation: Focus on bio-based alternatives and improved performance characteristics.
- Regulatory Framework: Stringent environmental regulations impacting production and disposal.
- Competitive Substitutes: Bio-based resins and other polymer materials posing a competitive threat.
- End-User Demographics: Growth driven by construction, automotive, and electronics sectors.
- M&A Trends: xx deals valued at approximately xx Million in 2019-2024, indicating consolidation potential.
Phthalic Anhydride Derivatives Industry Growth Trends & Insights
The global Phthalic Anhydride Derivatives market experienced a Compound Annual Growth Rate (CAGR) of xx% during the historical period (2019-2024), reaching a market size of xx Million in 2024. This growth is primarily attributed to the increasing demand from the construction and automotive industries. Technological advancements, such as the development of high-performance resins with enhanced durability and sustainability, have further fueled market expansion. Consumer preference for environmentally friendly products is driving demand for bio-based derivatives. The forecast period (2025-2033) projects a CAGR of xx%, driven by factors such as infrastructure development in emerging economies and the rise of electric vehicles. Market penetration in developing countries is expected to increase significantly during this period, reaching xx% by 2033.
Dominant Regions, Countries, or Segments in Phthalic Anhydride Derivatives Industry
The Asia-Pacific region dominates the Phthalic Anhydride Derivatives market, driven by robust construction activity and a rapidly growing automotive sector. China and India are the key contributors within this region. Within the derivatives segment, Unsaturated Polyester Resins holds the largest market share, owing to its extensive use in construction and infrastructure projects. The Automotive end-user segment exhibits the highest growth potential due to the increasing demand for lightweight and fuel-efficient vehicles.
- Key Drivers (Asia-Pacific): Strong economic growth, rapid urbanization, and infrastructure development.
- Dominance Factors (Unsaturated Polyester Resins): Wide application in construction, cost-effectiveness, and established supply chains.
- Growth Potential (Automotive): Rising demand for lightweight and durable automotive parts.
- Europe & North America: Mature markets with steady growth driven by technological advancements and replacement demand.
Phthalic Anhydride Derivatives Industry Product Landscape
The Phthalic Anhydride Derivatives market showcases continuous product innovation, focusing on enhancing performance characteristics such as durability, flexibility, and thermal stability. New formulations incorporate additives to improve processability and reduce environmental impact. Key innovations include bio-based derivatives offering sustainable alternatives to traditional products. These advancements cater to various applications across construction, automotive, and electronics industries, offering enhanced properties such as UV resistance, flame retardancy, and improved chemical resistance.
Key Drivers, Barriers & Challenges in Phthalic Anhydride Derivatives Industry
Key Drivers: Growing construction and automotive sectors, technological advancements leading to improved product performance, increasing demand for sustainable materials.
Challenges & Restraints: Fluctuating raw material prices, stringent environmental regulations, competition from substitute materials (impact on market share: estimated xx% by 2033), and supply chain disruptions.
Emerging Opportunities in Phthalic Anhydride Derivatives Industry
Emerging opportunities lie in the development and application of bio-based Phthalic Anhydride Derivatives, catering to the growing demand for sustainable and environmentally friendly materials. Untapped markets in developing economies present significant growth potential. Further innovations in high-performance derivatives tailored for specialized applications within the aerospace and electronics industries are likely to open new avenues for growth.
Growth Accelerators in the Phthalic Anhydride Derivatives Industry Industry
Long-term growth in the Phthalic Anhydride Derivatives market will be accelerated by technological advancements, including the development of high-performance, bio-based alternatives. Strategic partnerships and collaborations between manufacturers and end-users will further drive market expansion. Expansion into emerging markets and diversification into new applications, such as in renewable energy technologies, will also contribute to sustainable growth.
Key Players Shaping the Phthalic Anhydride Derivatives Industry Market
- KH Chemicals
- Stepan Company
- LANXESS
- BASF SE
- Alfa Aesar
- PENPET Petrochemical Trading GmbH
- JFE Chemical Corporation
- I G Petrochemicals Ltd
- Polynt SpA
- Thirumalai Chemicals Ltd
- Tokyo Chemical Industry
- S I Group Inc
- Koppers Inc
- Perstorp
- The Chemical Company
Notable Milestones in Phthalic Anhydride Derivatives Industry Sector
- 2020: BASF SE launched a new range of sustainable phthalate-free plasticizers.
- 2022: A significant merger between two key players resulted in increased market consolidation. (Specific details not available; xx).
- 2023: New regulatory standards for VOC emissions were implemented in several key markets.
In-Depth Phthalic Anhydride Derivatives Industry Market Outlook
The future of the Phthalic Anhydride Derivatives market is promising, driven by sustained growth in key end-user industries, technological advancements towards sustainable and high-performance products, and expansion into new markets. Strategic partnerships and investments in research and development will play a crucial role in shaping the market landscape. The market is expected to experience continued growth, with opportunities for innovation and expansion particularly promising in the Asia-Pacific region.
Phthalic Anhydride Derivatives Industry Segmentation
-
1. Derivatives
- 1.1. Unsaturated Polyester Resins
- 1.2. Alkyd Resin
- 1.3. Plasticizer
- 1.4. Other
-
2. End-user Industry
- 2.1. Construction
- 2.2. Automotive
- 2.3. Electrical and Electronics
- 2.4. Aerospace
- 2.5. Others
Phthalic Anhydride Derivatives Industry Segmentation By Geography
-
1. Asia Pacific
- 1.1. China
- 1.2. India
- 1.3. Japan
- 1.4. South Korea
- 1.5. Rest of Asia Pacific
-
2. North America
- 2.1. United States
- 2.2. Canada
- 2.3. Mexico
-
3. Europe
- 3.1. Germany
- 3.2. United Kingdom
- 3.3. France
- 3.4. Italy
- 3.5. Rest of Europe
-
4. South America
- 4.1. Brazil
- 4.2. Argentina
- 4.3. Rest of South America
-
5. Middle East and Africa
- 5.1. Saudi Arabia
- 5.2. South Africa
- 5.3. Rest of Middle East and Africa
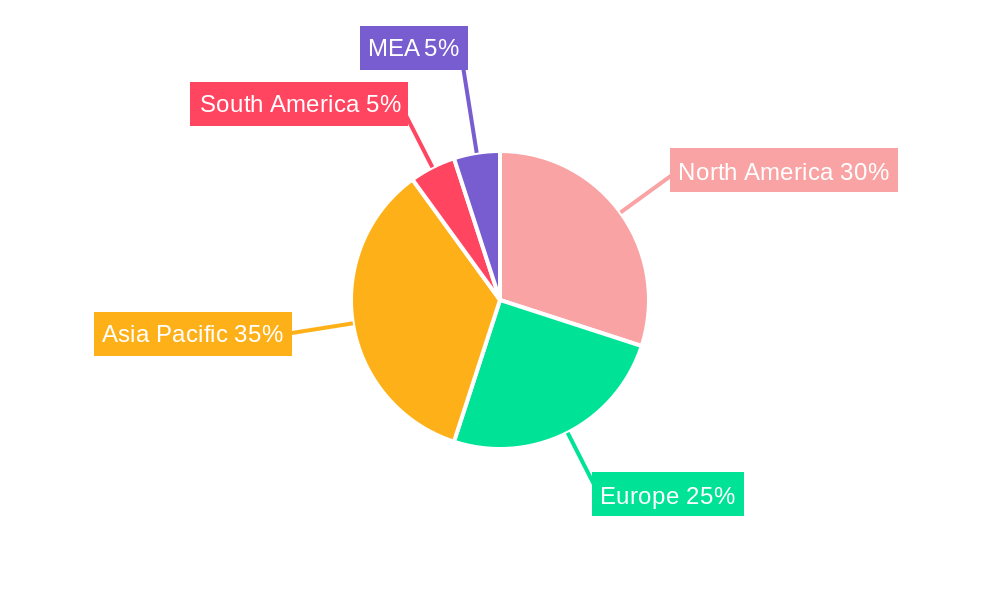
Phthalic Anhydride Derivatives Industry Regional Market Share
Geographic Coverage of Phthalic Anhydride Derivatives Industry
Phthalic Anhydride Derivatives Industry REPORT HIGHLIGHTS
| Aspects | Details |
|---|---|
| Study Period | 2020-2034 |
| Base Year | 2025 |
| Estimated Year | 2026 |
| Forecast Period | 2026-2034 |
| Historical Period | 2020-2025 |
| Growth Rate | CAGR of 6.6% from 2020-2034 |
| Segmentation |
|
Table of Contents
- 1. Introduction
- 1.1. Research Scope
- 1.2. Market Segmentation
- 1.3. Research Objective
- 1.4. Definitions and Assumptions
- 2. Executive Summary
- 2.1. Market Snapshot
- 3. Market Dynamics
- 3.1. Market Drivers
- 3.2. Market Restrains
- 3.3. Market Trends
- 3.4. Market Opportunities
- 4. Market Factor Analysis
- 4.1. Porters Five Forces
- 4.1.1. Bargaining Power of Suppliers
- 4.1.2. Bargaining Power of Buyers
- 4.1.3. Threat of New Entrants
- 4.1.4. Threat of Substitutes
- 4.1.5. Competitive Rivalry
- 4.2. PESTEL analysis
- 4.3. BCG Analysis
- 4.3.1. Stars (High Growth, High Market Share)
- 4.3.2. Cash Cows (Low Growth, High Market Share)
- 4.3.3. Question Mark (High Growth, Low Market Share)
- 4.3.4. Dogs (Low Growth, Low Market Share)
- 4.4. Ansoff Matrix Analysis
- 4.5. Supply Chain Analysis
- 4.6. Regulatory Landscape
- 4.7. Current Market Potential and Opportunity Assessment (TAM–SAM–SOM Framework)
- 4.8. VDR Analyst Note
- 4.1. Porters Five Forces
- 5. Market Analysis, Insights and Forecast 2021-2033
- 5.1. Market Analysis, Insights and Forecast - by Derivatives
- 5.1.1. Unsaturated Polyester Resins
- 5.1.2. Alkyd Resin
- 5.1.3. Plasticizer
- 5.1.4. Other
- 5.2. Market Analysis, Insights and Forecast - by End-user Industry
- 5.2.1. Construction
- 5.2.2. Automotive
- 5.2.3. Electrical and Electronics
- 5.2.4. Aerospace
- 5.2.5. Others
- 5.3. Market Analysis, Insights and Forecast - by Region
- 5.3.1. Asia Pacific
- 5.3.2. North America
- 5.3.3. Europe
- 5.3.4. South America
- 5.3.5. Middle East and Africa
- 5.1. Market Analysis, Insights and Forecast - by Derivatives
- 6. Global Phthalic Anhydride Derivatives Industry Analysis, Insights and Forecast, 2021-2033
- 6.1. Market Analysis, Insights and Forecast - by Derivatives
- 6.1.1. Unsaturated Polyester Resins
- 6.1.2. Alkyd Resin
- 6.1.3. Plasticizer
- 6.1.4. Other
- 6.2. Market Analysis, Insights and Forecast - by End-user Industry
- 6.2.1. Construction
- 6.2.2. Automotive
- 6.2.3. Electrical and Electronics
- 6.2.4. Aerospace
- 6.2.5. Others
- 6.1. Market Analysis, Insights and Forecast - by Derivatives
- 7. Asia Pacific Phthalic Anhydride Derivatives Industry Analysis, Insights and Forecast, 2021-2033
- 7.1. Market Analysis, Insights and Forecast - by Derivatives
- 7.1.1. Unsaturated Polyester Resins
- 7.1.2. Alkyd Resin
- 7.1.3. Plasticizer
- 7.1.4. Other
- 7.2. Market Analysis, Insights and Forecast - by End-user Industry
- 7.2.1. Construction
- 7.2.2. Automotive
- 7.2.3. Electrical and Electronics
- 7.2.4. Aerospace
- 7.2.5. Others
- 7.1. Market Analysis, Insights and Forecast - by Derivatives
- 8. North America Phthalic Anhydride Derivatives Industry Analysis, Insights and Forecast, 2021-2033
- 8.1. Market Analysis, Insights and Forecast - by Derivatives
- 8.1.1. Unsaturated Polyester Resins
- 8.1.2. Alkyd Resin
- 8.1.3. Plasticizer
- 8.1.4. Other
- 8.2. Market Analysis, Insights and Forecast - by End-user Industry
- 8.2.1. Construction
- 8.2.2. Automotive
- 8.2.3. Electrical and Electronics
- 8.2.4. Aerospace
- 8.2.5. Others
- 8.1. Market Analysis, Insights and Forecast - by Derivatives
- 9. Europe Phthalic Anhydride Derivatives Industry Analysis, Insights and Forecast, 2021-2033
- 9.1. Market Analysis, Insights and Forecast - by Derivatives
- 9.1.1. Unsaturated Polyester Resins
- 9.1.2. Alkyd Resin
- 9.1.3. Plasticizer
- 9.1.4. Other
- 9.2. Market Analysis, Insights and Forecast - by End-user Industry
- 9.2.1. Construction
- 9.2.2. Automotive
- 9.2.3. Electrical and Electronics
- 9.2.4. Aerospace
- 9.2.5. Others
- 9.1. Market Analysis, Insights and Forecast - by Derivatives
- 10. South America Phthalic Anhydride Derivatives Industry Analysis, Insights and Forecast, 2021-2033
- 10.1. Market Analysis, Insights and Forecast - by Derivatives
- 10.1.1. Unsaturated Polyester Resins
- 10.1.2. Alkyd Resin
- 10.1.3. Plasticizer
- 10.1.4. Other
- 10.2. Market Analysis, Insights and Forecast - by End-user Industry
- 10.2.1. Construction
- 10.2.2. Automotive
- 10.2.3. Electrical and Electronics
- 10.2.4. Aerospace
- 10.2.5. Others
- 10.1. Market Analysis, Insights and Forecast - by Derivatives
- 11. Middle East and Africa Phthalic Anhydride Derivatives Industry Analysis, Insights and Forecast, 2021-2033
- 11.1. Market Analysis, Insights and Forecast - by Derivatives
- 11.1.1. Unsaturated Polyester Resins
- 11.1.2. Alkyd Resin
- 11.1.3. Plasticizer
- 11.1.4. Other
- 11.2. Market Analysis, Insights and Forecast - by End-user Industry
- 11.2.1. Construction
- 11.2.2. Automotive
- 11.2.3. Electrical and Electronics
- 11.2.4. Aerospace
- 11.2.5. Others
- 11.1. Market Analysis, Insights and Forecast - by Derivatives
- 12. Competitive Analysis
- 12.1. Company Profiles
- 12.1.1 KH Chemicals
- 12.1.1.1. Company Overview
- 12.1.1.2. Products
- 12.1.1.3. Company Financials
- 12.1.1.4. SWOT Analysis
- 12.1.2 Stepan Company
- 12.1.2.1. Company Overview
- 12.1.2.2. Products
- 12.1.2.3. Company Financials
- 12.1.2.4. SWOT Analysis
- 12.1.3 LANXESS
- 12.1.3.1. Company Overview
- 12.1.3.2. Products
- 12.1.3.3. Company Financials
- 12.1.3.4. SWOT Analysis
- 12.1.4 BASF SE
- 12.1.4.1. Company Overview
- 12.1.4.2. Products
- 12.1.4.3. Company Financials
- 12.1.4.4. SWOT Analysis
- 12.1.5 Alfa Aesar
- 12.1.5.1. Company Overview
- 12.1.5.2. Products
- 12.1.5.3. Company Financials
- 12.1.5.4. SWOT Analysis
- 12.1.6 PENPET Petrochemical Trading GmbH
- 12.1.6.1. Company Overview
- 12.1.6.2. Products
- 12.1.6.3. Company Financials
- 12.1.6.4. SWOT Analysis
- 12.1.7 JFE Chemical Corporation
- 12.1.7.1. Company Overview
- 12.1.7.2. Products
- 12.1.7.3. Company Financials
- 12.1.7.4. SWOT Analysis
- 12.1.8 I G Petrochemicals Ltd
- 12.1.8.1. Company Overview
- 12.1.8.2. Products
- 12.1.8.3. Company Financials
- 12.1.8.4. SWOT Analysis
- 12.1.9 Polynt SpA
- 12.1.9.1. Company Overview
- 12.1.9.2. Products
- 12.1.9.3. Company Financials
- 12.1.9.4. SWOT Analysis
- 12.1.10 Thirumalai Chemicals Ltd
- 12.1.10.1. Company Overview
- 12.1.10.2. Products
- 12.1.10.3. Company Financials
- 12.1.10.4. SWOT Analysis
- 12.1.11 Tokyo Chemical Industry
- 12.1.11.1. Company Overview
- 12.1.11.2. Products
- 12.1.11.3. Company Financials
- 12.1.11.4. SWOT Analysis
- 12.1.12 S I Group Inc
- 12.1.12.1. Company Overview
- 12.1.12.2. Products
- 12.1.12.3. Company Financials
- 12.1.12.4. SWOT Analysis
- 12.1.13 Koppers Inc
- 12.1.13.1. Company Overview
- 12.1.13.2. Products
- 12.1.13.3. Company Financials
- 12.1.13.4. SWOT Analysis
- 12.1.14 Perstorp
- 12.1.14.1. Company Overview
- 12.1.14.2. Products
- 12.1.14.3. Company Financials
- 12.1.14.4. SWOT Analysis
- 12.1.15 The Chemical Company
- 12.1.15.1. Company Overview
- 12.1.15.2. Products
- 12.1.15.3. Company Financials
- 12.1.15.4. SWOT Analysis
- 12.1.1 KH Chemicals
- 12.2. Market Entropy
- 12.2.1 Company's Key Areas Served
- 12.2.2 Recent Developments
- 12.3. Company Market Share Analysis 2025
- 12.3.1 Top 5 Companies Market Share Analysis
- 12.3.2 Top 3 Companies Market Share Analysis
- 12.4. List of Potential Customers
- 13. Research Methodology
List of Figures
- Figure 1: Global Phthalic Anhydride Derivatives Industry Revenue Breakdown (billion, %) by Region 2025 & 2033
- Figure 2: Global Phthalic Anhydride Derivatives Industry Volume Breakdown (K Tons, %) by Region 2025 & 2033
- Figure 3: Asia Pacific Phthalic Anhydride Derivatives Industry Revenue (billion), by Derivatives 2025 & 2033
- Figure 4: Asia Pacific Phthalic Anhydride Derivatives Industry Volume (K Tons), by Derivatives 2025 & 2033
- Figure 5: Asia Pacific Phthalic Anhydride Derivatives Industry Revenue Share (%), by Derivatives 2025 & 2033
- Figure 6: Asia Pacific Phthalic Anhydride Derivatives Industry Volume Share (%), by Derivatives 2025 & 2033
- Figure 7: Asia Pacific Phthalic Anhydride Derivatives Industry Revenue (billion), by End-user Industry 2025 & 2033
- Figure 8: Asia Pacific Phthalic Anhydride Derivatives Industry Volume (K Tons), by End-user Industry 2025 & 2033
- Figure 9: Asia Pacific Phthalic Anhydride Derivatives Industry Revenue Share (%), by End-user Industry 2025 & 2033
- Figure 10: Asia Pacific Phthalic Anhydride Derivatives Industry Volume Share (%), by End-user Industry 2025 & 2033
- Figure 11: Asia Pacific Phthalic Anhydride Derivatives Industry Revenue (billion), by Country 2025 & 2033
- Figure 12: Asia Pacific Phthalic Anhydride Derivatives Industry Volume (K Tons), by Country 2025 & 2033
- Figure 13: Asia Pacific Phthalic Anhydride Derivatives Industry Revenue Share (%), by Country 2025 & 2033
- Figure 14: Asia Pacific Phthalic Anhydride Derivatives Industry Volume Share (%), by Country 2025 & 2033
- Figure 15: North America Phthalic Anhydride Derivatives Industry Revenue (billion), by Derivatives 2025 & 2033
- Figure 16: North America Phthalic Anhydride Derivatives Industry Volume (K Tons), by Derivatives 2025 & 2033
- Figure 17: North America Phthalic Anhydride Derivatives Industry Revenue Share (%), by Derivatives 2025 & 2033
- Figure 18: North America Phthalic Anhydride Derivatives Industry Volume Share (%), by Derivatives 2025 & 2033
- Figure 19: North America Phthalic Anhydride Derivatives Industry Revenue (billion), by End-user Industry 2025 & 2033
- Figure 20: North America Phthalic Anhydride Derivatives Industry Volume (K Tons), by End-user Industry 2025 & 2033
- Figure 21: North America Phthalic Anhydride Derivatives Industry Revenue Share (%), by End-user Industry 2025 & 2033
- Figure 22: North America Phthalic Anhydride Derivatives Industry Volume Share (%), by End-user Industry 2025 & 2033
- Figure 23: North America Phthalic Anhydride Derivatives Industry Revenue (billion), by Country 2025 & 2033
- Figure 24: North America Phthalic Anhydride Derivatives Industry Volume (K Tons), by Country 2025 & 2033
- Figure 25: North America Phthalic Anhydride Derivatives Industry Revenue Share (%), by Country 2025 & 2033
- Figure 26: North America Phthalic Anhydride Derivatives Industry Volume Share (%), by Country 2025 & 2033
- Figure 27: Europe Phthalic Anhydride Derivatives Industry Revenue (billion), by Derivatives 2025 & 2033
- Figure 28: Europe Phthalic Anhydride Derivatives Industry Volume (K Tons), by Derivatives 2025 & 2033
- Figure 29: Europe Phthalic Anhydride Derivatives Industry Revenue Share (%), by Derivatives 2025 & 2033
- Figure 30: Europe Phthalic Anhydride Derivatives Industry Volume Share (%), by Derivatives 2025 & 2033
- Figure 31: Europe Phthalic Anhydride Derivatives Industry Revenue (billion), by End-user Industry 2025 & 2033
- Figure 32: Europe Phthalic Anhydride Derivatives Industry Volume (K Tons), by End-user Industry 2025 & 2033
- Figure 33: Europe Phthalic Anhydride Derivatives Industry Revenue Share (%), by End-user Industry 2025 & 2033
- Figure 34: Europe Phthalic Anhydride Derivatives Industry Volume Share (%), by End-user Industry 2025 & 2033
- Figure 35: Europe Phthalic Anhydride Derivatives Industry Revenue (billion), by Country 2025 & 2033
- Figure 36: Europe Phthalic Anhydride Derivatives Industry Volume (K Tons), by Country 2025 & 2033
- Figure 37: Europe Phthalic Anhydride Derivatives Industry Revenue Share (%), by Country 2025 & 2033
- Figure 38: Europe Phthalic Anhydride Derivatives Industry Volume Share (%), by Country 2025 & 2033
- Figure 39: South America Phthalic Anhydride Derivatives Industry Revenue (billion), by Derivatives 2025 & 2033
- Figure 40: South America Phthalic Anhydride Derivatives Industry Volume (K Tons), by Derivatives 2025 & 2033
- Figure 41: South America Phthalic Anhydride Derivatives Industry Revenue Share (%), by Derivatives 2025 & 2033
- Figure 42: South America Phthalic Anhydride Derivatives Industry Volume Share (%), by Derivatives 2025 & 2033
- Figure 43: South America Phthalic Anhydride Derivatives Industry Revenue (billion), by End-user Industry 2025 & 2033
- Figure 44: South America Phthalic Anhydride Derivatives Industry Volume (K Tons), by End-user Industry 2025 & 2033
- Figure 45: South America Phthalic Anhydride Derivatives Industry Revenue Share (%), by End-user Industry 2025 & 2033
- Figure 46: South America Phthalic Anhydride Derivatives Industry Volume Share (%), by End-user Industry 2025 & 2033
- Figure 47: South America Phthalic Anhydride Derivatives Industry Revenue (billion), by Country 2025 & 2033
- Figure 48: South America Phthalic Anhydride Derivatives Industry Volume (K Tons), by Country 2025 & 2033
- Figure 49: South America Phthalic Anhydride Derivatives Industry Revenue Share (%), by Country 2025 & 2033
- Figure 50: South America Phthalic Anhydride Derivatives Industry Volume Share (%), by Country 2025 & 2033
- Figure 51: Middle East and Africa Phthalic Anhydride Derivatives Industry Revenue (billion), by Derivatives 2025 & 2033
- Figure 52: Middle East and Africa Phthalic Anhydride Derivatives Industry Volume (K Tons), by Derivatives 2025 & 2033
- Figure 53: Middle East and Africa Phthalic Anhydride Derivatives Industry Revenue Share (%), by Derivatives 2025 & 2033
- Figure 54: Middle East and Africa Phthalic Anhydride Derivatives Industry Volume Share (%), by Derivatives 2025 & 2033
- Figure 55: Middle East and Africa Phthalic Anhydride Derivatives Industry Revenue (billion), by End-user Industry 2025 & 2033
- Figure 56: Middle East and Africa Phthalic Anhydride Derivatives Industry Volume (K Tons), by End-user Industry 2025 & 2033
- Figure 57: Middle East and Africa Phthalic Anhydride Derivatives Industry Revenue Share (%), by End-user Industry 2025 & 2033
- Figure 58: Middle East and Africa Phthalic Anhydride Derivatives Industry Volume Share (%), by End-user Industry 2025 & 2033
- Figure 59: Middle East and Africa Phthalic Anhydride Derivatives Industry Revenue (billion), by Country 2025 & 2033
- Figure 60: Middle East and Africa Phthalic Anhydride Derivatives Industry Volume (K Tons), by Country 2025 & 2033
- Figure 61: Middle East and Africa Phthalic Anhydride Derivatives Industry Revenue Share (%), by Country 2025 & 2033
- Figure 62: Middle East and Africa Phthalic Anhydride Derivatives Industry Volume Share (%), by Country 2025 & 2033
List of Tables
- Table 1: Global Phthalic Anhydride Derivatives Industry Revenue billion Forecast, by Derivatives 2020 & 2033
- Table 2: Global Phthalic Anhydride Derivatives Industry Volume K Tons Forecast, by Derivatives 2020 & 2033
- Table 3: Global Phthalic Anhydride Derivatives Industry Revenue billion Forecast, by End-user Industry 2020 & 2033
- Table 4: Global Phthalic Anhydride Derivatives Industry Volume K Tons Forecast, by End-user Industry 2020 & 2033
- Table 5: Global Phthalic Anhydride Derivatives Industry Revenue billion Forecast, by Region 2020 & 2033
- Table 6: Global Phthalic Anhydride Derivatives Industry Volume K Tons Forecast, by Region 2020 & 2033
- Table 7: Global Phthalic Anhydride Derivatives Industry Revenue billion Forecast, by Derivatives 2020 & 2033
- Table 8: Global Phthalic Anhydride Derivatives Industry Volume K Tons Forecast, by Derivatives 2020 & 2033
- Table 9: Global Phthalic Anhydride Derivatives Industry Revenue billion Forecast, by End-user Industry 2020 & 2033
- Table 10: Global Phthalic Anhydride Derivatives Industry Volume K Tons Forecast, by End-user Industry 2020 & 2033
- Table 11: Global Phthalic Anhydride Derivatives Industry Revenue billion Forecast, by Country 2020 & 2033
- Table 12: Global Phthalic Anhydride Derivatives Industry Volume K Tons Forecast, by Country 2020 & 2033
- Table 13: China Phthalic Anhydride Derivatives Industry Revenue (billion) Forecast, by Application 2020 & 2033
- Table 14: China Phthalic Anhydride Derivatives Industry Volume (K Tons) Forecast, by Application 2020 & 2033
- Table 15: India Phthalic Anhydride Derivatives Industry Revenue (billion) Forecast, by Application 2020 & 2033
- Table 16: India Phthalic Anhydride Derivatives Industry Volume (K Tons) Forecast, by Application 2020 & 2033
- Table 17: Japan Phthalic Anhydride Derivatives Industry Revenue (billion) Forecast, by Application 2020 & 2033
- Table 18: Japan Phthalic Anhydride Derivatives Industry Volume (K Tons) Forecast, by Application 2020 & 2033
- Table 19: South Korea Phthalic Anhydride Derivatives Industry Revenue (billion) Forecast, by Application 2020 & 2033
- Table 20: South Korea Phthalic Anhydride Derivatives Industry Volume (K Tons) Forecast, by Application 2020 & 2033
- Table 21: Rest of Asia Pacific Phthalic Anhydride Derivatives Industry Revenue (billion) Forecast, by Application 2020 & 2033
- Table 22: Rest of Asia Pacific Phthalic Anhydride Derivatives Industry Volume (K Tons) Forecast, by Application 2020 & 2033
- Table 23: Global Phthalic Anhydride Derivatives Industry Revenue billion Forecast, by Derivatives 2020 & 2033
- Table 24: Global Phthalic Anhydride Derivatives Industry Volume K Tons Forecast, by Derivatives 2020 & 2033
- Table 25: Global Phthalic Anhydride Derivatives Industry Revenue billion Forecast, by End-user Industry 2020 & 2033
- Table 26: Global Phthalic Anhydride Derivatives Industry Volume K Tons Forecast, by End-user Industry 2020 & 2033
- Table 27: Global Phthalic Anhydride Derivatives Industry Revenue billion Forecast, by Country 2020 & 2033
- Table 28: Global Phthalic Anhydride Derivatives Industry Volume K Tons Forecast, by Country 2020 & 2033
- Table 29: United States Phthalic Anhydride Derivatives Industry Revenue (billion) Forecast, by Application 2020 & 2033
- Table 30: United States Phthalic Anhydride Derivatives Industry Volume (K Tons) Forecast, by Application 2020 & 2033
- Table 31: Canada Phthalic Anhydride Derivatives Industry Revenue (billion) Forecast, by Application 2020 & 2033
- Table 32: Canada Phthalic Anhydride Derivatives Industry Volume (K Tons) Forecast, by Application 2020 & 2033
- Table 33: Mexico Phthalic Anhydride Derivatives Industry Revenue (billion) Forecast, by Application 2020 & 2033
- Table 34: Mexico Phthalic Anhydride Derivatives Industry Volume (K Tons) Forecast, by Application 2020 & 2033
- Table 35: Global Phthalic Anhydride Derivatives Industry Revenue billion Forecast, by Derivatives 2020 & 2033
- Table 36: Global Phthalic Anhydride Derivatives Industry Volume K Tons Forecast, by Derivatives 2020 & 2033
- Table 37: Global Phthalic Anhydride Derivatives Industry Revenue billion Forecast, by End-user Industry 2020 & 2033
- Table 38: Global Phthalic Anhydride Derivatives Industry Volume K Tons Forecast, by End-user Industry 2020 & 2033
- Table 39: Global Phthalic Anhydride Derivatives Industry Revenue billion Forecast, by Country 2020 & 2033
- Table 40: Global Phthalic Anhydride Derivatives Industry Volume K Tons Forecast, by Country 2020 & 2033
- Table 41: Germany Phthalic Anhydride Derivatives Industry Revenue (billion) Forecast, by Application 2020 & 2033
- Table 42: Germany Phthalic Anhydride Derivatives Industry Volume (K Tons) Forecast, by Application 2020 & 2033
- Table 43: United Kingdom Phthalic Anhydride Derivatives Industry Revenue (billion) Forecast, by Application 2020 & 2033
- Table 44: United Kingdom Phthalic Anhydride Derivatives Industry Volume (K Tons) Forecast, by Application 2020 & 2033
- Table 45: France Phthalic Anhydride Derivatives Industry Revenue (billion) Forecast, by Application 2020 & 2033
- Table 46: France Phthalic Anhydride Derivatives Industry Volume (K Tons) Forecast, by Application 2020 & 2033
- Table 47: Italy Phthalic Anhydride Derivatives Industry Revenue (billion) Forecast, by Application 2020 & 2033
- Table 48: Italy Phthalic Anhydride Derivatives Industry Volume (K Tons) Forecast, by Application 2020 & 2033
- Table 49: Rest of Europe Phthalic Anhydride Derivatives Industry Revenue (billion) Forecast, by Application 2020 & 2033
- Table 50: Rest of Europe Phthalic Anhydride Derivatives Industry Volume (K Tons) Forecast, by Application 2020 & 2033
- Table 51: Global Phthalic Anhydride Derivatives Industry Revenue billion Forecast, by Derivatives 2020 & 2033
- Table 52: Global Phthalic Anhydride Derivatives Industry Volume K Tons Forecast, by Derivatives 2020 & 2033
- Table 53: Global Phthalic Anhydride Derivatives Industry Revenue billion Forecast, by End-user Industry 2020 & 2033
- Table 54: Global Phthalic Anhydride Derivatives Industry Volume K Tons Forecast, by End-user Industry 2020 & 2033
- Table 55: Global Phthalic Anhydride Derivatives Industry Revenue billion Forecast, by Country 2020 & 2033
- Table 56: Global Phthalic Anhydride Derivatives Industry Volume K Tons Forecast, by Country 2020 & 2033
- Table 57: Brazil Phthalic Anhydride Derivatives Industry Revenue (billion) Forecast, by Application 2020 & 2033
- Table 58: Brazil Phthalic Anhydride Derivatives Industry Volume (K Tons) Forecast, by Application 2020 & 2033
- Table 59: Argentina Phthalic Anhydride Derivatives Industry Revenue (billion) Forecast, by Application 2020 & 2033
- Table 60: Argentina Phthalic Anhydride Derivatives Industry Volume (K Tons) Forecast, by Application 2020 & 2033
- Table 61: Rest of South America Phthalic Anhydride Derivatives Industry Revenue (billion) Forecast, by Application 2020 & 2033
- Table 62: Rest of South America Phthalic Anhydride Derivatives Industry Volume (K Tons) Forecast, by Application 2020 & 2033
- Table 63: Global Phthalic Anhydride Derivatives Industry Revenue billion Forecast, by Derivatives 2020 & 2033
- Table 64: Global Phthalic Anhydride Derivatives Industry Volume K Tons Forecast, by Derivatives 2020 & 2033
- Table 65: Global Phthalic Anhydride Derivatives Industry Revenue billion Forecast, by End-user Industry 2020 & 2033
- Table 66: Global Phthalic Anhydride Derivatives Industry Volume K Tons Forecast, by End-user Industry 2020 & 2033
- Table 67: Global Phthalic Anhydride Derivatives Industry Revenue billion Forecast, by Country 2020 & 2033
- Table 68: Global Phthalic Anhydride Derivatives Industry Volume K Tons Forecast, by Country 2020 & 2033
- Table 69: Saudi Arabia Phthalic Anhydride Derivatives Industry Revenue (billion) Forecast, by Application 2020 & 2033
- Table 70: Saudi Arabia Phthalic Anhydride Derivatives Industry Volume (K Tons) Forecast, by Application 2020 & 2033
- Table 71: South Africa Phthalic Anhydride Derivatives Industry Revenue (billion) Forecast, by Application 2020 & 2033
- Table 72: South Africa Phthalic Anhydride Derivatives Industry Volume (K Tons) Forecast, by Application 2020 & 2033
- Table 73: Rest of Middle East and Africa Phthalic Anhydride Derivatives Industry Revenue (billion) Forecast, by Application 2020 & 2033
- Table 74: Rest of Middle East and Africa Phthalic Anhydride Derivatives Industry Volume (K Tons) Forecast, by Application 2020 & 2033
Frequently Asked Questions
1. What is the projected Compound Annual Growth Rate (CAGR) of the Phthalic Anhydride Derivatives Industry?
The projected CAGR is approximately 6.6%.
2. Which companies are prominent players in the Phthalic Anhydride Derivatives Industry?
Key companies in the market include KH Chemicals, Stepan Company, LANXESS, BASF SE, Alfa Aesar, PENPET Petrochemical Trading GmbH, JFE Chemical Corporation, I G Petrochemicals Ltd, Polynt SpA, Thirumalai Chemicals Ltd, Tokyo Chemical Industry, S I Group Inc, Koppers Inc, Perstorp, The Chemical Company.
3. What are the main segments of the Phthalic Anhydride Derivatives Industry?
The market segments include Derivatives, End-user Industry.
4. Can you provide details about the market size?
The market size is estimated to be USD 4.88 billion as of 2022.
5. What are some drivers contributing to market growth?
; Increasing Consumption of Plastics in Construction Sector; Other Drivers.
6. What are the notable trends driving market growth?
Construction Sector to Dominate the Market.
7. Are there any restraints impacting market growth?
; Toxicity related to Phthalic Anhydride; Unfavorable Conditions Arising Due to COVID-19 Outbreak.
8. Can you provide examples of recent developments in the market?
N/A
9. What pricing options are available for accessing the report?
Pricing options include single-user, multi-user, and enterprise licenses priced at USD 4750, USD 5250, and USD 8750 respectively.
10. Is the market size provided in terms of value or volume?
The market size is provided in terms of value, measured in billion and volume, measured in K Tons.
11. Are there any specific market keywords associated with the report?
Yes, the market keyword associated with the report is "Phthalic Anhydride Derivatives Industry," which aids in identifying and referencing the specific market segment covered.
12. How do I determine which pricing option suits my needs best?
The pricing options vary based on user requirements and access needs. Individual users may opt for single-user licenses, while businesses requiring broader access may choose multi-user or enterprise licenses for cost-effective access to the report.
13. Are there any additional resources or data provided in the Phthalic Anhydride Derivatives Industry report?
While the report offers comprehensive insights, it's advisable to review the specific contents or supplementary materials provided to ascertain if additional resources or data are available.
14. How can I stay updated on further developments or reports in the Phthalic Anhydride Derivatives Industry?
To stay informed about further developments, trends, and reports in the Phthalic Anhydride Derivatives Industry, consider subscribing to industry newsletters, following relevant companies and organizations, or regularly checking reputable industry news sources and publications.
Methodology
Step 1 - Identification of Relevant Samples Size from Population Database


Step 2 - Approaches for Defining Global Market Size (Value, Volume* & Price*)

Note*: In applicable scenarios
Step 3 - Data Sources
Primary Research
- Web Analytics
- Survey Reports
- Research Institute
- Latest Research Reports
- Opinion Leaders
Secondary Research
- Annual Reports
- White Paper
- Latest Press Release
- Industry Association
- Paid Database
- Investor Presentations

Step 4 - Data Triangulation
Involves using different sources of information in order to increase the validity of a study
These sources are likely to be stakeholders in a program - participants, other researchers, program staff, other community members, and so on.
Then we put all data in single framework & apply various statistical tools to find out the dynamic on the market.
During the analysis stage, feedback from the stakeholder groups would be compared to determine areas of agreement as well as areas of divergence