

Key Insights
The global Petroleum Refining & Chemicals Catalysts market is poised for significant expansion, driven by escalating demand for refined petroleum products and the burgeoning chemical industry. This sector is forecasted to grow at a Compound Annual Growth Rate (CAGR) of 4.3%. The market size was valued at $10,096.57 million in the base year 2025 and is projected to continue its upward trajectory through 2033. Key growth catalysts include increasing global energy consumption, the imperative for efficient and sustainable chemical processes, and the enforcement of rigorous environmental regulations mandating cleaner production methods. The market is segmented by application (Petroleum Refining, Isomerization, Synthesis Gas Processes, Polymerization), material (Metals and Organometallic Catalysts, Metallic Compounds, Aluminosilicates, Molecular Sieves, Other Chemical Compounds), and geography. The Asia-Pacific region, led by China and India, is anticipated to dominate market share due to rapid industrialization and substantial investments in refining and chemical production infrastructure. North America and Europe also represent key markets, albeit with potentially lower growth rates compared to Asia-Pacific. Challenges such as volatile crude oil prices, stringent safety protocols, and the emergence of alternative catalyst technologies may temper rapid expansion. The competitive landscape is characterized by a mix of established multinational corporations and specialized catalyst manufacturers, fostering a dynamic environment of innovation and competition.
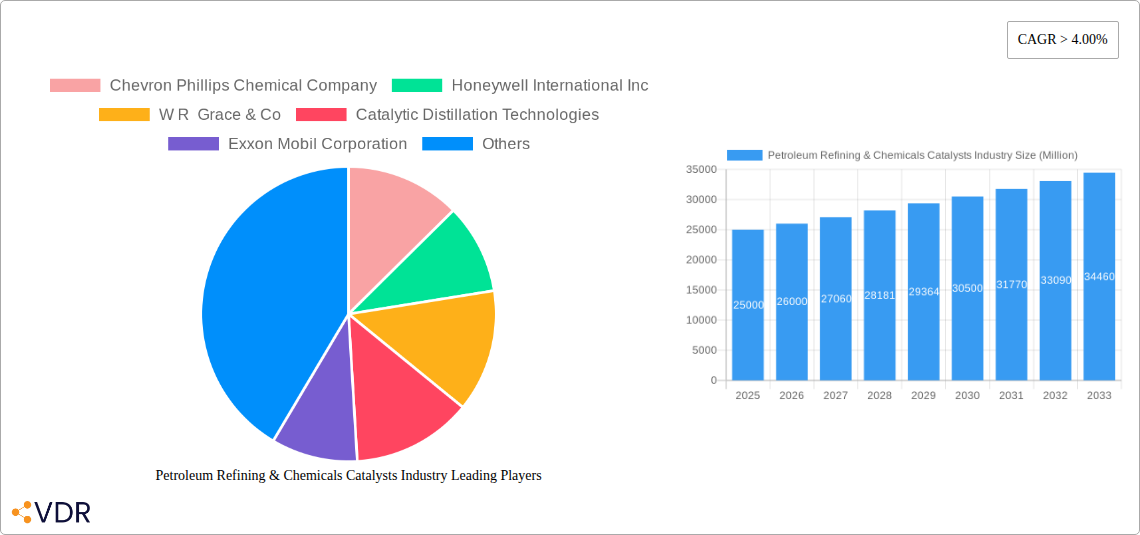
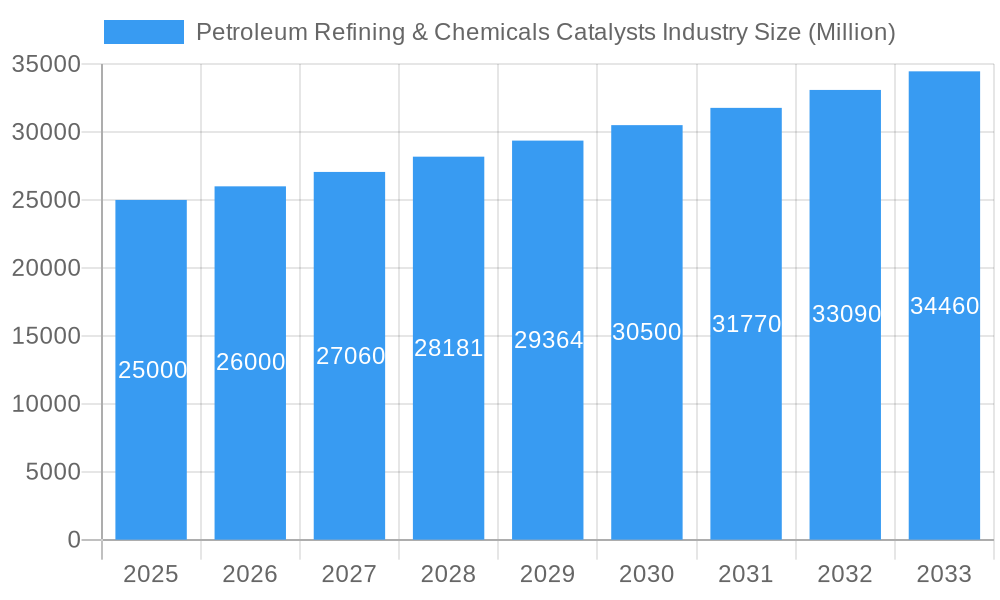
Petroleum Refining & Chemicals Catalysts Industry Market Size (In Billion)
The diverse applications of catalysts underscore the market's segmentation. Petroleum refining extensively employs catalysts in processes such as cracking and reforming to optimize fuel output. Chemical synthesis relies heavily on catalysts to accelerate reaction rates and enhance yields across various applications, including polymer production and pharmaceuticals. Metals and organometallic catalysts currently hold a dominant position due to their efficacy and versatility. However, ongoing research and development are focusing on more sustainable and efficient catalyst solutions, such as those utilizing molecular sieves and advanced materials, which are poised to shape future market trends. A comprehensive understanding of regional regulatory frameworks, infrastructure development, and consumer demand is crucial for accurate market forecasting and identifying lucrative investment opportunities within this global market. Strategic investments in research and development aimed at enhancing catalyst efficiency, durability, and selectivity, alongside the growing demand for environmentally conscious alternatives, will be pivotal in driving the industry's sustained long-term growth.
Petroleum Refining & Chemicals Catalysts Industry Company Market Share
Petroleum Refining & Chemicals Catalysts Market Report: 2019-2033
This comprehensive report provides an in-depth analysis of the Petroleum Refining & Chemicals Catalysts market, encompassing its dynamics, growth trends, regional segmentation, product landscape, and key players. The report covers the period from 2019 to 2033, with a focus on the forecast period of 2025-2033 and a base year of 2025. The study offers valuable insights for industry professionals, investors, and stakeholders seeking a thorough understanding of this crucial sector.
Petroleum Refining & Chemicals Catalysts Industry Market Dynamics & Structure
The global Petroleum Refining & Chemicals Catalysts market is characterized by a moderately concentrated structure, with a select group of leading global players dominating significant market share. In 2025, the market size is projected to reach approximately [Insert 2025 Market Size Figure Here] Million USD. A primary driver of this market is continuous technological innovation, particularly in the realm of advanced materials, catalytic processes, and digital integration for enhanced performance. The industry is profoundly shaped by increasingly stringent global environmental regulations, compelling manufacturers to prioritize the development and adoption of more efficient, sustainable, and eco-friendly catalytic solutions. While the emergence of substitute technologies, such as advanced bio-based catalysts and novel synthetic materials, presents a competitive challenge, the proven efficacy, reliability, and cost-effectiveness of traditional petroleum refining and chemical catalysts ensure their continued market dominance. Mergers and acquisitions (M&A) activity has been a steady feature in recent years, with an estimated [Insert Number of Deals] significant deals recorded between 2019 and 2024, collectively valued at approximately [Insert Total M&A Value] Million USD. This trend indicates a strategic consolidation within the industry aimed at expanding portfolios and enhancing market reach. The end-user landscape is highly diverse, encompassing major petroleum refineries, large-scale chemical manufacturing plants, petrochemical facilities, and various other industrial sectors reliant on catalytic processes.
- Market Concentration: The market exhibits moderate concentration, with the top 5 key players anticipated to hold an approximate [Insert Top 5 Market Share Percentage]% market share in 2025.
- Technological Innovation Focus: Emphasis is placed on developing catalysts with enhanced activity, superior selectivity, extended operational lifespans, and significantly reduced environmental footprints.
- Regulatory Framework Influence: A growing and more rigorous global regulatory environment for emissions and sustainability is a significant driver, increasing the demand for 'green' and highly efficient catalysts.
- Competitive Substitutes Landscape: Bio-based catalysts, supported by advancements in biotechnology, and other novel catalytic materials are gradually carving out niche applications and increasing competitive pressure.
- M&A Activity Trends: The period between 2019-2024 saw approximately [Insert Number of Deals] M&A transactions, representing a total investment of [Insert Total M&A Value] Million USD. Further consolidation is anticipated as companies seek economies of scale and expanded technological capabilities.
- Innovation Barriers: Substantial research and development (R&D) investments, coupled with complex and lengthy regulatory approval processes for new catalysts, present significant hurdles to rapid innovation.
Petroleum Refining & Chemicals Catalysts Industry Growth Trends & Insights
The Petroleum Refining & Chemicals Catalysts market is projected to experience substantial growth during the forecast period (2025-2033). Driven by factors such as increasing demand for refined petroleum products and petrochemicals, coupled with advancements in catalyst technology, the market is expected to register a CAGR of xx% from 2025 to 2033. This growth is further fueled by rising investments in refinery modernization and expansion projects globally. The adoption rate of advanced catalyst technologies is steadily increasing, driven by their superior performance and efficiency. Technological disruptions, such as the emergence of AI-driven catalyst design and manufacturing, are expected to further accelerate market growth. Consumer behavior shifts towards sustainability are influencing the demand for environmentally friendly catalysts. Market penetration of new catalyst types is projected to increase by xx% by 2033.
Dominant Regions, Countries, or Segments in Petroleum Refining & Chemicals Catalysts Industry
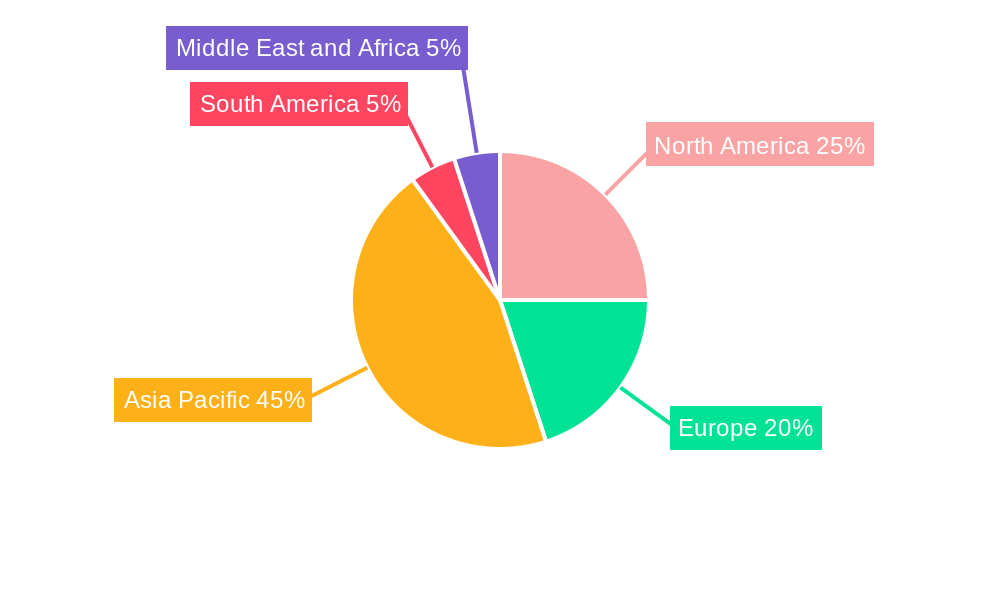
The Asia-Pacific region is currently the leading market for petroleum refining and chemicals catalysts, driven by rapid industrialization and strong economic growth in countries like China and India. Within the application segments, petroleum refining accounts for the largest share, driven by continuous demand for fuels and lubricants. The isomerization segment demonstrates significant growth potential, with increasing adoption of isomerization catalysts in the production of high-octane gasoline.
- Key Drivers:
- Asia-Pacific Region: Rapid industrialization, strong economic growth, and significant investments in refining capacity.
- Petroleum Refining Segment: High and consistent demand for fuels and lubricants.
- Isomerization Segment: Growing demand for high-octane gasoline and increasing adoption of isomerization catalysts.
- Dominance Factors: Large and growing economies, substantial investment in refining infrastructure, favorable government policies.
- Growth Potential: Significant growth potential exists in emerging markets, driven by increasing demand for petrochemicals and fuels.
Petroleum Refining & Chemicals Catalysts Industry Product Landscape
The Petroleum Refining & Chemicals Catalysts market boasts an extensive and sophisticated product portfolio. Key categories include high-performance metallic and organometallic catalysts, a wide array of metallic compounds (prominently featuring aluminosilicates), highly specialized molecular sieves, and various other advanced chemical compounds. Each catalyst type is meticulously engineered and optimized for distinct industrial applications, delivering unique performance characteristics in terms of catalytic activity, reaction selectivity, and long-term operational stability. Recent significant innovations are centered on optimizing catalyst efficiency, extending their service life through improved robustness, and minimizing their environmental impact. Notable advancements include the strategic incorporation of nanomaterials to enhance surface area and reactivity, and the sophisticated application of advanced characterization techniques to facilitate more precise and effective catalyst design and development.
Key Drivers, Barriers & Challenges in Petroleum Refining & Chemicals Catalysts Industry
Key Drivers:
- Increasing demand for refined petroleum products and petrochemicals.
- Stringent environmental regulations promoting the use of cleaner catalysts.
- Technological advancements leading to improved catalyst performance.
- Investments in refinery modernization and expansion projects.
Challenges and Restraints:
- High R&D costs associated with developing new catalysts.
- Fluctuations in raw material prices impacting catalyst production costs.
- Supply chain disruptions affecting the availability of raw materials.
- Intense competition among existing players and emerging technologies. The impact of these challenges is estimated to reduce annual market growth by xx% in some years.
Emerging Opportunities in Petroleum Refining & Chemicals Catalysts Industry
- The escalating global demand for renewable fuels, sustainable bio-based chemicals, and circular economy solutions is spurring the development of next-generation, highly specialized catalysts.
- A growing imperative for sustainable industrial practices and environmentally benign technologies is accelerating research into and adoption of eco-friendly catalyst solutions.
- Expanding applications of advanced catalysts in nascent and rapidly growing sectors such as next-generation biofuels, carbon capture and utilization (CCU), and hydrogen production present significant growth avenues.
Growth Accelerators in the Petroleum Refining & Chemicals Catalysts Industry Industry
Significant technological breakthroughs in catalyst design methodologies, advanced manufacturing techniques, and digital simulation tools are acting as key growth accelerators. Furthermore, strategic partnerships, joint ventures, and collaborative research initiatives among leading industry players are fostering innovation and market expansion. Proactive market penetration into emerging geographical regions and novel application areas, coupled with robust marketing campaigns and dedicated customer engagement strategies, are deemed essential for achieving sustained and robust growth in this dynamic industry.
Key Players Shaping the Petroleum Refining & Chemicals Catalysts Market
- Chevron Phillips Chemical Company
- Honeywell International Inc
- W R Grace & Co
- Catalytic Distillation Technologies
- Exxon Mobil Corporation
- INEOS Technologies
- Johnson Matthey Inc
- Evonik Industries AG
- Wako Chemicals USA Inc
- KBR Inc
- BASF SE
- Eka Chemicals AB
- Zeochem LLC
- Zeolyst International
- Chicago Bridge & Iron Company
- Dow
- Bayer Technology Services
- Nova Chemicals Corp
- Clariant International Ltd
- Eastman Chemical Co
Notable Milestones in Petroleum Refining & Chemicals Catalysts Industry Sector
- 2020: Launch of a novel catalyst technology by [Company Name] resulting in a xx% increase in efficiency.
- 2022: Acquisition of [Company A] by [Company B], leading to expansion in the [region] market.
- 2023: Introduction of stricter environmental regulations in [region], driving demand for green catalysts. (Further milestones can be added as per available data.)
In-Depth Petroleum Refining & Chemicals Catalysts Industry Market Outlook
The Petroleum Refining & Chemicals Catalysts market is poised for continued growth, driven by technological innovation, rising demand, and strategic investments. Emerging applications in areas like renewable energy and sustainable chemistry are expected to open up new avenues for market expansion. Companies focusing on developing cutting-edge catalyst technologies, coupled with strong strategic partnerships and proactive market expansion strategies, are well-positioned to capitalize on future growth opportunities.
Petroleum Refining & Chemicals Catalysts Industry Segmentation
-
1. Material
-
1.1. Metals and Organometallic Catalysts
- 1.1.1. Inexpensive Metals
- 1.1.2. Precious Metals
- 1.1.3. Metallic Compounds
-
1.2. Aluminosilicates
- 1.2.1. Zeolites
- 1.2.2. Molecular Sieves
-
1.3. Chemical Compounds
- 1.3.1. Peroxides
- 1.3.2. Acids
- 1.3.3. Amines
- 1.3.4. Other Chemical Compounds
- 1.4. Other Materials
-
1.1. Metals and Organometallic Catalysts
-
2. Application
-
2.1. Petroleum Refining
- 2.1.1. Fluid Catalytic Cracking (FCC)
- 2.1.2. Hydrocracking
- 2.1.3. Hydrotreating
- 2.1.4. Alkylation
- 2.1.5. Reforming
- 2.1.6. Isomerization
-
2.2. Chemical Synthesis
- 2.2.1. Organic Synthesis
- 2.2.2. Oxidation
- 2.2.3. Hydrogenation
- 2.2.4. Dehydrogenation
- 2.2.5. Synthesis Gas Processes
-
2.3. Polymerization
- 2.3.1. Polyolefins
- 2.3.2. Condensation Polymers
- 2.3.3. Thermosetting Polymers
- 2.3.4. Additional Polymers
-
2.1. Petroleum Refining
Petroleum Refining & Chemicals Catalysts Industry Segmentation By Geography
-
1. Asia Pacific
- 1.1. China
- 1.2. India
- 1.3. Japan
- 1.4. South Korea
- 1.5. ASEAN Countries
- 1.6. Rest of Asia Pacific
-
2. North America
- 2.1. United States
- 2.2. Canada
- 2.3. Mexico
-
3. Europe
- 3.1. Germany
- 3.2. United Kingdom
- 3.3. Italy
- 3.4. France
- 3.5. Rest of Europe
-
4. South America
- 4.1. Brazil
- 4.2. Argentina
- 4.3. Rest of South America
-
5. Middle East and Africa
- 5.1. Saudi Arabia
- 5.2. South Africa
- 5.3. Rest of Middle East and Africa
Petroleum Refining & Chemicals Catalysts Industry Regional Market Share
Geographic Coverage of Petroleum Refining & Chemicals Catalysts Industry
Petroleum Refining & Chemicals Catalysts Industry REPORT HIGHLIGHTS
| Aspects | Details |
|---|---|
| Study Period | 2020-2034 |
| Base Year | 2025 |
| Estimated Year | 2026 |
| Forecast Period | 2026-2034 |
| Historical Period | 2020-2025 |
| Growth Rate | CAGR of 4.3% from 2020-2034 |
| Segmentation |
|
Table of Contents
- 1. Introduction
- 1.1. Research Scope
- 1.2. Market Segmentation
- 1.3. Research Objective
- 1.4. Definitions and Assumptions
- 2. Executive Summary
- 2.1. Market Snapshot
- 3. Market Dynamics
- 3.1. Market Drivers
- 3.2. Market Restrains
- 3.3. Market Trends
- 3.4. Market Opportunities
- 4. Market Factor Analysis
- 4.1. Porters Five Forces
- 4.1.1. Bargaining Power of Suppliers
- 4.1.2. Bargaining Power of Buyers
- 4.1.3. Threat of New Entrants
- 4.1.4. Threat of Substitutes
- 4.1.5. Competitive Rivalry
- 4.2. PESTEL analysis
- 4.3. BCG Analysis
- 4.3.1. Stars (High Growth, High Market Share)
- 4.3.2. Cash Cows (Low Growth, High Market Share)
- 4.3.3. Question Mark (High Growth, Low Market Share)
- 4.3.4. Dogs (Low Growth, Low Market Share)
- 4.4. Ansoff Matrix Analysis
- 4.5. Supply Chain Analysis
- 4.6. Regulatory Landscape
- 4.7. Current Market Potential and Opportunity Assessment (TAM–SAM–SOM Framework)
- 4.8. VDR Analyst Note
- 4.1. Porters Five Forces
- 5. Market Analysis, Insights and Forecast 2021-2033
- 5.1. Market Analysis, Insights and Forecast - by Material
- 5.1.1. Metals and Organometallic Catalysts
- 5.1.1.1. Inexpensive Metals
- 5.1.1.2. Precious Metals
- 5.1.1.3. Metallic Compounds
- 5.1.2. Aluminosilicates
- 5.1.2.1. Zeolites
- 5.1.2.2. Molecular Sieves
- 5.1.3. Chemical Compounds
- 5.1.3.1. Peroxides
- 5.1.3.2. Acids
- 5.1.3.3. Amines
- 5.1.3.4. Other Chemical Compounds
- 5.1.4. Other Materials
- 5.1.1. Metals and Organometallic Catalysts
- 5.2. Market Analysis, Insights and Forecast - by Application
- 5.2.1. Petroleum Refining
- 5.2.1.1. Fluid Catalytic Cracking (FCC)
- 5.2.1.2. Hydrocracking
- 5.2.1.3. Hydrotreating
- 5.2.1.4. Alkylation
- 5.2.1.5. Reforming
- 5.2.1.6. Isomerization
- 5.2.2. Chemical Synthesis
- 5.2.2.1. Organic Synthesis
- 5.2.2.2. Oxidation
- 5.2.2.3. Hydrogenation
- 5.2.2.4. Dehydrogenation
- 5.2.2.5. Synthesis Gas Processes
- 5.2.3. Polymerization
- 5.2.3.1. Polyolefins
- 5.2.3.2. Condensation Polymers
- 5.2.3.3. Thermosetting Polymers
- 5.2.3.4. Additional Polymers
- 5.2.1. Petroleum Refining
- 5.3. Market Analysis, Insights and Forecast - by Region
- 5.3.1. Asia Pacific
- 5.3.2. North America
- 5.3.3. Europe
- 5.3.4. South America
- 5.3.5. Middle East and Africa
- 5.1. Market Analysis, Insights and Forecast - by Material
- 6. Global Petroleum Refining & Chemicals Catalysts Industry Analysis, Insights and Forecast, 2021-2033
- 6.1. Market Analysis, Insights and Forecast - by Material
- 6.1.1. Metals and Organometallic Catalysts
- 6.1.1.1. Inexpensive Metals
- 6.1.1.2. Precious Metals
- 6.1.1.3. Metallic Compounds
- 6.1.2. Aluminosilicates
- 6.1.2.1. Zeolites
- 6.1.2.2. Molecular Sieves
- 6.1.3. Chemical Compounds
- 6.1.3.1. Peroxides
- 6.1.3.2. Acids
- 6.1.3.3. Amines
- 6.1.3.4. Other Chemical Compounds
- 6.1.4. Other Materials
- 6.1.1. Metals and Organometallic Catalysts
- 6.2. Market Analysis, Insights and Forecast - by Application
- 6.2.1. Petroleum Refining
- 6.2.1.1. Fluid Catalytic Cracking (FCC)
- 6.2.1.2. Hydrocracking
- 6.2.1.3. Hydrotreating
- 6.2.1.4. Alkylation
- 6.2.1.5. Reforming
- 6.2.1.6. Isomerization
- 6.2.2. Chemical Synthesis
- 6.2.2.1. Organic Synthesis
- 6.2.2.2. Oxidation
- 6.2.2.3. Hydrogenation
- 6.2.2.4. Dehydrogenation
- 6.2.2.5. Synthesis Gas Processes
- 6.2.3. Polymerization
- 6.2.3.1. Polyolefins
- 6.2.3.2. Condensation Polymers
- 6.2.3.3. Thermosetting Polymers
- 6.2.3.4. Additional Polymers
- 6.2.1. Petroleum Refining
- 6.1. Market Analysis, Insights and Forecast - by Material
- 7. Asia Pacific Petroleum Refining & Chemicals Catalysts Industry Analysis, Insights and Forecast, 2021-2033
- 7.1. Market Analysis, Insights and Forecast - by Material
- 7.1.1. Metals and Organometallic Catalysts
- 7.1.1.1. Inexpensive Metals
- 7.1.1.2. Precious Metals
- 7.1.1.3. Metallic Compounds
- 7.1.2. Aluminosilicates
- 7.1.2.1. Zeolites
- 7.1.2.2. Molecular Sieves
- 7.1.3. Chemical Compounds
- 7.1.3.1. Peroxides
- 7.1.3.2. Acids
- 7.1.3.3. Amines
- 7.1.3.4. Other Chemical Compounds
- 7.1.4. Other Materials
- 7.1.1. Metals and Organometallic Catalysts
- 7.2. Market Analysis, Insights and Forecast - by Application
- 7.2.1. Petroleum Refining
- 7.2.1.1. Fluid Catalytic Cracking (FCC)
- 7.2.1.2. Hydrocracking
- 7.2.1.3. Hydrotreating
- 7.2.1.4. Alkylation
- 7.2.1.5. Reforming
- 7.2.1.6. Isomerization
- 7.2.2. Chemical Synthesis
- 7.2.2.1. Organic Synthesis
- 7.2.2.2. Oxidation
- 7.2.2.3. Hydrogenation
- 7.2.2.4. Dehydrogenation
- 7.2.2.5. Synthesis Gas Processes
- 7.2.3. Polymerization
- 7.2.3.1. Polyolefins
- 7.2.3.2. Condensation Polymers
- 7.2.3.3. Thermosetting Polymers
- 7.2.3.4. Additional Polymers
- 7.2.1. Petroleum Refining
- 7.1. Market Analysis, Insights and Forecast - by Material
- 8. North America Petroleum Refining & Chemicals Catalysts Industry Analysis, Insights and Forecast, 2021-2033
- 8.1. Market Analysis, Insights and Forecast - by Material
- 8.1.1. Metals and Organometallic Catalysts
- 8.1.1.1. Inexpensive Metals
- 8.1.1.2. Precious Metals
- 8.1.1.3. Metallic Compounds
- 8.1.2. Aluminosilicates
- 8.1.2.1. Zeolites
- 8.1.2.2. Molecular Sieves
- 8.1.3. Chemical Compounds
- 8.1.3.1. Peroxides
- 8.1.3.2. Acids
- 8.1.3.3. Amines
- 8.1.3.4. Other Chemical Compounds
- 8.1.4. Other Materials
- 8.1.1. Metals and Organometallic Catalysts
- 8.2. Market Analysis, Insights and Forecast - by Application
- 8.2.1. Petroleum Refining
- 8.2.1.1. Fluid Catalytic Cracking (FCC)
- 8.2.1.2. Hydrocracking
- 8.2.1.3. Hydrotreating
- 8.2.1.4. Alkylation
- 8.2.1.5. Reforming
- 8.2.1.6. Isomerization
- 8.2.2. Chemical Synthesis
- 8.2.2.1. Organic Synthesis
- 8.2.2.2. Oxidation
- 8.2.2.3. Hydrogenation
- 8.2.2.4. Dehydrogenation
- 8.2.2.5. Synthesis Gas Processes
- 8.2.3. Polymerization
- 8.2.3.1. Polyolefins
- 8.2.3.2. Condensation Polymers
- 8.2.3.3. Thermosetting Polymers
- 8.2.3.4. Additional Polymers
- 8.2.1. Petroleum Refining
- 8.1. Market Analysis, Insights and Forecast - by Material
- 9. Europe Petroleum Refining & Chemicals Catalysts Industry Analysis, Insights and Forecast, 2021-2033
- 9.1. Market Analysis, Insights and Forecast - by Material
- 9.1.1. Metals and Organometallic Catalysts
- 9.1.1.1. Inexpensive Metals
- 9.1.1.2. Precious Metals
- 9.1.1.3. Metallic Compounds
- 9.1.2. Aluminosilicates
- 9.1.2.1. Zeolites
- 9.1.2.2. Molecular Sieves
- 9.1.3. Chemical Compounds
- 9.1.3.1. Peroxides
- 9.1.3.2. Acids
- 9.1.3.3. Amines
- 9.1.3.4. Other Chemical Compounds
- 9.1.4. Other Materials
- 9.1.1. Metals and Organometallic Catalysts
- 9.2. Market Analysis, Insights and Forecast - by Application
- 9.2.1. Petroleum Refining
- 9.2.1.1. Fluid Catalytic Cracking (FCC)
- 9.2.1.2. Hydrocracking
- 9.2.1.3. Hydrotreating
- 9.2.1.4. Alkylation
- 9.2.1.5. Reforming
- 9.2.1.6. Isomerization
- 9.2.2. Chemical Synthesis
- 9.2.2.1. Organic Synthesis
- 9.2.2.2. Oxidation
- 9.2.2.3. Hydrogenation
- 9.2.2.4. Dehydrogenation
- 9.2.2.5. Synthesis Gas Processes
- 9.2.3. Polymerization
- 9.2.3.1. Polyolefins
- 9.2.3.2. Condensation Polymers
- 9.2.3.3. Thermosetting Polymers
- 9.2.3.4. Additional Polymers
- 9.2.1. Petroleum Refining
- 9.1. Market Analysis, Insights and Forecast - by Material
- 10. South America Petroleum Refining & Chemicals Catalysts Industry Analysis, Insights and Forecast, 2021-2033
- 10.1. Market Analysis, Insights and Forecast - by Material
- 10.1.1. Metals and Organometallic Catalysts
- 10.1.1.1. Inexpensive Metals
- 10.1.1.2. Precious Metals
- 10.1.1.3. Metallic Compounds
- 10.1.2. Aluminosilicates
- 10.1.2.1. Zeolites
- 10.1.2.2. Molecular Sieves
- 10.1.3. Chemical Compounds
- 10.1.3.1. Peroxides
- 10.1.3.2. Acids
- 10.1.3.3. Amines
- 10.1.3.4. Other Chemical Compounds
- 10.1.4. Other Materials
- 10.1.1. Metals and Organometallic Catalysts
- 10.2. Market Analysis, Insights and Forecast - by Application
- 10.2.1. Petroleum Refining
- 10.2.1.1. Fluid Catalytic Cracking (FCC)
- 10.2.1.2. Hydrocracking
- 10.2.1.3. Hydrotreating
- 10.2.1.4. Alkylation
- 10.2.1.5. Reforming
- 10.2.1.6. Isomerization
- 10.2.2. Chemical Synthesis
- 10.2.2.1. Organic Synthesis
- 10.2.2.2. Oxidation
- 10.2.2.3. Hydrogenation
- 10.2.2.4. Dehydrogenation
- 10.2.2.5. Synthesis Gas Processes
- 10.2.3. Polymerization
- 10.2.3.1. Polyolefins
- 10.2.3.2. Condensation Polymers
- 10.2.3.3. Thermosetting Polymers
- 10.2.3.4. Additional Polymers
- 10.2.1. Petroleum Refining
- 10.1. Market Analysis, Insights and Forecast - by Material
- 11. Middle East and Africa Petroleum Refining & Chemicals Catalysts Industry Analysis, Insights and Forecast, 2021-2033
- 11.1. Market Analysis, Insights and Forecast - by Material
- 11.1.1. Metals and Organometallic Catalysts
- 11.1.1.1. Inexpensive Metals
- 11.1.1.2. Precious Metals
- 11.1.1.3. Metallic Compounds
- 11.1.2. Aluminosilicates
- 11.1.2.1. Zeolites
- 11.1.2.2. Molecular Sieves
- 11.1.3. Chemical Compounds
- 11.1.3.1. Peroxides
- 11.1.3.2. Acids
- 11.1.3.3. Amines
- 11.1.3.4. Other Chemical Compounds
- 11.1.4. Other Materials
- 11.1.1. Metals and Organometallic Catalysts
- 11.2. Market Analysis, Insights and Forecast - by Application
- 11.2.1. Petroleum Refining
- 11.2.1.1. Fluid Catalytic Cracking (FCC)
- 11.2.1.2. Hydrocracking
- 11.2.1.3. Hydrotreating
- 11.2.1.4. Alkylation
- 11.2.1.5. Reforming
- 11.2.1.6. Isomerization
- 11.2.2. Chemical Synthesis
- 11.2.2.1. Organic Synthesis
- 11.2.2.2. Oxidation
- 11.2.2.3. Hydrogenation
- 11.2.2.4. Dehydrogenation
- 11.2.2.5. Synthesis Gas Processes
- 11.2.3. Polymerization
- 11.2.3.1. Polyolefins
- 11.2.3.2. Condensation Polymers
- 11.2.3.3. Thermosetting Polymers
- 11.2.3.4. Additional Polymers
- 11.2.1. Petroleum Refining
- 11.1. Market Analysis, Insights and Forecast - by Material
- 12. Competitive Analysis
- 12.1. Company Profiles
- 12.1.1 Chevron Phillips Chemical Company
- 12.1.1.1. Company Overview
- 12.1.1.2. Products
- 12.1.1.3. Company Financials
- 12.1.1.4. SWOT Analysis
- 12.1.2 Honeywell International Inc
- 12.1.2.1. Company Overview
- 12.1.2.2. Products
- 12.1.2.3. Company Financials
- 12.1.2.4. SWOT Analysis
- 12.1.3 W R Grace & Co
- 12.1.3.1. Company Overview
- 12.1.3.2. Products
- 12.1.3.3. Company Financials
- 12.1.3.4. SWOT Analysis
- 12.1.4 Catalytic Distillation Technologies
- 12.1.4.1. Company Overview
- 12.1.4.2. Products
- 12.1.4.3. Company Financials
- 12.1.4.4. SWOT Analysis
- 12.1.5 Exxon Mobil Corporation
- 12.1.5.1. Company Overview
- 12.1.5.2. Products
- 12.1.5.3. Company Financials
- 12.1.5.4. SWOT Analysis
- 12.1.6 INEOS Technologies
- 12.1.6.1. Company Overview
- 12.1.6.2. Products
- 12.1.6.3. Company Financials
- 12.1.6.4. SWOT Analysis
- 12.1.7 Johnson Matthey Inc
- 12.1.7.1. Company Overview
- 12.1.7.2. Products
- 12.1.7.3. Company Financials
- 12.1.7.4. SWOT Analysis
- 12.1.8 Evonik Industries AG
- 12.1.8.1. Company Overview
- 12.1.8.2. Products
- 12.1.8.3. Company Financials
- 12.1.8.4. SWOT Analysis
- 12.1.9 Wako Chemicals USA Inc
- 12.1.9.1. Company Overview
- 12.1.9.2. Products
- 12.1.9.3. Company Financials
- 12.1.9.4. SWOT Analysis
- 12.1.10 KBR Inc
- 12.1.10.1. Company Overview
- 12.1.10.2. Products
- 12.1.10.3. Company Financials
- 12.1.10.4. SWOT Analysis
- 12.1.11 BASF SE
- 12.1.11.1. Company Overview
- 12.1.11.2. Products
- 12.1.11.3. Company Financials
- 12.1.11.4. SWOT Analysis
- 12.1.12 Eka Chemicals AB
- 12.1.12.1. Company Overview
- 12.1.12.2. Products
- 12.1.12.3. Company Financials
- 12.1.12.4. SWOT Analysis
- 12.1.13 Zeochem LLC
- 12.1.13.1. Company Overview
- 12.1.13.2. Products
- 12.1.13.3. Company Financials
- 12.1.13.4. SWOT Analysis
- 12.1.14 Zeolyst International*List Not Exhaustive
- 12.1.14.1. Company Overview
- 12.1.14.2. Products
- 12.1.14.3. Company Financials
- 12.1.14.4. SWOT Analysis
- 12.1.15 Chicago Bridge & Iron Company
- 12.1.15.1. Company Overview
- 12.1.15.2. Products
- 12.1.15.3. Company Financials
- 12.1.15.4. SWOT Analysis
- 12.1.16 Dow
- 12.1.16.1. Company Overview
- 12.1.16.2. Products
- 12.1.16.3. Company Financials
- 12.1.16.4. SWOT Analysis
- 12.1.17 Bayer Technology Services
- 12.1.17.1. Company Overview
- 12.1.17.2. Products
- 12.1.17.3. Company Financials
- 12.1.17.4. SWOT Analysis
- 12.1.18 Nova Chemicals Corp
- 12.1.18.1. Company Overview
- 12.1.18.2. Products
- 12.1.18.3. Company Financials
- 12.1.18.4. SWOT Analysis
- 12.1.19 Clariant International Ltd
- 12.1.19.1. Company Overview
- 12.1.19.2. Products
- 12.1.19.3. Company Financials
- 12.1.19.4. SWOT Analysis
- 12.1.20 Eastman Chemical Co
- 12.1.20.1. Company Overview
- 12.1.20.2. Products
- 12.1.20.3. Company Financials
- 12.1.20.4. SWOT Analysis
- 12.1.1 Chevron Phillips Chemical Company
- 12.2. Market Entropy
- 12.2.1 Company's Key Areas Served
- 12.2.2 Recent Developments
- 12.3. Company Market Share Analysis 2025
- 12.3.1 Top 5 Companies Market Share Analysis
- 12.3.2 Top 3 Companies Market Share Analysis
- 12.4. List of Potential Customers
- 13. Research Methodology
List of Figures
- Figure 1: Global Petroleum Refining & Chemicals Catalysts Industry Revenue Breakdown (million, %) by Region 2025 & 2033
- Figure 2: Asia Pacific Petroleum Refining & Chemicals Catalysts Industry Revenue (million), by Material 2025 & 2033
- Figure 3: Asia Pacific Petroleum Refining & Chemicals Catalysts Industry Revenue Share (%), by Material 2025 & 2033
- Figure 4: Asia Pacific Petroleum Refining & Chemicals Catalysts Industry Revenue (million), by Application 2025 & 2033
- Figure 5: Asia Pacific Petroleum Refining & Chemicals Catalysts Industry Revenue Share (%), by Application 2025 & 2033
- Figure 6: Asia Pacific Petroleum Refining & Chemicals Catalysts Industry Revenue (million), by Country 2025 & 2033
- Figure 7: Asia Pacific Petroleum Refining & Chemicals Catalysts Industry Revenue Share (%), by Country 2025 & 2033
- Figure 8: North America Petroleum Refining & Chemicals Catalysts Industry Revenue (million), by Material 2025 & 2033
- Figure 9: North America Petroleum Refining & Chemicals Catalysts Industry Revenue Share (%), by Material 2025 & 2033
- Figure 10: North America Petroleum Refining & Chemicals Catalysts Industry Revenue (million), by Application 2025 & 2033
- Figure 11: North America Petroleum Refining & Chemicals Catalysts Industry Revenue Share (%), by Application 2025 & 2033
- Figure 12: North America Petroleum Refining & Chemicals Catalysts Industry Revenue (million), by Country 2025 & 2033
- Figure 13: North America Petroleum Refining & Chemicals Catalysts Industry Revenue Share (%), by Country 2025 & 2033
- Figure 14: Europe Petroleum Refining & Chemicals Catalysts Industry Revenue (million), by Material 2025 & 2033
- Figure 15: Europe Petroleum Refining & Chemicals Catalysts Industry Revenue Share (%), by Material 2025 & 2033
- Figure 16: Europe Petroleum Refining & Chemicals Catalysts Industry Revenue (million), by Application 2025 & 2033
- Figure 17: Europe Petroleum Refining & Chemicals Catalysts Industry Revenue Share (%), by Application 2025 & 2033
- Figure 18: Europe Petroleum Refining & Chemicals Catalysts Industry Revenue (million), by Country 2025 & 2033
- Figure 19: Europe Petroleum Refining & Chemicals Catalysts Industry Revenue Share (%), by Country 2025 & 2033
- Figure 20: South America Petroleum Refining & Chemicals Catalysts Industry Revenue (million), by Material 2025 & 2033
- Figure 21: South America Petroleum Refining & Chemicals Catalysts Industry Revenue Share (%), by Material 2025 & 2033
- Figure 22: South America Petroleum Refining & Chemicals Catalysts Industry Revenue (million), by Application 2025 & 2033
- Figure 23: South America Petroleum Refining & Chemicals Catalysts Industry Revenue Share (%), by Application 2025 & 2033
- Figure 24: South America Petroleum Refining & Chemicals Catalysts Industry Revenue (million), by Country 2025 & 2033
- Figure 25: South America Petroleum Refining & Chemicals Catalysts Industry Revenue Share (%), by Country 2025 & 2033
- Figure 26: Middle East and Africa Petroleum Refining & Chemicals Catalysts Industry Revenue (million), by Material 2025 & 2033
- Figure 27: Middle East and Africa Petroleum Refining & Chemicals Catalysts Industry Revenue Share (%), by Material 2025 & 2033
- Figure 28: Middle East and Africa Petroleum Refining & Chemicals Catalysts Industry Revenue (million), by Application 2025 & 2033
- Figure 29: Middle East and Africa Petroleum Refining & Chemicals Catalysts Industry Revenue Share (%), by Application 2025 & 2033
- Figure 30: Middle East and Africa Petroleum Refining & Chemicals Catalysts Industry Revenue (million), by Country 2025 & 2033
- Figure 31: Middle East and Africa Petroleum Refining & Chemicals Catalysts Industry Revenue Share (%), by Country 2025 & 2033
List of Tables
- Table 1: Global Petroleum Refining & Chemicals Catalysts Industry Revenue million Forecast, by Material 2020 & 2033
- Table 2: Global Petroleum Refining & Chemicals Catalysts Industry Revenue million Forecast, by Application 2020 & 2033
- Table 3: Global Petroleum Refining & Chemicals Catalysts Industry Revenue million Forecast, by Region 2020 & 2033
- Table 4: Global Petroleum Refining & Chemicals Catalysts Industry Revenue million Forecast, by Material 2020 & 2033
- Table 5: Global Petroleum Refining & Chemicals Catalysts Industry Revenue million Forecast, by Application 2020 & 2033
- Table 6: Global Petroleum Refining & Chemicals Catalysts Industry Revenue million Forecast, by Country 2020 & 2033
- Table 7: China Petroleum Refining & Chemicals Catalysts Industry Revenue (million) Forecast, by Application 2020 & 2033
- Table 8: India Petroleum Refining & Chemicals Catalysts Industry Revenue (million) Forecast, by Application 2020 & 2033
- Table 9: Japan Petroleum Refining & Chemicals Catalysts Industry Revenue (million) Forecast, by Application 2020 & 2033
- Table 10: South Korea Petroleum Refining & Chemicals Catalysts Industry Revenue (million) Forecast, by Application 2020 & 2033
- Table 11: ASEAN Countries Petroleum Refining & Chemicals Catalysts Industry Revenue (million) Forecast, by Application 2020 & 2033
- Table 12: Rest of Asia Pacific Petroleum Refining & Chemicals Catalysts Industry Revenue (million) Forecast, by Application 2020 & 2033
- Table 13: Global Petroleum Refining & Chemicals Catalysts Industry Revenue million Forecast, by Material 2020 & 2033
- Table 14: Global Petroleum Refining & Chemicals Catalysts Industry Revenue million Forecast, by Application 2020 & 2033
- Table 15: Global Petroleum Refining & Chemicals Catalysts Industry Revenue million Forecast, by Country 2020 & 2033
- Table 16: United States Petroleum Refining & Chemicals Catalysts Industry Revenue (million) Forecast, by Application 2020 & 2033
- Table 17: Canada Petroleum Refining & Chemicals Catalysts Industry Revenue (million) Forecast, by Application 2020 & 2033
- Table 18: Mexico Petroleum Refining & Chemicals Catalysts Industry Revenue (million) Forecast, by Application 2020 & 2033
- Table 19: Global Petroleum Refining & Chemicals Catalysts Industry Revenue million Forecast, by Material 2020 & 2033
- Table 20: Global Petroleum Refining & Chemicals Catalysts Industry Revenue million Forecast, by Application 2020 & 2033
- Table 21: Global Petroleum Refining & Chemicals Catalysts Industry Revenue million Forecast, by Country 2020 & 2033
- Table 22: Germany Petroleum Refining & Chemicals Catalysts Industry Revenue (million) Forecast, by Application 2020 & 2033
- Table 23: United Kingdom Petroleum Refining & Chemicals Catalysts Industry Revenue (million) Forecast, by Application 2020 & 2033
- Table 24: Italy Petroleum Refining & Chemicals Catalysts Industry Revenue (million) Forecast, by Application 2020 & 2033
- Table 25: France Petroleum Refining & Chemicals Catalysts Industry Revenue (million) Forecast, by Application 2020 & 2033
- Table 26: Rest of Europe Petroleum Refining & Chemicals Catalysts Industry Revenue (million) Forecast, by Application 2020 & 2033
- Table 27: Global Petroleum Refining & Chemicals Catalysts Industry Revenue million Forecast, by Material 2020 & 2033
- Table 28: Global Petroleum Refining & Chemicals Catalysts Industry Revenue million Forecast, by Application 2020 & 2033
- Table 29: Global Petroleum Refining & Chemicals Catalysts Industry Revenue million Forecast, by Country 2020 & 2033
- Table 30: Brazil Petroleum Refining & Chemicals Catalysts Industry Revenue (million) Forecast, by Application 2020 & 2033
- Table 31: Argentina Petroleum Refining & Chemicals Catalysts Industry Revenue (million) Forecast, by Application 2020 & 2033
- Table 32: Rest of South America Petroleum Refining & Chemicals Catalysts Industry Revenue (million) Forecast, by Application 2020 & 2033
- Table 33: Global Petroleum Refining & Chemicals Catalysts Industry Revenue million Forecast, by Material 2020 & 2033
- Table 34: Global Petroleum Refining & Chemicals Catalysts Industry Revenue million Forecast, by Application 2020 & 2033
- Table 35: Global Petroleum Refining & Chemicals Catalysts Industry Revenue million Forecast, by Country 2020 & 2033
- Table 36: Saudi Arabia Petroleum Refining & Chemicals Catalysts Industry Revenue (million) Forecast, by Application 2020 & 2033
- Table 37: South Africa Petroleum Refining & Chemicals Catalysts Industry Revenue (million) Forecast, by Application 2020 & 2033
- Table 38: Rest of Middle East and Africa Petroleum Refining & Chemicals Catalysts Industry Revenue (million) Forecast, by Application 2020 & 2033
Frequently Asked Questions
1. What is the projected Compound Annual Growth Rate (CAGR) of the Petroleum Refining & Chemicals Catalysts Industry?
The projected CAGR is approximately 4.3%.
2. Which companies are prominent players in the Petroleum Refining & Chemicals Catalysts Industry?
Key companies in the market include Chevron Phillips Chemical Company, Honeywell International Inc, W R Grace & Co, Catalytic Distillation Technologies, Exxon Mobil Corporation, INEOS Technologies, Johnson Matthey Inc, Evonik Industries AG, Wako Chemicals USA Inc, KBR Inc, BASF SE, Eka Chemicals AB, Zeochem LLC, Zeolyst International*List Not Exhaustive, Chicago Bridge & Iron Company, Dow, Bayer Technology Services, Nova Chemicals Corp, Clariant International Ltd, Eastman Chemical Co.
3. What are the main segments of the Petroleum Refining & Chemicals Catalysts Industry?
The market segments include Material, Application.
4. Can you provide details about the market size?
The market size is estimated to be USD 10096.57 million as of 2022.
5. What are some drivers contributing to market growth?
Increasing Refinery Market Output in Africa; Middle East; and Asia-Pacific; Rising Demand for Maintaining High Octane Figures.
6. What are the notable trends driving market growth?
Petroleum Refining Application to Dominate the Market.
7. Are there any restraints impacting market growth?
High Manufacturing Costs; Other Restraints.
8. Can you provide examples of recent developments in the market?
N/A
9. What pricing options are available for accessing the report?
Pricing options include single-user, multi-user, and enterprise licenses priced at USD 4750, USD 5250, and USD 8750 respectively.
10. Is the market size provided in terms of value or volume?
The market size is provided in terms of value, measured in million.
11. Are there any specific market keywords associated with the report?
Yes, the market keyword associated with the report is "Petroleum Refining & Chemicals Catalysts Industry," which aids in identifying and referencing the specific market segment covered.
12. How do I determine which pricing option suits my needs best?
The pricing options vary based on user requirements and access needs. Individual users may opt for single-user licenses, while businesses requiring broader access may choose multi-user or enterprise licenses for cost-effective access to the report.
13. Are there any additional resources or data provided in the Petroleum Refining & Chemicals Catalysts Industry report?
While the report offers comprehensive insights, it's advisable to review the specific contents or supplementary materials provided to ascertain if additional resources or data are available.
14. How can I stay updated on further developments or reports in the Petroleum Refining & Chemicals Catalysts Industry?
To stay informed about further developments, trends, and reports in the Petroleum Refining & Chemicals Catalysts Industry, consider subscribing to industry newsletters, following relevant companies and organizations, or regularly checking reputable industry news sources and publications.
Methodology
Step 1 - Identification of Relevant Samples Size from Population Database


Step 2 - Approaches for Defining Global Market Size (Value, Volume* & Price*)

Note*: In applicable scenarios
Step 3 - Data Sources
Primary Research
- Web Analytics
- Survey Reports
- Research Institute
- Latest Research Reports
- Opinion Leaders
Secondary Research
- Annual Reports
- White Paper
- Latest Press Release
- Industry Association
- Paid Database
- Investor Presentations

Step 4 - Data Triangulation
Involves using different sources of information in order to increase the validity of a study
These sources are likely to be stakeholders in a program - participants, other researchers, program staff, other community members, and so on.
Then we put all data in single framework & apply various statistical tools to find out the dynamic on the market.
During the analysis stage, feedback from the stakeholder groups would be compared to determine areas of agreement as well as areas of divergence