

Key Insights
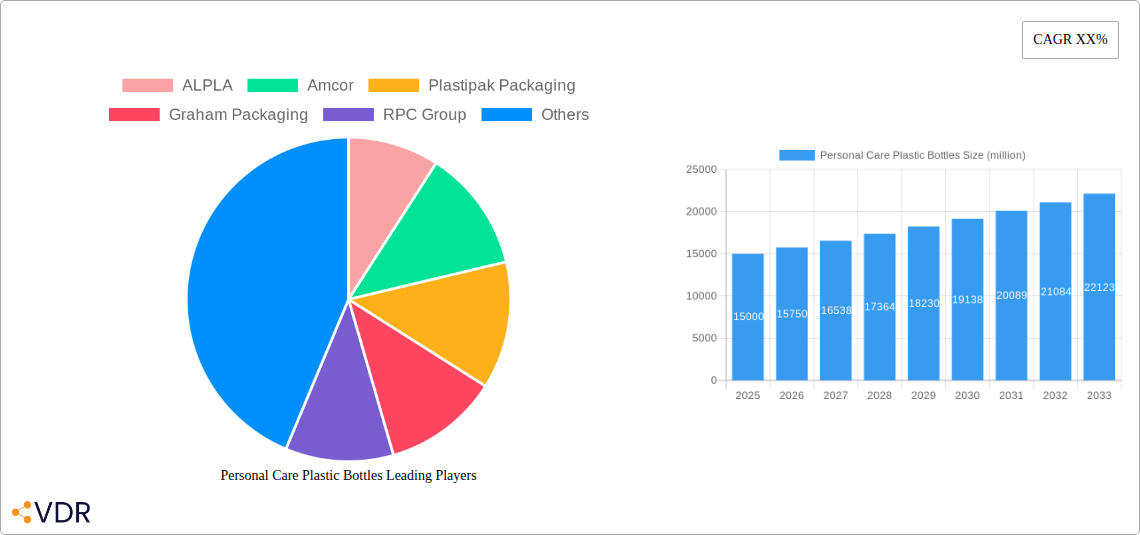
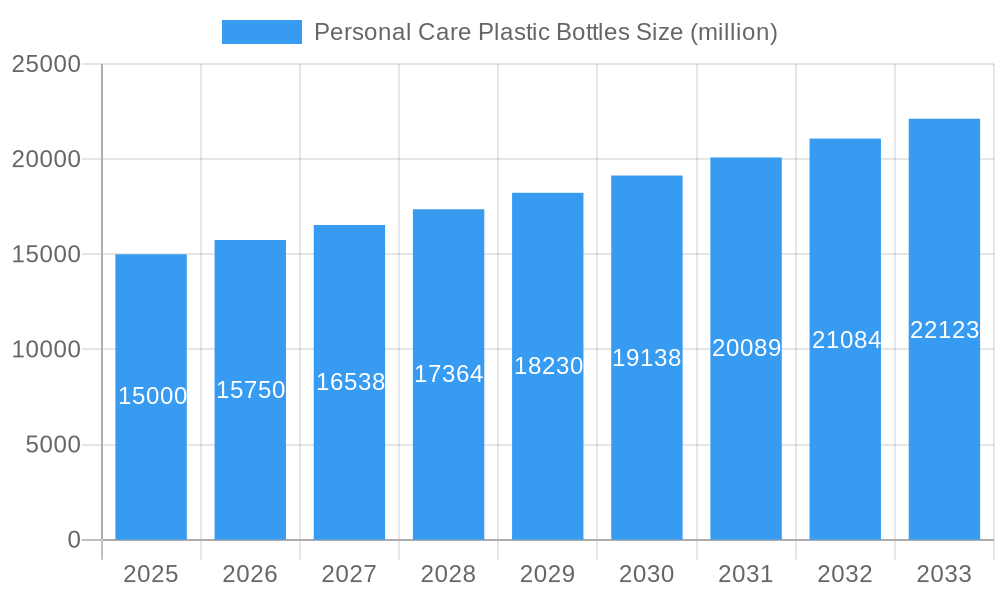
The global personal care plastic bottles market is experiencing significant expansion, driven by rising demand for convenient and portable packaging within the personal care sector. Key growth drivers include the increasing popularity of travel-sized products, a growing consumer preference for single-use packaging, and continuous innovation in bottle design and materials. Furthermore, the escalating demand for sustainable and eco-friendly packaging solutions is prompting manufacturers to invest in recyclable and biodegradable plastics, shaping the market's trajectory. The market size is projected to reach $15 billion in 2025, with a Compound Annual Growth Rate (CAGR) of 5% anticipated through 2033. North America and Europe are expected to retain substantial market shares due to high consumption and established personal care industries, while the Asia-Pacific region is poised for considerable growth, fueled by rising disposable incomes and an expanding middle class.
Personal Care Plastic Bottles Market Size (In Billion)
Leading companies such as ALPLA, Amcor, Plastipak Packaging, Graham Packaging, RPC Group, Berry Plastics, Greiner Packaging, and Alpha Packaging are actively influencing the market through strategic collaborations, mergers, acquisitions, and advancements in lightweighting and material science. Despite challenges related to plastic waste and environmental regulations, the development and adoption of sustainable packaging alternatives are expected to address these concerns. Market segmentation is anticipated to be based on material types (e.g., PET, HDPE), bottle capacity, and end-use applications (e.g., shampoo, lotions, conditioners). The forecast period from 2025 to 2033 predicts sustained growth, propelled by evolving consumer preferences, technological progress, and an increased emphasis on sustainable packaging practices.
Personal Care Plastic Bottles Company Market Share
Personal Care Plastic Bottles Market Report: 2019-2033
A comprehensive analysis of the personal care plastic bottles market, encompassing market dynamics, growth trends, regional dominance, product landscape, key players, and future outlook. This report provides invaluable insights for industry professionals, investors, and strategic decision-makers seeking to navigate this dynamic market. The study period covers 2019-2033, with a base year of 2025 and a forecast period of 2025-2033.
Personal Care Plastic Bottles Market Dynamics & Structure
This section analyzes the competitive landscape of the personal care plastic bottles market (parent market: Packaging; child market: Personal Care Packaging). We delve into market concentration, technological advancements, regulatory landscapes, competitive substitutes (e.g., glass, aluminum, biodegradable alternatives), end-user demographics (shifting consumer preferences towards sustainability), and merger & acquisition (M&A) activities.
Quantitative Insights:
- Market size in 2024: xx million units
- Projected market size in 2033: xx million units
- CAGR (2025-2033): xx%
- Market share of top 5 players in 2024: xx%
- Number of M&A deals in the historical period (2019-2024): xx
Qualitative Factors:
- High barriers to entry due to significant capital investment requirements for manufacturing facilities.
- Increasing regulatory scrutiny on plastic waste management impacting market dynamics.
- Growing consumer demand for sustainable and eco-friendly packaging solutions.
- Technological innovations in lightweighting and material science driving market growth.
Personal Care Plastic Bottles Growth Trends & Insights
This section provides a detailed analysis of the market size evolution, adoption rates of different bottle types, technological disruptions (e.g., advancements in barrier technologies, recyclable materials), and consumer behavior shifts (preference for convenience, sustainability, and aesthetics). We leverage extensive primary and secondary research to provide a comprehensive overview of the growth trajectory of this market segment.
- Detailed analysis of market size evolution from 2019 to 2024.
- Projection of market size and CAGR for the forecast period (2025-2033).
- In-depth examination of the adoption rates of various personal care plastic bottles based on material type (PET, HDPE, PP, etc.) and design.
- Assessment of technological disruptions and their impact on market growth.
- Analysis of consumer behavior shifts and their influence on product demand.
Dominant Regions, Countries, or Segments in Personal Care Plastic Bottles
This section identifies the leading regions, countries, and segments driving market growth. We analyze market share, growth potential, and key drivers such as economic policies, infrastructure development, and consumer preferences.
- North America: Dominant market due to high personal care product consumption and strong consumer demand.
- Europe: Significant market share with increasing focus on sustainability and eco-friendly packaging.
- Asia-Pacific: Fastest-growing region driven by rising disposable incomes and increasing urbanization.
Key Drivers:
- Rising disposable incomes and changing lifestyles.
- Growing demand for convenient and portable personal care products.
- Favorable regulatory environment in certain regions.
- Technological advancements in packaging materials and manufacturing processes.
Personal Care Plastic Bottles Product Landscape
This section details product innovations, applications, and performance metrics. We highlight unique selling propositions (USPs) and technological advancements, such as lightweighting, improved barrier properties, and innovative designs for enhanced functionality and aesthetics. Specific examples of innovative product features and their market impact are provided.
Key Drivers, Barriers & Challenges in Personal Care Plastic Bottles
Key Drivers:
- Increased demand for personal care products.
- Advancements in plastic materials and manufacturing technology.
- Growing adoption of convenient packaging formats.
Challenges & Restraints:
- Environmental concerns related to plastic waste.
- Stringent regulations on plastic packaging.
- Fluctuating raw material prices.
- Competition from alternative packaging materials.
Emerging Opportunities in Personal Care Plastic Bottles
This section highlights emerging trends and opportunities, such as untapped markets (e.g., developing economies), innovative applications (e.g., smart packaging), and evolving consumer preferences (e.g., demand for sustainable and recyclable packaging).
Growth Accelerators in the Personal Care Plastic Bottles Industry
Technological breakthroughs in materials science and manufacturing processes, strategic partnerships (e.g., collaborations between packaging manufacturers and personal care brands), and expansion into new markets are key growth catalysts in this sector. The report will detail specific examples of these accelerators and their potential impact on market growth.
Key Players Shaping the Personal Care Plastic Bottles Market
- ALPLA
- Amcor
- Plastipak Packaging
- Graham Packaging
- RPC Group (Note: RPC Group has undergone restructuring, information may need to be adjusted accordingly)
- Berry Plastics
- Greiner Packaging
- Alpha Packaging
Notable Milestones in Personal Care Plastic Bottles Sector
- 2020-03: Introduction of a new recyclable PET bottle by Berry Plastics.
- 2021-11: ALPLA invests in a new lightweighting technology for HDPE bottles.
- (Add other significant milestones here)
In-Depth Personal Care Plastic Bottles Market Outlook
The personal care plastic bottles market is poised for significant growth driven by factors such as increasing demand for convenience, technological innovation, and the development of sustainable packaging solutions. Strategic opportunities exist for companies that can effectively address the challenges related to plastic waste and meet the evolving demands of consumers. The report offers strategic recommendations to capitalize on these opportunities and achieve sustainable growth in the market.
Personal Care Plastic Bottles Segmentation
-
1. Application
- 1.1. Face
- 1.2. Body
-
2. Types
- 2.1. PET
- 2.2. PP
Personal Care Plastic Bottles Segmentation By Geography
-
1. North America
- 1.1. United States
- 1.2. Canada
- 1.3. Mexico
-
2. South America
- 2.1. Brazil
- 2.2. Argentina
- 2.3. Rest of South America
-
3. Europe
- 3.1. United Kingdom
- 3.2. Germany
- 3.3. France
- 3.4. Italy
- 3.5. Spain
- 3.6. Russia
- 3.7. Benelux
- 3.8. Nordics
- 3.9. Rest of Europe
-
4. Middle East & Africa
- 4.1. Turkey
- 4.2. Israel
- 4.3. GCC
- 4.4. North Africa
- 4.5. South Africa
- 4.6. Rest of Middle East & Africa
-
5. Asia Pacific
- 5.1. China
- 5.2. India
- 5.3. Japan
- 5.4. South Korea
- 5.5. ASEAN
- 5.6. Oceania
- 5.7. Rest of Asia Pacific

Personal Care Plastic Bottles Regional Market Share
Geographic Coverage of Personal Care Plastic Bottles
Personal Care Plastic Bottles REPORT HIGHLIGHTS
| Aspects | Details |
|---|---|
| Study Period | 2020-2034 |
| Base Year | 2025 |
| Estimated Year | 2026 |
| Forecast Period | 2026-2034 |
| Historical Period | 2020-2025 |
| Growth Rate | CAGR of 5% from 2020-2034 |
| Segmentation |
|
Table of Contents
- 1. Introduction
- 1.1. Research Scope
- 1.2. Market Segmentation
- 1.3. Research Objective
- 1.4. Definitions and Assumptions
- 2. Executive Summary
- 2.1. Market Snapshot
- 3. Market Dynamics
- 3.1. Market Drivers
- 3.2. Market Restrains
- 3.3. Market Trends
- 3.4. Market Opportunities
- 4. Market Factor Analysis
- 4.1. Porters Five Forces
- 4.1.1. Bargaining Power of Suppliers
- 4.1.2. Bargaining Power of Buyers
- 4.1.3. Threat of New Entrants
- 4.1.4. Threat of Substitutes
- 4.1.5. Competitive Rivalry
- 4.2. PESTEL analysis
- 4.3. BCG Analysis
- 4.3.1. Stars (High Growth, High Market Share)
- 4.3.2. Cash Cows (Low Growth, High Market Share)
- 4.3.3. Question Mark (High Growth, Low Market Share)
- 4.3.4. Dogs (Low Growth, Low Market Share)
- 4.4. Ansoff Matrix Analysis
- 4.5. Supply Chain Analysis
- 4.6. Regulatory Landscape
- 4.7. Current Market Potential and Opportunity Assessment (TAM–SAM–SOM Framework)
- 4.8. VDR Analyst Note
- 4.1. Porters Five Forces
- 5. Market Analysis, Insights and Forecast 2021-2033
- 5.1. Market Analysis, Insights and Forecast - by Application
- 5.1.1. Face
- 5.1.2. Body
- 5.2. Market Analysis, Insights and Forecast - by Types
- 5.2.1. PET
- 5.2.2. PP
- 5.3. Market Analysis, Insights and Forecast - by Region
- 5.3.1. North America
- 5.3.2. South America
- 5.3.3. Europe
- 5.3.4. Middle East & Africa
- 5.3.5. Asia Pacific
- 5.1. Market Analysis, Insights and Forecast - by Application
- 6. Global Personal Care Plastic Bottles Analysis, Insights and Forecast, 2021-2033
- 6.1. Market Analysis, Insights and Forecast - by Application
- 6.1.1. Face
- 6.1.2. Body
- 6.2. Market Analysis, Insights and Forecast - by Types
- 6.2.1. PET
- 6.2.2. PP
- 6.1. Market Analysis, Insights and Forecast - by Application
- 7. North America Personal Care Plastic Bottles Analysis, Insights and Forecast, 2021-2033
- 7.1. Market Analysis, Insights and Forecast - by Application
- 7.1.1. Face
- 7.1.2. Body
- 7.2. Market Analysis, Insights and Forecast - by Types
- 7.2.1. PET
- 7.2.2. PP
- 7.1. Market Analysis, Insights and Forecast - by Application
- 8. South America Personal Care Plastic Bottles Analysis, Insights and Forecast, 2021-2033
- 8.1. Market Analysis, Insights and Forecast - by Application
- 8.1.1. Face
- 8.1.2. Body
- 8.2. Market Analysis, Insights and Forecast - by Types
- 8.2.1. PET
- 8.2.2. PP
- 8.1. Market Analysis, Insights and Forecast - by Application
- 9. Europe Personal Care Plastic Bottles Analysis, Insights and Forecast, 2021-2033
- 9.1. Market Analysis, Insights and Forecast - by Application
- 9.1.1. Face
- 9.1.2. Body
- 9.2. Market Analysis, Insights and Forecast - by Types
- 9.2.1. PET
- 9.2.2. PP
- 9.1. Market Analysis, Insights and Forecast - by Application
- 10. Middle East & Africa Personal Care Plastic Bottles Analysis, Insights and Forecast, 2021-2033
- 10.1. Market Analysis, Insights and Forecast - by Application
- 10.1.1. Face
- 10.1.2. Body
- 10.2. Market Analysis, Insights and Forecast - by Types
- 10.2.1. PET
- 10.2.2. PP
- 10.1. Market Analysis, Insights and Forecast - by Application
- 11. Asia Pacific Personal Care Plastic Bottles Analysis, Insights and Forecast, 2021-2033
- 11.1. Market Analysis, Insights and Forecast - by Application
- 11.1.1. Face
- 11.1.2. Body
- 11.2. Market Analysis, Insights and Forecast - by Types
- 11.2.1. PET
- 11.2.2. PP
- 11.1. Market Analysis, Insights and Forecast - by Application
- 12. Competitive Analysis
- 12.1. Company Profiles
- 12.1.1 ALPLA
- 12.1.1.1. Company Overview
- 12.1.1.2. Products
- 12.1.1.3. Company Financials
- 12.1.1.4. SWOT Analysis
- 12.1.2 Amcor
- 12.1.2.1. Company Overview
- 12.1.2.2. Products
- 12.1.2.3. Company Financials
- 12.1.2.4. SWOT Analysis
- 12.1.3 Plastipak Packaging
- 12.1.3.1. Company Overview
- 12.1.3.2. Products
- 12.1.3.3. Company Financials
- 12.1.3.4. SWOT Analysis
- 12.1.4 Graham Packaging
- 12.1.4.1. Company Overview
- 12.1.4.2. Products
- 12.1.4.3. Company Financials
- 12.1.4.4. SWOT Analysis
- 12.1.5 RPC Group
- 12.1.5.1. Company Overview
- 12.1.5.2. Products
- 12.1.5.3. Company Financials
- 12.1.5.4. SWOT Analysis
- 12.1.6 Berry Plastics
- 12.1.6.1. Company Overview
- 12.1.6.2. Products
- 12.1.6.3. Company Financials
- 12.1.6.4. SWOT Analysis
- 12.1.7 Greiner Packaging
- 12.1.7.1. Company Overview
- 12.1.7.2. Products
- 12.1.7.3. Company Financials
- 12.1.7.4. SWOT Analysis
- 12.1.8 Alpha Packaging
- 12.1.8.1. Company Overview
- 12.1.8.2. Products
- 12.1.8.3. Company Financials
- 12.1.8.4. SWOT Analysis
- 12.1.1 ALPLA
- 12.2. Market Entropy
- 12.2.1 Company's Key Areas Served
- 12.2.2 Recent Developments
- 12.3. Company Market Share Analysis 2025
- 12.3.1 Top 5 Companies Market Share Analysis
- 12.3.2 Top 3 Companies Market Share Analysis
- 12.4. List of Potential Customers
- 13. Research Methodology
List of Figures
- Figure 1: Global Personal Care Plastic Bottles Revenue Breakdown (billion, %) by Region 2025 & 2033
- Figure 2: North America Personal Care Plastic Bottles Revenue (billion), by Application 2025 & 2033
- Figure 3: North America Personal Care Plastic Bottles Revenue Share (%), by Application 2025 & 2033
- Figure 4: North America Personal Care Plastic Bottles Revenue (billion), by Types 2025 & 2033
- Figure 5: North America Personal Care Plastic Bottles Revenue Share (%), by Types 2025 & 2033
- Figure 6: North America Personal Care Plastic Bottles Revenue (billion), by Country 2025 & 2033
- Figure 7: North America Personal Care Plastic Bottles Revenue Share (%), by Country 2025 & 2033
- Figure 8: South America Personal Care Plastic Bottles Revenue (billion), by Application 2025 & 2033
- Figure 9: South America Personal Care Plastic Bottles Revenue Share (%), by Application 2025 & 2033
- Figure 10: South America Personal Care Plastic Bottles Revenue (billion), by Types 2025 & 2033
- Figure 11: South America Personal Care Plastic Bottles Revenue Share (%), by Types 2025 & 2033
- Figure 12: South America Personal Care Plastic Bottles Revenue (billion), by Country 2025 & 2033
- Figure 13: South America Personal Care Plastic Bottles Revenue Share (%), by Country 2025 & 2033
- Figure 14: Europe Personal Care Plastic Bottles Revenue (billion), by Application 2025 & 2033
- Figure 15: Europe Personal Care Plastic Bottles Revenue Share (%), by Application 2025 & 2033
- Figure 16: Europe Personal Care Plastic Bottles Revenue (billion), by Types 2025 & 2033
- Figure 17: Europe Personal Care Plastic Bottles Revenue Share (%), by Types 2025 & 2033
- Figure 18: Europe Personal Care Plastic Bottles Revenue (billion), by Country 2025 & 2033
- Figure 19: Europe Personal Care Plastic Bottles Revenue Share (%), by Country 2025 & 2033
- Figure 20: Middle East & Africa Personal Care Plastic Bottles Revenue (billion), by Application 2025 & 2033
- Figure 21: Middle East & Africa Personal Care Plastic Bottles Revenue Share (%), by Application 2025 & 2033
- Figure 22: Middle East & Africa Personal Care Plastic Bottles Revenue (billion), by Types 2025 & 2033
- Figure 23: Middle East & Africa Personal Care Plastic Bottles Revenue Share (%), by Types 2025 & 2033
- Figure 24: Middle East & Africa Personal Care Plastic Bottles Revenue (billion), by Country 2025 & 2033
- Figure 25: Middle East & Africa Personal Care Plastic Bottles Revenue Share (%), by Country 2025 & 2033
- Figure 26: Asia Pacific Personal Care Plastic Bottles Revenue (billion), by Application 2025 & 2033
- Figure 27: Asia Pacific Personal Care Plastic Bottles Revenue Share (%), by Application 2025 & 2033
- Figure 28: Asia Pacific Personal Care Plastic Bottles Revenue (billion), by Types 2025 & 2033
- Figure 29: Asia Pacific Personal Care Plastic Bottles Revenue Share (%), by Types 2025 & 2033
- Figure 30: Asia Pacific Personal Care Plastic Bottles Revenue (billion), by Country 2025 & 2033
- Figure 31: Asia Pacific Personal Care Plastic Bottles Revenue Share (%), by Country 2025 & 2033
List of Tables
- Table 1: Global Personal Care Plastic Bottles Revenue billion Forecast, by Application 2020 & 2033
- Table 2: Global Personal Care Plastic Bottles Revenue billion Forecast, by Types 2020 & 2033
- Table 3: Global Personal Care Plastic Bottles Revenue billion Forecast, by Region 2020 & 2033
- Table 4: Global Personal Care Plastic Bottles Revenue billion Forecast, by Application 2020 & 2033
- Table 5: Global Personal Care Plastic Bottles Revenue billion Forecast, by Types 2020 & 2033
- Table 6: Global Personal Care Plastic Bottles Revenue billion Forecast, by Country 2020 & 2033
- Table 7: United States Personal Care Plastic Bottles Revenue (billion) Forecast, by Application 2020 & 2033
- Table 8: Canada Personal Care Plastic Bottles Revenue (billion) Forecast, by Application 2020 & 2033
- Table 9: Mexico Personal Care Plastic Bottles Revenue (billion) Forecast, by Application 2020 & 2033
- Table 10: Global Personal Care Plastic Bottles Revenue billion Forecast, by Application 2020 & 2033
- Table 11: Global Personal Care Plastic Bottles Revenue billion Forecast, by Types 2020 & 2033
- Table 12: Global Personal Care Plastic Bottles Revenue billion Forecast, by Country 2020 & 2033
- Table 13: Brazil Personal Care Plastic Bottles Revenue (billion) Forecast, by Application 2020 & 2033
- Table 14: Argentina Personal Care Plastic Bottles Revenue (billion) Forecast, by Application 2020 & 2033
- Table 15: Rest of South America Personal Care Plastic Bottles Revenue (billion) Forecast, by Application 2020 & 2033
- Table 16: Global Personal Care Plastic Bottles Revenue billion Forecast, by Application 2020 & 2033
- Table 17: Global Personal Care Plastic Bottles Revenue billion Forecast, by Types 2020 & 2033
- Table 18: Global Personal Care Plastic Bottles Revenue billion Forecast, by Country 2020 & 2033
- Table 19: United Kingdom Personal Care Plastic Bottles Revenue (billion) Forecast, by Application 2020 & 2033
- Table 20: Germany Personal Care Plastic Bottles Revenue (billion) Forecast, by Application 2020 & 2033
- Table 21: France Personal Care Plastic Bottles Revenue (billion) Forecast, by Application 2020 & 2033
- Table 22: Italy Personal Care Plastic Bottles Revenue (billion) Forecast, by Application 2020 & 2033
- Table 23: Spain Personal Care Plastic Bottles Revenue (billion) Forecast, by Application 2020 & 2033
- Table 24: Russia Personal Care Plastic Bottles Revenue (billion) Forecast, by Application 2020 & 2033
- Table 25: Benelux Personal Care Plastic Bottles Revenue (billion) Forecast, by Application 2020 & 2033
- Table 26: Nordics Personal Care Plastic Bottles Revenue (billion) Forecast, by Application 2020 & 2033
- Table 27: Rest of Europe Personal Care Plastic Bottles Revenue (billion) Forecast, by Application 2020 & 2033
- Table 28: Global Personal Care Plastic Bottles Revenue billion Forecast, by Application 2020 & 2033
- Table 29: Global Personal Care Plastic Bottles Revenue billion Forecast, by Types 2020 & 2033
- Table 30: Global Personal Care Plastic Bottles Revenue billion Forecast, by Country 2020 & 2033
- Table 31: Turkey Personal Care Plastic Bottles Revenue (billion) Forecast, by Application 2020 & 2033
- Table 32: Israel Personal Care Plastic Bottles Revenue (billion) Forecast, by Application 2020 & 2033
- Table 33: GCC Personal Care Plastic Bottles Revenue (billion) Forecast, by Application 2020 & 2033
- Table 34: North Africa Personal Care Plastic Bottles Revenue (billion) Forecast, by Application 2020 & 2033
- Table 35: South Africa Personal Care Plastic Bottles Revenue (billion) Forecast, by Application 2020 & 2033
- Table 36: Rest of Middle East & Africa Personal Care Plastic Bottles Revenue (billion) Forecast, by Application 2020 & 2033
- Table 37: Global Personal Care Plastic Bottles Revenue billion Forecast, by Application 2020 & 2033
- Table 38: Global Personal Care Plastic Bottles Revenue billion Forecast, by Types 2020 & 2033
- Table 39: Global Personal Care Plastic Bottles Revenue billion Forecast, by Country 2020 & 2033
- Table 40: China Personal Care Plastic Bottles Revenue (billion) Forecast, by Application 2020 & 2033
- Table 41: India Personal Care Plastic Bottles Revenue (billion) Forecast, by Application 2020 & 2033
- Table 42: Japan Personal Care Plastic Bottles Revenue (billion) Forecast, by Application 2020 & 2033
- Table 43: South Korea Personal Care Plastic Bottles Revenue (billion) Forecast, by Application 2020 & 2033
- Table 44: ASEAN Personal Care Plastic Bottles Revenue (billion) Forecast, by Application 2020 & 2033
- Table 45: Oceania Personal Care Plastic Bottles Revenue (billion) Forecast, by Application 2020 & 2033
- Table 46: Rest of Asia Pacific Personal Care Plastic Bottles Revenue (billion) Forecast, by Application 2020 & 2033
Frequently Asked Questions
1. What is the projected Compound Annual Growth Rate (CAGR) of the Personal Care Plastic Bottles?
The projected CAGR is approximately 5%.
2. Which companies are prominent players in the Personal Care Plastic Bottles?
Key companies in the market include ALPLA, Amcor, Plastipak Packaging, Graham Packaging, RPC Group, Berry Plastics, Greiner Packaging, Alpha Packaging.
3. What are the main segments of the Personal Care Plastic Bottles?
The market segments include Application, Types.
4. Can you provide details about the market size?
The market size is estimated to be USD 15 billion as of 2022.
5. What are some drivers contributing to market growth?
N/A
6. What are the notable trends driving market growth?
N/A
7. Are there any restraints impacting market growth?
N/A
8. Can you provide examples of recent developments in the market?
N/A
9. What pricing options are available for accessing the report?
Pricing options include single-user, multi-user, and enterprise licenses priced at USD 2900.00, USD 4350.00, and USD 5800.00 respectively.
10. Is the market size provided in terms of value or volume?
The market size is provided in terms of value, measured in billion.
11. Are there any specific market keywords associated with the report?
Yes, the market keyword associated with the report is "Personal Care Plastic Bottles," which aids in identifying and referencing the specific market segment covered.
12. How do I determine which pricing option suits my needs best?
The pricing options vary based on user requirements and access needs. Individual users may opt for single-user licenses, while businesses requiring broader access may choose multi-user or enterprise licenses for cost-effective access to the report.
13. Are there any additional resources or data provided in the Personal Care Plastic Bottles report?
While the report offers comprehensive insights, it's advisable to review the specific contents or supplementary materials provided to ascertain if additional resources or data are available.
14. How can I stay updated on further developments or reports in the Personal Care Plastic Bottles?
To stay informed about further developments, trends, and reports in the Personal Care Plastic Bottles, consider subscribing to industry newsletters, following relevant companies and organizations, or regularly checking reputable industry news sources and publications.
Methodology
Step 1 - Identification of Relevant Samples Size from Population Database


Step 2 - Approaches for Defining Global Market Size (Value, Volume* & Price*)

Note*: In applicable scenarios
Step 3 - Data Sources
Primary Research
- Web Analytics
- Survey Reports
- Research Institute
- Latest Research Reports
- Opinion Leaders
Secondary Research
- Annual Reports
- White Paper
- Latest Press Release
- Industry Association
- Paid Database
- Investor Presentations

Step 4 - Data Triangulation
Involves using different sources of information in order to increase the validity of a study
These sources are likely to be stakeholders in a program - participants, other researchers, program staff, other community members, and so on.
Then we put all data in single framework & apply various statistical tools to find out the dynamic on the market.
During the analysis stage, feedback from the stakeholder groups would be compared to determine areas of agreement as well as areas of divergence