

Key Insights
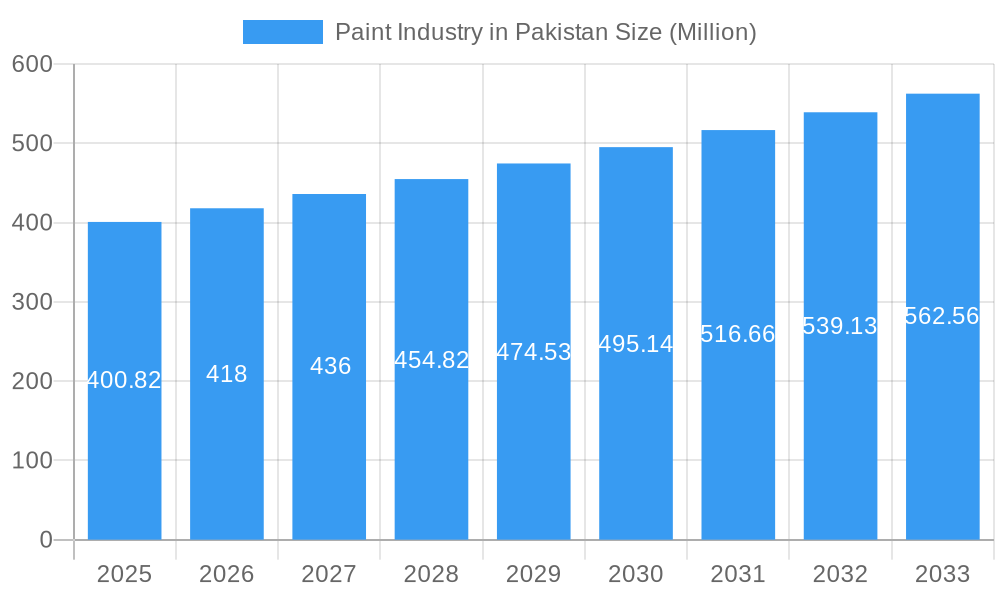
The Pakistani paint industry, valued at $400.82 million in 2025, is projected to experience robust growth, driven by a burgeoning construction sector, increasing urbanization, and rising disposable incomes fueling demand for home improvements and renovations. The 4.18% CAGR (Compound Annual Growth Rate) from 2019-2033 indicates a steady expansion, with key segments like architectural coatings benefiting significantly from infrastructure development projects and government initiatives promoting housing. Waterborne paints are expected to dominate the technology segment due to growing environmental concerns and stricter regulations, while the acrylic resin type will likely maintain its leading position due to its versatility and cost-effectiveness. Major players like AkzoNobel, Jotun, and Berger Paints Pakistan Limited are leveraging their established brand presence and distribution networks to maintain market share, while smaller, local companies focus on niche markets and price competitiveness. Challenges include fluctuating raw material prices, import dependencies, and potential economic volatility impacting consumer spending. The growth trajectory, however, remains positive, indicating promising opportunities for both established players and new entrants looking to capitalize on the expanding market.
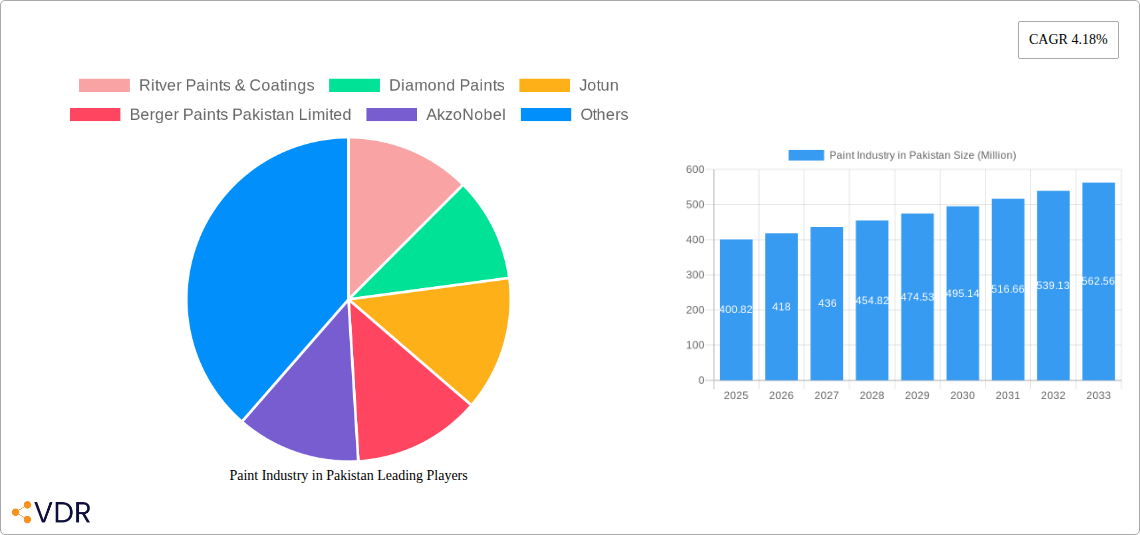
Paint Industry in Pakistan Market Size (In Million)
Despite some challenges, the future of the Pakistani paint industry appears bright. The continued growth of the construction industry, driven by both public and private investment, is a major factor contributing to the positive outlook. Further development of the automotive and industrial sectors will also stimulate demand for specialized coatings. Innovation in paint technology, such as the increasing adoption of waterborne paints, will continue to drive market growth. Increased consumer awareness of sustainable and environmentally friendly paints is further shaping market preferences, creating opportunities for companies that offer such products. Competition will likely intensify, leading to price pressures and further innovation in product offerings. To succeed in this increasingly competitive market, companies will need to focus on product quality, branding, efficient distribution networks, and adaptation to evolving consumer preferences.
Paint Industry in Pakistan Company Market Share
Paint Industry in Pakistan: A Comprehensive Market Report (2019-2033)
This in-depth report provides a comprehensive analysis of the Pakistani paint industry, encompassing market dynamics, growth trends, competitive landscape, and future outlook. The study period covers 2019-2033, with 2025 as the base year and forecast period spanning 2025-2033. This report is invaluable for industry professionals, investors, and researchers seeking a thorough understanding of this dynamic market.
Paint Industry in Pakistan Market Dynamics & Structure
The Pakistani paint market, valued at xx Million units in 2024, exhibits a moderately concentrated structure with key players like Berger Paints Pakistan Limited, AkzoNobel, and Jotun holding significant market share. However, numerous smaller players, including Diamond Paints and Gobi's Paints, contribute to a competitive landscape. Technological innovation, primarily driven by the shift towards eco-friendly waterborne paints, is a key driver. Regulatory frameworks focusing on environmental standards and product quality influence market dynamics. The market also faces competition from imported paints. M&A activity remains relatively low, with few significant deals recorded in recent years (xx deals in the last 5 years).
- Market Concentration: Moderately concentrated, with top 5 players holding approximately xx% market share.
- Technological Innovation: Strong push towards waterborne paints, driven by environmental concerns and government regulations.
- Regulatory Framework: Emphasis on quality control and environmental standards impacting product formulations.
- Competitive Substitutes: Imported paints and alternative coatings present competitive pressure.
- End-User Demographics: Growth driven by increasing urbanization, construction activity, and rising disposable incomes.
- M&A Trends: Limited M&A activity; potential for consolidation in the coming years.
Paint Industry in Pakistan Growth Trends & Insights
The Pakistani paint market has witnessed steady growth throughout the historical period (2019-2024), fueled by robust construction activity and increasing demand across various end-user industries. The market size is projected to reach xx Million units by 2025, exhibiting a CAGR of xx% during the forecast period (2025-2033). Adoption of advanced paint technologies, such as waterborne and specialized coatings, is increasing, albeit at a moderate pace. Consumer preferences are shifting towards higher-quality, durable paints, with a growing emphasis on aesthetics and eco-friendliness. Technological disruptions are primarily driven by innovations in resin types and formulation technologies, enhancing product performance and reducing environmental impact.
Dominant Regions, Countries, or Segments in Paint Industry in Pakistan
The architectural segment dominates the Pakistani paint market, accounting for xx% of the total market value in 2024. This is followed by the industrial coatings and automotive segments. Within technology, waterborne paints are gaining traction, driven by environmental regulations and consumer preference for eco-friendly products. Among resin types, acrylic resins hold the largest market share (xx%). Punjab province leads in terms of regional market share due to higher construction activity and industrial development.
- Leading Segment: Architectural coatings (xx% market share in 2024).
- Growth Drivers: Urbanization, infrastructure development, increasing disposable incomes, and government initiatives promoting construction.
- Technological Dominance: Waterborne paints and Acrylic resins.
- Regional Dominance: Punjab province, due to high industrial activity and construction.
Paint Industry in Pakistan Product Landscape
The Pakistani paint market offers a diverse range of products catering to various applications. Innovations focus on enhancing durability, weather resistance, and aesthetic appeal. Waterborne paints, with their low VOC content, are gaining prominence. Key performance metrics include hiding power, gloss retention, and scrub resistance. The market also features specialized coatings for specific applications such as wood finishes, automotive coatings, and industrial coatings.
Key Drivers, Barriers & Challenges in Paint Industry in Pakistan
Key Drivers:
- Rapid urbanization and infrastructure development.
- Growing construction sector and real estate market.
- Rising disposable incomes and increased consumer spending.
- Government initiatives to promote housing and infrastructure projects.
Challenges:
- Fluctuating raw material prices (impact: xx% increase in production costs in 2024).
- Competition from imported paints (market share of imported paints: xx%).
- Supply chain disruptions (average downtime: xx days in 2024).
- Regulatory complexities and environmental concerns.
Emerging Opportunities in Paint Industry in Pakistan
The Pakistani paint industry offers several emerging opportunities, including:
- Expansion into untapped rural markets.
- Development of specialized coatings for niche applications.
- Increasing demand for eco-friendly, sustainable paints.
- Adoption of digital marketing and e-commerce channels.
Growth Accelerators in the Paint Industry in Pakistan Industry
Long-term growth in the Pakistani paint industry will be fueled by technological advancements, strategic partnerships, and government support for infrastructure development. The adoption of sustainable manufacturing practices, coupled with innovative product offerings, will be crucial in ensuring continued market expansion.
Key Players Shaping the Paint Industry in Pakistan Market
- Ritver Paints & Coatings
- Diamond Paints
- Jotun
- Berger Paints Pakistan Limited
- AkzoNobel
- Kansai Paints
- Happilac Paints
- Nippon Paint
- Gobi's Paints
- Brighto Paints
- Buxly Paints Limited
Notable Milestones in Paint Industry in Pakistan Sector
- June 2021: Gobi's Paints expands into the European market (UK).
- March 2022: AkzoNobel announces a new manufacturing facility in Faisalabad, Pakistan.
In-Depth Paint Industry in Pakistan Market Outlook
The Pakistani paint market holds significant growth potential, driven by long-term economic growth, urbanization, and infrastructure development. Strategic investments in research and development, coupled with the adoption of sustainable practices, will be crucial for companies to capitalize on future market opportunities. The focus on eco-friendly and high-performance coatings will be key to driving market expansion in the coming years.
Paint Industry in Pakistan Segmentation
-
1. Resin Type
- 1.1. Acrylic
- 1.2. Alkyd
- 1.3. Polyurethane
- 1.4. Epoxy
- 1.5. Polyester
- 1.6. Other Resin Types
-
2. Technology
- 2.1. Waterborne
- 2.2. Solvent-borne
-
3. End-user Industry
- 3.1. Architectural
- 3.2. Automotive
- 3.3. Wood
- 3.4. Industrial Coatings
- 3.5. Transportation
- 3.6. Packaging
Paint Industry in Pakistan Segmentation By Geography
-
1. North America
- 1.1. United States
- 1.2. Canada
- 1.3. Mexico
-
2. South America
- 2.1. Brazil
- 2.2. Argentina
- 2.3. Rest of South America
-
3. Europe
- 3.1. United Kingdom
- 3.2. Germany
- 3.3. France
- 3.4. Italy
- 3.5. Spain
- 3.6. Russia
- 3.7. Benelux
- 3.8. Nordics
- 3.9. Rest of Europe
-
4. Middle East & Africa
- 4.1. Turkey
- 4.2. Israel
- 4.3. GCC
- 4.4. North Africa
- 4.5. South Africa
- 4.6. Rest of Middle East & Africa
-
5. Asia Pacific
- 5.1. China
- 5.2. India
- 5.3. Japan
- 5.4. South Korea
- 5.5. ASEAN
- 5.6. Oceania
- 5.7. Rest of Asia Pacific
Paint Industry in Pakistan Regional Market Share
Geographic Coverage of Paint Industry in Pakistan
Paint Industry in Pakistan REPORT HIGHLIGHTS
| Aspects | Details |
|---|---|
| Study Period | 2020-2034 |
| Base Year | 2025 |
| Estimated Year | 2026 |
| Forecast Period | 2026-2034 |
| Historical Period | 2020-2025 |
| Growth Rate | CAGR of 4.18% from 2020-2034 |
| Segmentation |
|
Table of Contents
- 1. Introduction
- 1.1. Research Scope
- 1.2. Market Segmentation
- 1.3. Research Objective
- 1.4. Definitions and Assumptions
- 2. Executive Summary
- 2.1. Market Snapshot
- 3. Market Dynamics
- 3.1. Market Drivers
- 3.2. Market Restrains
- 3.3. Market Trends
- 3.4. Market Opportunities
- 4. Market Factor Analysis
- 4.1. Porters Five Forces
- 4.1.1. Bargaining Power of Suppliers
- 4.1.2. Bargaining Power of Buyers
- 4.1.3. Threat of New Entrants
- 4.1.4. Threat of Substitutes
- 4.1.5. Competitive Rivalry
- 4.2. PESTEL analysis
- 4.3. BCG Analysis
- 4.3.1. Stars (High Growth, High Market Share)
- 4.3.2. Cash Cows (Low Growth, High Market Share)
- 4.3.3. Question Mark (High Growth, Low Market Share)
- 4.3.4. Dogs (Low Growth, Low Market Share)
- 4.4. Ansoff Matrix Analysis
- 4.5. Supply Chain Analysis
- 4.6. Regulatory Landscape
- 4.7. Current Market Potential and Opportunity Assessment (TAM–SAM–SOM Framework)
- 4.8. VDR Analyst Note
- 4.1. Porters Five Forces
- 5. Market Analysis, Insights and Forecast 2021-2033
- 5.1. Market Analysis, Insights and Forecast - by Resin Type
- 5.1.1. Acrylic
- 5.1.2. Alkyd
- 5.1.3. Polyurethane
- 5.1.4. Epoxy
- 5.1.5. Polyester
- 5.1.6. Other Resin Types
- 5.2. Market Analysis, Insights and Forecast - by Technology
- 5.2.1. Waterborne
- 5.2.2. Solvent-borne
- 5.3. Market Analysis, Insights and Forecast - by End-user Industry
- 5.3.1. Architectural
- 5.3.2. Automotive
- 5.3.3. Wood
- 5.3.4. Industrial Coatings
- 5.3.5. Transportation
- 5.3.6. Packaging
- 5.4. Market Analysis, Insights and Forecast - by Region
- 5.4.1. North America
- 5.4.2. South America
- 5.4.3. Europe
- 5.4.4. Middle East & Africa
- 5.4.5. Asia Pacific
- 5.1. Market Analysis, Insights and Forecast - by Resin Type
- 6. Global Paint Industry in Pakistan Analysis, Insights and Forecast, 2021-2033
- 6.1. Market Analysis, Insights and Forecast - by Resin Type
- 6.1.1. Acrylic
- 6.1.2. Alkyd
- 6.1.3. Polyurethane
- 6.1.4. Epoxy
- 6.1.5. Polyester
- 6.1.6. Other Resin Types
- 6.2. Market Analysis, Insights and Forecast - by Technology
- 6.2.1. Waterborne
- 6.2.2. Solvent-borne
- 6.3. Market Analysis, Insights and Forecast - by End-user Industry
- 6.3.1. Architectural
- 6.3.2. Automotive
- 6.3.3. Wood
- 6.3.4. Industrial Coatings
- 6.3.5. Transportation
- 6.3.6. Packaging
- 6.1. Market Analysis, Insights and Forecast - by Resin Type
- 7. North America Paint Industry in Pakistan Analysis, Insights and Forecast, 2021-2033
- 7.1. Market Analysis, Insights and Forecast - by Resin Type
- 7.1.1. Acrylic
- 7.1.2. Alkyd
- 7.1.3. Polyurethane
- 7.1.4. Epoxy
- 7.1.5. Polyester
- 7.1.6. Other Resin Types
- 7.2. Market Analysis, Insights and Forecast - by Technology
- 7.2.1. Waterborne
- 7.2.2. Solvent-borne
- 7.3. Market Analysis, Insights and Forecast - by End-user Industry
- 7.3.1. Architectural
- 7.3.2. Automotive
- 7.3.3. Wood
- 7.3.4. Industrial Coatings
- 7.3.5. Transportation
- 7.3.6. Packaging
- 7.1. Market Analysis, Insights and Forecast - by Resin Type
- 8. South America Paint Industry in Pakistan Analysis, Insights and Forecast, 2021-2033
- 8.1. Market Analysis, Insights and Forecast - by Resin Type
- 8.1.1. Acrylic
- 8.1.2. Alkyd
- 8.1.3. Polyurethane
- 8.1.4. Epoxy
- 8.1.5. Polyester
- 8.1.6. Other Resin Types
- 8.2. Market Analysis, Insights and Forecast - by Technology
- 8.2.1. Waterborne
- 8.2.2. Solvent-borne
- 8.3. Market Analysis, Insights and Forecast - by End-user Industry
- 8.3.1. Architectural
- 8.3.2. Automotive
- 8.3.3. Wood
- 8.3.4. Industrial Coatings
- 8.3.5. Transportation
- 8.3.6. Packaging
- 8.1. Market Analysis, Insights and Forecast - by Resin Type
- 9. Europe Paint Industry in Pakistan Analysis, Insights and Forecast, 2021-2033
- 9.1. Market Analysis, Insights and Forecast - by Resin Type
- 9.1.1. Acrylic
- 9.1.2. Alkyd
- 9.1.3. Polyurethane
- 9.1.4. Epoxy
- 9.1.5. Polyester
- 9.1.6. Other Resin Types
- 9.2. Market Analysis, Insights and Forecast - by Technology
- 9.2.1. Waterborne
- 9.2.2. Solvent-borne
- 9.3. Market Analysis, Insights and Forecast - by End-user Industry
- 9.3.1. Architectural
- 9.3.2. Automotive
- 9.3.3. Wood
- 9.3.4. Industrial Coatings
- 9.3.5. Transportation
- 9.3.6. Packaging
- 9.1. Market Analysis, Insights and Forecast - by Resin Type
- 10. Middle East & Africa Paint Industry in Pakistan Analysis, Insights and Forecast, 2021-2033
- 10.1. Market Analysis, Insights and Forecast - by Resin Type
- 10.1.1. Acrylic
- 10.1.2. Alkyd
- 10.1.3. Polyurethane
- 10.1.4. Epoxy
- 10.1.5. Polyester
- 10.1.6. Other Resin Types
- 10.2. Market Analysis, Insights and Forecast - by Technology
- 10.2.1. Waterborne
- 10.2.2. Solvent-borne
- 10.3. Market Analysis, Insights and Forecast - by End-user Industry
- 10.3.1. Architectural
- 10.3.2. Automotive
- 10.3.3. Wood
- 10.3.4. Industrial Coatings
- 10.3.5. Transportation
- 10.3.6. Packaging
- 10.1. Market Analysis, Insights and Forecast - by Resin Type
- 11. Asia Pacific Paint Industry in Pakistan Analysis, Insights and Forecast, 2021-2033
- 11.1. Market Analysis, Insights and Forecast - by Resin Type
- 11.1.1. Acrylic
- 11.1.2. Alkyd
- 11.1.3. Polyurethane
- 11.1.4. Epoxy
- 11.1.5. Polyester
- 11.1.6. Other Resin Types
- 11.2. Market Analysis, Insights and Forecast - by Technology
- 11.2.1. Waterborne
- 11.2.2. Solvent-borne
- 11.3. Market Analysis, Insights and Forecast - by End-user Industry
- 11.3.1. Architectural
- 11.3.2. Automotive
- 11.3.3. Wood
- 11.3.4. Industrial Coatings
- 11.3.5. Transportation
- 11.3.6. Packaging
- 11.1. Market Analysis, Insights and Forecast - by Resin Type
- 12. Competitive Analysis
- 12.1. Company Profiles
- 12.1.1 Ritver Paints & Coatings
- 12.1.1.1. Company Overview
- 12.1.1.2. Products
- 12.1.1.3. Company Financials
- 12.1.1.4. SWOT Analysis
- 12.1.2 Diamond Paints
- 12.1.2.1. Company Overview
- 12.1.2.2. Products
- 12.1.2.3. Company Financials
- 12.1.2.4. SWOT Analysis
- 12.1.3 Jotun
- 12.1.3.1. Company Overview
- 12.1.3.2. Products
- 12.1.3.3. Company Financials
- 12.1.3.4. SWOT Analysis
- 12.1.4 Berger Paints Pakistan Limited
- 12.1.4.1. Company Overview
- 12.1.4.2. Products
- 12.1.4.3. Company Financials
- 12.1.4.4. SWOT Analysis
- 12.1.5 AkzoNobel
- 12.1.5.1. Company Overview
- 12.1.5.2. Products
- 12.1.5.3. Company Financials
- 12.1.5.4. SWOT Analysis
- 12.1.6 Kansai Paints
- 12.1.6.1. Company Overview
- 12.1.6.2. Products
- 12.1.6.3. Company Financials
- 12.1.6.4. SWOT Analysis
- 12.1.7 Happilac Paints
- 12.1.7.1. Company Overview
- 12.1.7.2. Products
- 12.1.7.3. Company Financials
- 12.1.7.4. SWOT Analysis
- 12.1.8 Nippon Paint
- 12.1.8.1. Company Overview
- 12.1.8.2. Products
- 12.1.8.3. Company Financials
- 12.1.8.4. SWOT Analysis
- 12.1.9 Gobi's Paints
- 12.1.9.1. Company Overview
- 12.1.9.2. Products
- 12.1.9.3. Company Financials
- 12.1.9.4. SWOT Analysis
- 12.1.10 Brighto Paints
- 12.1.10.1. Company Overview
- 12.1.10.2. Products
- 12.1.10.3. Company Financials
- 12.1.10.4. SWOT Analysis
- 12.1.11 Buxly Paints Limited
- 12.1.11.1. Company Overview
- 12.1.11.2. Products
- 12.1.11.3. Company Financials
- 12.1.11.4. SWOT Analysis
- 12.1.1 Ritver Paints & Coatings
- 12.2. Market Entropy
- 12.2.1 Company's Key Areas Served
- 12.2.2 Recent Developments
- 12.3. Company Market Share Analysis 2025
- 12.3.1 Top 5 Companies Market Share Analysis
- 12.3.2 Top 3 Companies Market Share Analysis
- 12.4. List of Potential Customers
- 13. Research Methodology
List of Figures
- Figure 1: Global Paint Industry in Pakistan Revenue Breakdown (Million, %) by Region 2025 & 2033
- Figure 2: Global Paint Industry in Pakistan Volume Breakdown (K Tons, %) by Region 2025 & 2033
- Figure 3: North America Paint Industry in Pakistan Revenue (Million), by Resin Type 2025 & 2033
- Figure 4: North America Paint Industry in Pakistan Volume (K Tons), by Resin Type 2025 & 2033
- Figure 5: North America Paint Industry in Pakistan Revenue Share (%), by Resin Type 2025 & 2033
- Figure 6: North America Paint Industry in Pakistan Volume Share (%), by Resin Type 2025 & 2033
- Figure 7: North America Paint Industry in Pakistan Revenue (Million), by Technology 2025 & 2033
- Figure 8: North America Paint Industry in Pakistan Volume (K Tons), by Technology 2025 & 2033
- Figure 9: North America Paint Industry in Pakistan Revenue Share (%), by Technology 2025 & 2033
- Figure 10: North America Paint Industry in Pakistan Volume Share (%), by Technology 2025 & 2033
- Figure 11: North America Paint Industry in Pakistan Revenue (Million), by End-user Industry 2025 & 2033
- Figure 12: North America Paint Industry in Pakistan Volume (K Tons), by End-user Industry 2025 & 2033
- Figure 13: North America Paint Industry in Pakistan Revenue Share (%), by End-user Industry 2025 & 2033
- Figure 14: North America Paint Industry in Pakistan Volume Share (%), by End-user Industry 2025 & 2033
- Figure 15: North America Paint Industry in Pakistan Revenue (Million), by Country 2025 & 2033
- Figure 16: North America Paint Industry in Pakistan Volume (K Tons), by Country 2025 & 2033
- Figure 17: North America Paint Industry in Pakistan Revenue Share (%), by Country 2025 & 2033
- Figure 18: North America Paint Industry in Pakistan Volume Share (%), by Country 2025 & 2033
- Figure 19: South America Paint Industry in Pakistan Revenue (Million), by Resin Type 2025 & 2033
- Figure 20: South America Paint Industry in Pakistan Volume (K Tons), by Resin Type 2025 & 2033
- Figure 21: South America Paint Industry in Pakistan Revenue Share (%), by Resin Type 2025 & 2033
- Figure 22: South America Paint Industry in Pakistan Volume Share (%), by Resin Type 2025 & 2033
- Figure 23: South America Paint Industry in Pakistan Revenue (Million), by Technology 2025 & 2033
- Figure 24: South America Paint Industry in Pakistan Volume (K Tons), by Technology 2025 & 2033
- Figure 25: South America Paint Industry in Pakistan Revenue Share (%), by Technology 2025 & 2033
- Figure 26: South America Paint Industry in Pakistan Volume Share (%), by Technology 2025 & 2033
- Figure 27: South America Paint Industry in Pakistan Revenue (Million), by End-user Industry 2025 & 2033
- Figure 28: South America Paint Industry in Pakistan Volume (K Tons), by End-user Industry 2025 & 2033
- Figure 29: South America Paint Industry in Pakistan Revenue Share (%), by End-user Industry 2025 & 2033
- Figure 30: South America Paint Industry in Pakistan Volume Share (%), by End-user Industry 2025 & 2033
- Figure 31: South America Paint Industry in Pakistan Revenue (Million), by Country 2025 & 2033
- Figure 32: South America Paint Industry in Pakistan Volume (K Tons), by Country 2025 & 2033
- Figure 33: South America Paint Industry in Pakistan Revenue Share (%), by Country 2025 & 2033
- Figure 34: South America Paint Industry in Pakistan Volume Share (%), by Country 2025 & 2033
- Figure 35: Europe Paint Industry in Pakistan Revenue (Million), by Resin Type 2025 & 2033
- Figure 36: Europe Paint Industry in Pakistan Volume (K Tons), by Resin Type 2025 & 2033
- Figure 37: Europe Paint Industry in Pakistan Revenue Share (%), by Resin Type 2025 & 2033
- Figure 38: Europe Paint Industry in Pakistan Volume Share (%), by Resin Type 2025 & 2033
- Figure 39: Europe Paint Industry in Pakistan Revenue (Million), by Technology 2025 & 2033
- Figure 40: Europe Paint Industry in Pakistan Volume (K Tons), by Technology 2025 & 2033
- Figure 41: Europe Paint Industry in Pakistan Revenue Share (%), by Technology 2025 & 2033
- Figure 42: Europe Paint Industry in Pakistan Volume Share (%), by Technology 2025 & 2033
- Figure 43: Europe Paint Industry in Pakistan Revenue (Million), by End-user Industry 2025 & 2033
- Figure 44: Europe Paint Industry in Pakistan Volume (K Tons), by End-user Industry 2025 & 2033
- Figure 45: Europe Paint Industry in Pakistan Revenue Share (%), by End-user Industry 2025 & 2033
- Figure 46: Europe Paint Industry in Pakistan Volume Share (%), by End-user Industry 2025 & 2033
- Figure 47: Europe Paint Industry in Pakistan Revenue (Million), by Country 2025 & 2033
- Figure 48: Europe Paint Industry in Pakistan Volume (K Tons), by Country 2025 & 2033
- Figure 49: Europe Paint Industry in Pakistan Revenue Share (%), by Country 2025 & 2033
- Figure 50: Europe Paint Industry in Pakistan Volume Share (%), by Country 2025 & 2033
- Figure 51: Middle East & Africa Paint Industry in Pakistan Revenue (Million), by Resin Type 2025 & 2033
- Figure 52: Middle East & Africa Paint Industry in Pakistan Volume (K Tons), by Resin Type 2025 & 2033
- Figure 53: Middle East & Africa Paint Industry in Pakistan Revenue Share (%), by Resin Type 2025 & 2033
- Figure 54: Middle East & Africa Paint Industry in Pakistan Volume Share (%), by Resin Type 2025 & 2033
- Figure 55: Middle East & Africa Paint Industry in Pakistan Revenue (Million), by Technology 2025 & 2033
- Figure 56: Middle East & Africa Paint Industry in Pakistan Volume (K Tons), by Technology 2025 & 2033
- Figure 57: Middle East & Africa Paint Industry in Pakistan Revenue Share (%), by Technology 2025 & 2033
- Figure 58: Middle East & Africa Paint Industry in Pakistan Volume Share (%), by Technology 2025 & 2033
- Figure 59: Middle East & Africa Paint Industry in Pakistan Revenue (Million), by End-user Industry 2025 & 2033
- Figure 60: Middle East & Africa Paint Industry in Pakistan Volume (K Tons), by End-user Industry 2025 & 2033
- Figure 61: Middle East & Africa Paint Industry in Pakistan Revenue Share (%), by End-user Industry 2025 & 2033
- Figure 62: Middle East & Africa Paint Industry in Pakistan Volume Share (%), by End-user Industry 2025 & 2033
- Figure 63: Middle East & Africa Paint Industry in Pakistan Revenue (Million), by Country 2025 & 2033
- Figure 64: Middle East & Africa Paint Industry in Pakistan Volume (K Tons), by Country 2025 & 2033
- Figure 65: Middle East & Africa Paint Industry in Pakistan Revenue Share (%), by Country 2025 & 2033
- Figure 66: Middle East & Africa Paint Industry in Pakistan Volume Share (%), by Country 2025 & 2033
- Figure 67: Asia Pacific Paint Industry in Pakistan Revenue (Million), by Resin Type 2025 & 2033
- Figure 68: Asia Pacific Paint Industry in Pakistan Volume (K Tons), by Resin Type 2025 & 2033
- Figure 69: Asia Pacific Paint Industry in Pakistan Revenue Share (%), by Resin Type 2025 & 2033
- Figure 70: Asia Pacific Paint Industry in Pakistan Volume Share (%), by Resin Type 2025 & 2033
- Figure 71: Asia Pacific Paint Industry in Pakistan Revenue (Million), by Technology 2025 & 2033
- Figure 72: Asia Pacific Paint Industry in Pakistan Volume (K Tons), by Technology 2025 & 2033
- Figure 73: Asia Pacific Paint Industry in Pakistan Revenue Share (%), by Technology 2025 & 2033
- Figure 74: Asia Pacific Paint Industry in Pakistan Volume Share (%), by Technology 2025 & 2033
- Figure 75: Asia Pacific Paint Industry in Pakistan Revenue (Million), by End-user Industry 2025 & 2033
- Figure 76: Asia Pacific Paint Industry in Pakistan Volume (K Tons), by End-user Industry 2025 & 2033
- Figure 77: Asia Pacific Paint Industry in Pakistan Revenue Share (%), by End-user Industry 2025 & 2033
- Figure 78: Asia Pacific Paint Industry in Pakistan Volume Share (%), by End-user Industry 2025 & 2033
- Figure 79: Asia Pacific Paint Industry in Pakistan Revenue (Million), by Country 2025 & 2033
- Figure 80: Asia Pacific Paint Industry in Pakistan Volume (K Tons), by Country 2025 & 2033
- Figure 81: Asia Pacific Paint Industry in Pakistan Revenue Share (%), by Country 2025 & 2033
- Figure 82: Asia Pacific Paint Industry in Pakistan Volume Share (%), by Country 2025 & 2033
List of Tables
- Table 1: Global Paint Industry in Pakistan Revenue Million Forecast, by Resin Type 2020 & 2033
- Table 2: Global Paint Industry in Pakistan Volume K Tons Forecast, by Resin Type 2020 & 2033
- Table 3: Global Paint Industry in Pakistan Revenue Million Forecast, by Technology 2020 & 2033
- Table 4: Global Paint Industry in Pakistan Volume K Tons Forecast, by Technology 2020 & 2033
- Table 5: Global Paint Industry in Pakistan Revenue Million Forecast, by End-user Industry 2020 & 2033
- Table 6: Global Paint Industry in Pakistan Volume K Tons Forecast, by End-user Industry 2020 & 2033
- Table 7: Global Paint Industry in Pakistan Revenue Million Forecast, by Region 2020 & 2033
- Table 8: Global Paint Industry in Pakistan Volume K Tons Forecast, by Region 2020 & 2033
- Table 9: Global Paint Industry in Pakistan Revenue Million Forecast, by Resin Type 2020 & 2033
- Table 10: Global Paint Industry in Pakistan Volume K Tons Forecast, by Resin Type 2020 & 2033
- Table 11: Global Paint Industry in Pakistan Revenue Million Forecast, by Technology 2020 & 2033
- Table 12: Global Paint Industry in Pakistan Volume K Tons Forecast, by Technology 2020 & 2033
- Table 13: Global Paint Industry in Pakistan Revenue Million Forecast, by End-user Industry 2020 & 2033
- Table 14: Global Paint Industry in Pakistan Volume K Tons Forecast, by End-user Industry 2020 & 2033
- Table 15: Global Paint Industry in Pakistan Revenue Million Forecast, by Country 2020 & 2033
- Table 16: Global Paint Industry in Pakistan Volume K Tons Forecast, by Country 2020 & 2033
- Table 17: United States Paint Industry in Pakistan Revenue (Million) Forecast, by Application 2020 & 2033
- Table 18: United States Paint Industry in Pakistan Volume (K Tons) Forecast, by Application 2020 & 2033
- Table 19: Canada Paint Industry in Pakistan Revenue (Million) Forecast, by Application 2020 & 2033
- Table 20: Canada Paint Industry in Pakistan Volume (K Tons) Forecast, by Application 2020 & 2033
- Table 21: Mexico Paint Industry in Pakistan Revenue (Million) Forecast, by Application 2020 & 2033
- Table 22: Mexico Paint Industry in Pakistan Volume (K Tons) Forecast, by Application 2020 & 2033
- Table 23: Global Paint Industry in Pakistan Revenue Million Forecast, by Resin Type 2020 & 2033
- Table 24: Global Paint Industry in Pakistan Volume K Tons Forecast, by Resin Type 2020 & 2033
- Table 25: Global Paint Industry in Pakistan Revenue Million Forecast, by Technology 2020 & 2033
- Table 26: Global Paint Industry in Pakistan Volume K Tons Forecast, by Technology 2020 & 2033
- Table 27: Global Paint Industry in Pakistan Revenue Million Forecast, by End-user Industry 2020 & 2033
- Table 28: Global Paint Industry in Pakistan Volume K Tons Forecast, by End-user Industry 2020 & 2033
- Table 29: Global Paint Industry in Pakistan Revenue Million Forecast, by Country 2020 & 2033
- Table 30: Global Paint Industry in Pakistan Volume K Tons Forecast, by Country 2020 & 2033
- Table 31: Brazil Paint Industry in Pakistan Revenue (Million) Forecast, by Application 2020 & 2033
- Table 32: Brazil Paint Industry in Pakistan Volume (K Tons) Forecast, by Application 2020 & 2033
- Table 33: Argentina Paint Industry in Pakistan Revenue (Million) Forecast, by Application 2020 & 2033
- Table 34: Argentina Paint Industry in Pakistan Volume (K Tons) Forecast, by Application 2020 & 2033
- Table 35: Rest of South America Paint Industry in Pakistan Revenue (Million) Forecast, by Application 2020 & 2033
- Table 36: Rest of South America Paint Industry in Pakistan Volume (K Tons) Forecast, by Application 2020 & 2033
- Table 37: Global Paint Industry in Pakistan Revenue Million Forecast, by Resin Type 2020 & 2033
- Table 38: Global Paint Industry in Pakistan Volume K Tons Forecast, by Resin Type 2020 & 2033
- Table 39: Global Paint Industry in Pakistan Revenue Million Forecast, by Technology 2020 & 2033
- Table 40: Global Paint Industry in Pakistan Volume K Tons Forecast, by Technology 2020 & 2033
- Table 41: Global Paint Industry in Pakistan Revenue Million Forecast, by End-user Industry 2020 & 2033
- Table 42: Global Paint Industry in Pakistan Volume K Tons Forecast, by End-user Industry 2020 & 2033
- Table 43: Global Paint Industry in Pakistan Revenue Million Forecast, by Country 2020 & 2033
- Table 44: Global Paint Industry in Pakistan Volume K Tons Forecast, by Country 2020 & 2033
- Table 45: United Kingdom Paint Industry in Pakistan Revenue (Million) Forecast, by Application 2020 & 2033
- Table 46: United Kingdom Paint Industry in Pakistan Volume (K Tons) Forecast, by Application 2020 & 2033
- Table 47: Germany Paint Industry in Pakistan Revenue (Million) Forecast, by Application 2020 & 2033
- Table 48: Germany Paint Industry in Pakistan Volume (K Tons) Forecast, by Application 2020 & 2033
- Table 49: France Paint Industry in Pakistan Revenue (Million) Forecast, by Application 2020 & 2033
- Table 50: France Paint Industry in Pakistan Volume (K Tons) Forecast, by Application 2020 & 2033
- Table 51: Italy Paint Industry in Pakistan Revenue (Million) Forecast, by Application 2020 & 2033
- Table 52: Italy Paint Industry in Pakistan Volume (K Tons) Forecast, by Application 2020 & 2033
- Table 53: Spain Paint Industry in Pakistan Revenue (Million) Forecast, by Application 2020 & 2033
- Table 54: Spain Paint Industry in Pakistan Volume (K Tons) Forecast, by Application 2020 & 2033
- Table 55: Russia Paint Industry in Pakistan Revenue (Million) Forecast, by Application 2020 & 2033
- Table 56: Russia Paint Industry in Pakistan Volume (K Tons) Forecast, by Application 2020 & 2033
- Table 57: Benelux Paint Industry in Pakistan Revenue (Million) Forecast, by Application 2020 & 2033
- Table 58: Benelux Paint Industry in Pakistan Volume (K Tons) Forecast, by Application 2020 & 2033
- Table 59: Nordics Paint Industry in Pakistan Revenue (Million) Forecast, by Application 2020 & 2033
- Table 60: Nordics Paint Industry in Pakistan Volume (K Tons) Forecast, by Application 2020 & 2033
- Table 61: Rest of Europe Paint Industry in Pakistan Revenue (Million) Forecast, by Application 2020 & 2033
- Table 62: Rest of Europe Paint Industry in Pakistan Volume (K Tons) Forecast, by Application 2020 & 2033
- Table 63: Global Paint Industry in Pakistan Revenue Million Forecast, by Resin Type 2020 & 2033
- Table 64: Global Paint Industry in Pakistan Volume K Tons Forecast, by Resin Type 2020 & 2033
- Table 65: Global Paint Industry in Pakistan Revenue Million Forecast, by Technology 2020 & 2033
- Table 66: Global Paint Industry in Pakistan Volume K Tons Forecast, by Technology 2020 & 2033
- Table 67: Global Paint Industry in Pakistan Revenue Million Forecast, by End-user Industry 2020 & 2033
- Table 68: Global Paint Industry in Pakistan Volume K Tons Forecast, by End-user Industry 2020 & 2033
- Table 69: Global Paint Industry in Pakistan Revenue Million Forecast, by Country 2020 & 2033
- Table 70: Global Paint Industry in Pakistan Volume K Tons Forecast, by Country 2020 & 2033
- Table 71: Turkey Paint Industry in Pakistan Revenue (Million) Forecast, by Application 2020 & 2033
- Table 72: Turkey Paint Industry in Pakistan Volume (K Tons) Forecast, by Application 2020 & 2033
- Table 73: Israel Paint Industry in Pakistan Revenue (Million) Forecast, by Application 2020 & 2033
- Table 74: Israel Paint Industry in Pakistan Volume (K Tons) Forecast, by Application 2020 & 2033
- Table 75: GCC Paint Industry in Pakistan Revenue (Million) Forecast, by Application 2020 & 2033
- Table 76: GCC Paint Industry in Pakistan Volume (K Tons) Forecast, by Application 2020 & 2033
- Table 77: North Africa Paint Industry in Pakistan Revenue (Million) Forecast, by Application 2020 & 2033
- Table 78: North Africa Paint Industry in Pakistan Volume (K Tons) Forecast, by Application 2020 & 2033
- Table 79: South Africa Paint Industry in Pakistan Revenue (Million) Forecast, by Application 2020 & 2033
- Table 80: South Africa Paint Industry in Pakistan Volume (K Tons) Forecast, by Application 2020 & 2033
- Table 81: Rest of Middle East & Africa Paint Industry in Pakistan Revenue (Million) Forecast, by Application 2020 & 2033
- Table 82: Rest of Middle East & Africa Paint Industry in Pakistan Volume (K Tons) Forecast, by Application 2020 & 2033
- Table 83: Global Paint Industry in Pakistan Revenue Million Forecast, by Resin Type 2020 & 2033
- Table 84: Global Paint Industry in Pakistan Volume K Tons Forecast, by Resin Type 2020 & 2033
- Table 85: Global Paint Industry in Pakistan Revenue Million Forecast, by Technology 2020 & 2033
- Table 86: Global Paint Industry in Pakistan Volume K Tons Forecast, by Technology 2020 & 2033
- Table 87: Global Paint Industry in Pakistan Revenue Million Forecast, by End-user Industry 2020 & 2033
- Table 88: Global Paint Industry in Pakistan Volume K Tons Forecast, by End-user Industry 2020 & 2033
- Table 89: Global Paint Industry in Pakistan Revenue Million Forecast, by Country 2020 & 2033
- Table 90: Global Paint Industry in Pakistan Volume K Tons Forecast, by Country 2020 & 2033
- Table 91: China Paint Industry in Pakistan Revenue (Million) Forecast, by Application 2020 & 2033
- Table 92: China Paint Industry in Pakistan Volume (K Tons) Forecast, by Application 2020 & 2033
- Table 93: India Paint Industry in Pakistan Revenue (Million) Forecast, by Application 2020 & 2033
- Table 94: India Paint Industry in Pakistan Volume (K Tons) Forecast, by Application 2020 & 2033
- Table 95: Japan Paint Industry in Pakistan Revenue (Million) Forecast, by Application 2020 & 2033
- Table 96: Japan Paint Industry in Pakistan Volume (K Tons) Forecast, by Application 2020 & 2033
- Table 97: South Korea Paint Industry in Pakistan Revenue (Million) Forecast, by Application 2020 & 2033
- Table 98: South Korea Paint Industry in Pakistan Volume (K Tons) Forecast, by Application 2020 & 2033
- Table 99: ASEAN Paint Industry in Pakistan Revenue (Million) Forecast, by Application 2020 & 2033
- Table 100: ASEAN Paint Industry in Pakistan Volume (K Tons) Forecast, by Application 2020 & 2033
- Table 101: Oceania Paint Industry in Pakistan Revenue (Million) Forecast, by Application 2020 & 2033
- Table 102: Oceania Paint Industry in Pakistan Volume (K Tons) Forecast, by Application 2020 & 2033
- Table 103: Rest of Asia Pacific Paint Industry in Pakistan Revenue (Million) Forecast, by Application 2020 & 2033
- Table 104: Rest of Asia Pacific Paint Industry in Pakistan Volume (K Tons) Forecast, by Application 2020 & 2033
Frequently Asked Questions
1. What is the projected Compound Annual Growth Rate (CAGR) of the Paint Industry in Pakistan?
The projected CAGR is approximately 4.18%.
2. Which companies are prominent players in the Paint Industry in Pakistan?
Key companies in the market include Ritver Paints & Coatings, Diamond Paints, Jotun, Berger Paints Pakistan Limited, AkzoNobel, Kansai Paints, Happilac Paints, Nippon Paint, Gobi's Paints, Brighto Paints, Buxly Paints Limited.
3. What are the main segments of the Paint Industry in Pakistan?
The market segments include Resin Type, Technology, End-user Industry.
4. Can you provide details about the market size?
The market size is estimated to be USD 400.82 Million as of 2022.
5. What are some drivers contributing to market growth?
Growing Demand from the Architectural Coatings Segment; Growth in the Furniture Market.
6. What are the notable trends driving market growth?
Acrylic Resins to Dominate the Market.
7. Are there any restraints impacting market growth?
Fluctuating Automotive Industry; Rising Environmental Concerns.
8. Can you provide examples of recent developments in the market?
March 2022 : AkzoNobel Pakistan Ltd announced the establishment of a new manufacturing facility in Pakistan. The integrated paints and coatings factory would be constructed in Faisalabad, Pakistan, near the Allama Iqbal Industrial City. The plant will cover 25 acres and will begin operations in 2023. The new manufacturing plant's rapid production will help AkzoNobel to be more competitive in the market.
9. What pricing options are available for accessing the report?
Pricing options include single-user, multi-user, and enterprise licenses priced at USD 3,950, USD 4,950, and USD 6,950 respectively.
10. Is the market size provided in terms of value or volume?
The market size is provided in terms of value, measured in Million and volume, measured in K Tons.
11. Are there any specific market keywords associated with the report?
Yes, the market keyword associated with the report is "Paint Industry in Pakistan," which aids in identifying and referencing the specific market segment covered.
12. How do I determine which pricing option suits my needs best?
The pricing options vary based on user requirements and access needs. Individual users may opt for single-user licenses, while businesses requiring broader access may choose multi-user or enterprise licenses for cost-effective access to the report.
13. Are there any additional resources or data provided in the Paint Industry in Pakistan report?
While the report offers comprehensive insights, it's advisable to review the specific contents or supplementary materials provided to ascertain if additional resources or data are available.
14. How can I stay updated on further developments or reports in the Paint Industry in Pakistan?
To stay informed about further developments, trends, and reports in the Paint Industry in Pakistan, consider subscribing to industry newsletters, following relevant companies and organizations, or regularly checking reputable industry news sources and publications.
Methodology
Step 1 - Identification of Relevant Samples Size from Population Database


Step 2 - Approaches for Defining Global Market Size (Value, Volume* & Price*)

Note*: In applicable scenarios
Step 3 - Data Sources
Primary Research
- Web Analytics
- Survey Reports
- Research Institute
- Latest Research Reports
- Opinion Leaders
Secondary Research
- Annual Reports
- White Paper
- Latest Press Release
- Industry Association
- Paid Database
- Investor Presentations

Step 4 - Data Triangulation
Involves using different sources of information in order to increase the validity of a study
These sources are likely to be stakeholders in a program - participants, other researchers, program staff, other community members, and so on.
Then we put all data in single framework & apply various statistical tools to find out the dynamic on the market.
During the analysis stage, feedback from the stakeholder groups would be compared to determine areas of agreement as well as areas of divergence