
Key Insights
The global pain management devices market, valued at $10.64 billion in 2025, is projected to experience robust growth, driven by a rising geriatric population, increasing prevalence of chronic pain conditions (such as musculoskeletal disorders, cancer pain, and neuropathic pain), and advancements in minimally invasive surgical techniques and device technology. The market's Compound Annual Growth Rate (CAGR) of 9.70% from 2025 to 2033 indicates substantial expansion opportunities. Key growth drivers include the increasing adoption of advanced neurostimulation devices offering targeted pain relief, the development of sophisticated drug delivery systems through infusion pumps, and the rising preference for minimally invasive ablation procedures. Technological innovations, such as wireless and implantable devices, personalized medicine approaches, and improved data analytics capabilities for treatment optimization, are also fueling market expansion. This growth is further spurred by rising healthcare expenditure and improved access to advanced pain management therapies in developing economies.
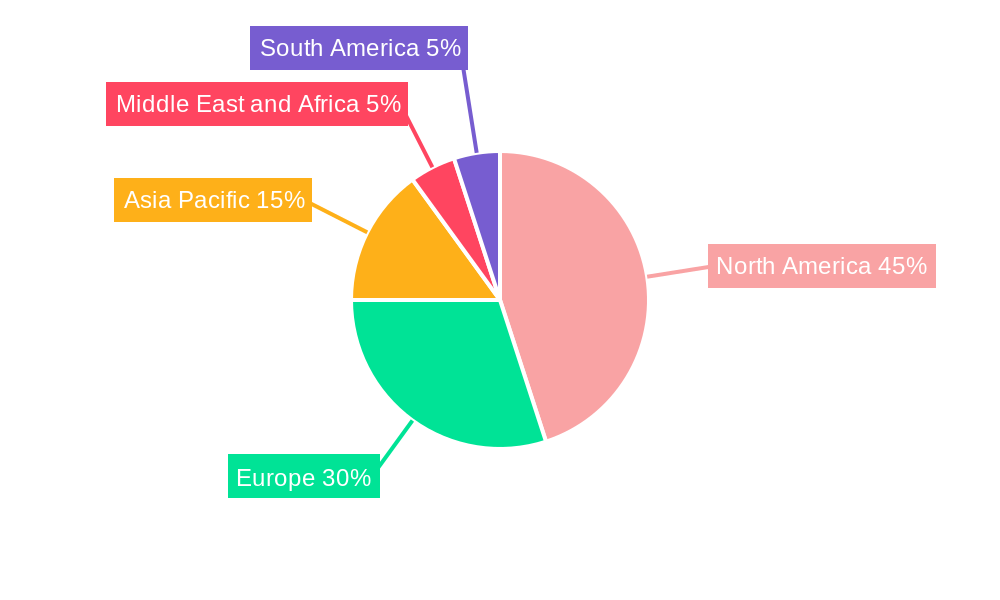
However, market growth faces some restraints. High costs associated with advanced devices, stringent regulatory approvals, and potential side effects associated with certain therapies can limit market penetration. Furthermore, the complexity of chronic pain management and the need for personalized treatment approaches pose challenges for widespread adoption. Nevertheless, the market is segmented into product types (neurostimulation devices, infusion pumps, ablation devices), applications (musculoskeletal, cancer pain, neuropathic pain, facial pain and migraine), and end-users (physiotherapy centers, hospitals and clinics), offering various avenues for growth. The North American market currently holds a significant share, owing to high healthcare spending and technological advancements, but the Asia-Pacific region is expected to witness the fastest growth due to rising disposable incomes and increasing awareness about advanced pain management options. Companies like Medtronic, Boston Scientific, and Stryker are key players, shaping market dynamics through innovation and strategic collaborations.

Pain Management Devices Market Report: 2019-2033
This comprehensive report provides an in-depth analysis of the Pain Management Devices market, encompassing market dynamics, growth trends, regional dominance, product landscape, key players, and future outlook. The study period covers 2019-2033, with 2025 as the base and estimated year. This report is invaluable for industry professionals, investors, and strategists seeking to understand and capitalize on opportunities within this rapidly evolving sector. The total market value in 2025 is estimated at $XX Billion.
Keywords: Pain Management Devices, Neurostimulation Devices, Infusion Pumps, Ablation Devices, Musculoskeletal Pain, Cancer Pain, Neuropathic Pain, Facial Pain, Migraine, Physiotherapy Centers, Hospitals and Clinics, Medtronic, Boston Scientific, Stryker, Abbott, Market Size, Market Share, CAGR, Growth Opportunities, Industry Trends, Competitive Landscape.
Pain Management Devices Industry Market Dynamics & Structure
The pain management devices market is characterized by moderate concentration, with several key players holding significant market shares. Technological innovation, particularly in areas like neurostimulation and minimally invasive procedures, is a major growth driver. Stringent regulatory frameworks, including those related to safety and efficacy, influence market access and product development. The market also faces competition from alternative therapies such as physiotherapy and pharmacological interventions. Demographics, particularly the aging population and rising prevalence of chronic pain conditions, fuel market growth. M&A activity has been moderate, with larger players consolidating their position through acquisitions of smaller companies with specialized technologies or promising product pipelines. The projected market share of the top 5 players in 2025 is approximately 60%. M&A activity is expected to remain stable over the forecast period, with an average of xx deals per year.
- Market Concentration: Moderately concentrated, with top 5 players controlling ~60% of market share in 2025.
- Technological Innovation: Neurostimulation, minimally invasive techniques, and advanced drug delivery systems are key drivers.
- Regulatory Landscape: Stringent regulations impact market access and product development timelines.
- Competitive Substitutes: Physiotherapy, pharmacological treatments, and alternative therapies pose competition.
- End-User Demographics: Aging population and rising prevalence of chronic pain conditions drive market demand.
- M&A Trends: Moderate activity, with larger players consolidating through acquisitions.
Pain Management Devices Industry Growth Trends & Insights
The pain management devices market experienced significant growth during the historical period (2019-2024), fueled by factors such as the rising prevalence of chronic pain conditions, technological advancements, and increasing healthcare expenditure. The market size is projected to expand at a Compound Annual Growth Rate (CAGR) of xx% during the forecast period (2025-2033), reaching an estimated value of $XX Billion by 2033. This growth is driven by factors such as the increasing adoption of minimally invasive procedures, the development of advanced devices with improved efficacy and safety profiles, and the rising demand for personalized pain management solutions. Consumer behavior shifts towards minimally invasive procedures and a preference for at-home treatments are further enhancing market expansion. Market penetration for neurostimulation devices is expected to reach xx% by 2033.

Dominant Regions, Countries, or Segments in Pain Management Devices Industry
North America currently holds the largest market share in the pain management devices industry, driven by factors such as high healthcare expenditure, technological advancements, and strong regulatory support. Within the product type segment, Neurostimulation Devices command the largest share, reflecting the increasing adoption of these advanced therapies for chronic pain management. In terms of application, Musculoskeletal pain represents the largest segment, followed by Neuropathic pain. Hospitals and Clinics constitute the largest end-user segment due to their extensive resources and the complexity of procedures often involved.
- Leading Region: North America
- Dominant Product Type: Neurostimulation Devices
- Largest Application Segment: Musculoskeletal Pain
- Key End-User: Hospitals and Clinics
- Key Growth Drivers: High healthcare expenditure in North America, technological advancements, strong regulatory support, and rising prevalence of chronic pain.
Pain Management Devices Industry Product Landscape
The pain management devices market encompasses a wide array of technologies designed to alleviate pain, including neurostimulation devices (such as spinal cord stimulation and dorsal root ganglion stimulation), sophisticated infusion pumps for precise drug delivery, and ablation devices used for targeted nerve destruction. Recent advancements are characterized by a focus on enhanced efficacy, minimally invasive procedures, personalized treatment plans, and the integration of remote patient monitoring (RPM) capabilities. These innovations collectively improve patient outcomes, enhance convenience, and contribute to reduced overall healthcare costs. Key competitive differentiators often include smaller device profiles, extended battery life, and improved targeting accuracy, leading to better patient experiences and treatment adherence.
Key Drivers, Barriers & Challenges in Pain Management Devices Industry
Key Drivers:
- Significant technological advancements resulting in improved efficacy and enhanced patient safety profiles.
- A globally escalating prevalence of chronic pain conditions, driving demand for effective treatment options.
- Increased healthcare expenditure and expanding insurance coverage for pain management therapies.
- A growing preference for minimally invasive procedures, minimizing patient discomfort and recovery time.
- The rise of telehealth and remote monitoring, allowing for improved patient engagement and treatment access.
Key Challenges:
- The high cost of devices and procedures, posing a barrier to accessibility for some patients.
- Stringent regulatory requirements and lengthy approval processes for new devices and therapies.
- Intense competition from alternative pain management therapies, including pharmacological and non-pharmacological approaches.
- The potential for adverse events associated with certain devices, necessitating rigorous safety monitoring and risk mitigation strategies.
- Supply chain disruptions and their impact on device availability and pricing. For example, supply chain issues contributed to a xx% increase in device prices in 2022.
Emerging Opportunities in Pain Management Devices Industry
- Expanding applications of neurostimulation technologies.
- Development of personalized pain management solutions tailored to individual patient needs.
- Increased adoption of remote patient monitoring and telehealth technologies.
- Penetration into emerging markets with high prevalence of chronic pain.
- Development of innovative devices targeting specific pain types.
Growth Accelerators in the Pain Management Devices Industry
Technological breakthroughs in areas such as targeted drug delivery, advanced neurostimulation techniques, and AI-powered diagnostics are significantly accelerating market growth. Strategic partnerships and collaborations between device manufacturers and healthcare providers are fostering innovation and expanding market access. Market expansion strategies targeting emerging markets with high unmet needs, particularly in Asia and Latin America, are expected to further boost market growth.
Key Players Shaping the Pain Management Devices Market
- ICU Medical Inc
- LivaNova
- DJO Global LLC
- Enovis
- Medtronic
- Baxter
- Stryker
- Abbott
- Boston Scientific Corporation
- Nevro Cor
- Stim Wave LLC
- SPR Therapeutics
Notable Milestones in Pain Management Devices Industry Sector
- June 2022: Coach Care partnered with Nexstim to launch the world's first commercially available remote patient monitoring (RPM) and wellness monitoring device for pain management. This innovative solution significantly enhanced patient engagement and facilitated remote treatment capabilities, improving patient outcomes and reducing healthcare utilization.
- January 2021: Boston Scientific Corporation introduced the WaveWriter Alpha, a portfolio of Spinal Cord Stimulator (SCS) systems offering a range of personalized pain relief options. This expansion of treatment options enabled clinicians to tailor therapies to individual patient needs and anatomical variations, leading to more effective pain management.
- [Add another milestone here with date and brief description]
In-Depth Pain Management Devices Industry Market Outlook
The pain management devices market is projected to experience robust growth throughout the forecast period, propelled by several key factors. These include ongoing technological advancements leading to more effective and safer devices, the increasing prevalence of chronic pain conditions globally, and a corresponding rise in healthcare expenditure allocated to pain management. Significant strategic opportunities exist for companies focused on developing innovative devices addressing unmet clinical needs, exploring novel therapeutic applications, and leveraging digital health technologies such as AI and machine learning to further enhance patient care and treatment efficacy. Companies prioritizing personalized medicine approaches, seamless remote monitoring capabilities, and efficient regulatory pathways will be ideally positioned to capture substantial market share and drive sustained long-term growth within this dynamic and expanding sector.
Pain Management Devices Industry Segmentation
-
1. Product Type
- 1.1. Neurostimulation Devices
- 1.2. Infusion Pumps
- 1.3. Ablation Devices
-
2. Application
- 2.1. Musculoskeletal
- 2.2. Cancer Pain
- 2.3. Neuropathic Pain
- 2.4. Facial Pain and Migraine
- 2.5. Other
-
3. End-User
- 3.1. Physiotherapy Centers
- 3.2. Hospitals and Clinics
- 3.3. Others
Pain Management Devices Industry Segmentation By Geography
-
1. North America
- 1.1. United States
- 1.2. Canada
- 1.3. Mexico
-
2. Europe
- 2.1. Germany
- 2.2. United Kingdom
- 2.3. France
- 2.4. Italy
- 2.5. Spain
- 2.6. Rest of Europe
-
3. Asia Pacific
- 3.1. China
- 3.2. Japan
- 3.3. India
- 3.4. Australia
- 3.5. South Korea
- 3.6. Rest of Asia Pacific
-
4. Middle East and Africa
- 4.1. GCC
- 4.2. South Africa
- 4.3. Rest of Middle East and Africa
-
5. South America
- 5.1. Brazil
- 5.2. Argentina
- 5.3. Rest of South America
Pain Management Devices Industry REPORT HIGHLIGHTS
| Aspects | Details |
|---|---|
| Study Period | 2019-2033 |
| Base Year | 2024 |
| Estimated Year | 2025 |
| Forecast Period | 2025-2033 |
| Historical Period | 2019-2024 |
| Growth Rate | CAGR of 9.70% from 2019-2033 |
| Segmentation |
|
Table of Contents
- 1. Introduction
- 1.1. Research Scope
- 1.2. Market Segmentation
- 1.3. Research Methodology
- 1.4. Definitions and Assumptions
- 2. Executive Summary
- 2.1. Introduction
- 3. Market Dynamics
- 3.1. Introduction
- 3.2. Market Drivers
- 3.2.1. The advent of Innovative and Technologically Advanced Pain Management Devices; Increase in Adoption of Pain Management Devices; Rise in Geriatric Population
- 3.3. Market Restrains
- 3.3.1. Preferable use of medications for pain management
- 3.4. Market Trends
- 3.4.1. The neuropathic pain management devices segment counted for the largest share of the global market and witness significant growth
- 4. Market Factor Analysis
- 4.1. Porters Five Forces
- 4.2. Supply/Value Chain
- 4.3. PESTEL analysis
- 4.4. Market Entropy
- 4.5. Patent/Trademark Analysis
- 5. Global Pain Management Devices Industry Analysis, Insights and Forecast, 2019-2031
- 5.1. Market Analysis, Insights and Forecast - by Product Type
- 5.1.1. Neurostimulation Devices
- 5.1.2. Infusion Pumps
- 5.1.3. Ablation Devices
- 5.2. Market Analysis, Insights and Forecast - by Application
- 5.2.1. Musculoskeletal
- 5.2.2. Cancer Pain
- 5.2.3. Neuropathic Pain
- 5.2.4. Facial Pain and Migraine
- 5.2.5. Other
- 5.3. Market Analysis, Insights and Forecast - by End-User
- 5.3.1. Physiotherapy Centers
- 5.3.2. Hospitals and Clinics
- 5.3.3. Others
- 5.4. Market Analysis, Insights and Forecast - by Region
- 5.4.1. North America
- 5.4.2. Europe
- 5.4.3. Asia Pacific
- 5.4.4. Middle East and Africa
- 5.4.5. South America
- 5.1. Market Analysis, Insights and Forecast - by Product Type
- 6. North America Pain Management Devices Industry Analysis, Insights and Forecast, 2019-2031
- 6.1. Market Analysis, Insights and Forecast - by Product Type
- 6.1.1. Neurostimulation Devices
- 6.1.2. Infusion Pumps
- 6.1.3. Ablation Devices
- 6.2. Market Analysis, Insights and Forecast - by Application
- 6.2.1. Musculoskeletal
- 6.2.2. Cancer Pain
- 6.2.3. Neuropathic Pain
- 6.2.4. Facial Pain and Migraine
- 6.2.5. Other
- 6.3. Market Analysis, Insights and Forecast - by End-User
- 6.3.1. Physiotherapy Centers
- 6.3.2. Hospitals and Clinics
- 6.3.3. Others
- 6.1. Market Analysis, Insights and Forecast - by Product Type
- 7. Europe Pain Management Devices Industry Analysis, Insights and Forecast, 2019-2031
- 7.1. Market Analysis, Insights and Forecast - by Product Type
- 7.1.1. Neurostimulation Devices
- 7.1.2. Infusion Pumps
- 7.1.3. Ablation Devices
- 7.2. Market Analysis, Insights and Forecast - by Application
- 7.2.1. Musculoskeletal
- 7.2.2. Cancer Pain
- 7.2.3. Neuropathic Pain
- 7.2.4. Facial Pain and Migraine
- 7.2.5. Other
- 7.3. Market Analysis, Insights and Forecast - by End-User
- 7.3.1. Physiotherapy Centers
- 7.3.2. Hospitals and Clinics
- 7.3.3. Others
- 7.1. Market Analysis, Insights and Forecast - by Product Type
- 8. Asia Pacific Pain Management Devices Industry Analysis, Insights and Forecast, 2019-2031
- 8.1. Market Analysis, Insights and Forecast - by Product Type
- 8.1.1. Neurostimulation Devices
- 8.1.2. Infusion Pumps
- 8.1.3. Ablation Devices
- 8.2. Market Analysis, Insights and Forecast - by Application
- 8.2.1. Musculoskeletal
- 8.2.2. Cancer Pain
- 8.2.3. Neuropathic Pain
- 8.2.4. Facial Pain and Migraine
- 8.2.5. Other
- 8.3. Market Analysis, Insights and Forecast - by End-User
- 8.3.1. Physiotherapy Centers
- 8.3.2. Hospitals and Clinics
- 8.3.3. Others
- 8.1. Market Analysis, Insights and Forecast - by Product Type
- 9. Middle East and Africa Pain Management Devices Industry Analysis, Insights and Forecast, 2019-2031
- 9.1. Market Analysis, Insights and Forecast - by Product Type
- 9.1.1. Neurostimulation Devices
- 9.1.2. Infusion Pumps
- 9.1.3. Ablation Devices
- 9.2. Market Analysis, Insights and Forecast - by Application
- 9.2.1. Musculoskeletal
- 9.2.2. Cancer Pain
- 9.2.3. Neuropathic Pain
- 9.2.4. Facial Pain and Migraine
- 9.2.5. Other
- 9.3. Market Analysis, Insights and Forecast - by End-User
- 9.3.1. Physiotherapy Centers
- 9.3.2. Hospitals and Clinics
- 9.3.3. Others
- 9.1. Market Analysis, Insights and Forecast - by Product Type
- 10. South America Pain Management Devices Industry Analysis, Insights and Forecast, 2019-2031
- 10.1. Market Analysis, Insights and Forecast - by Product Type
- 10.1.1. Neurostimulation Devices
- 10.1.2. Infusion Pumps
- 10.1.3. Ablation Devices
- 10.2. Market Analysis, Insights and Forecast - by Application
- 10.2.1. Musculoskeletal
- 10.2.2. Cancer Pain
- 10.2.3. Neuropathic Pain
- 10.2.4. Facial Pain and Migraine
- 10.2.5. Other
- 10.3. Market Analysis, Insights and Forecast - by End-User
- 10.3.1. Physiotherapy Centers
- 10.3.2. Hospitals and Clinics
- 10.3.3. Others
- 10.1. Market Analysis, Insights and Forecast - by Product Type
- 11. North America Pain Management Devices Industry Analysis, Insights and Forecast, 2019-2031
- 11.1. Market Analysis, Insights and Forecast - By Country/Sub-region
- 11.1.1. undefined
- 12. Europe Pain Management Devices Industry Analysis, Insights and Forecast, 2019-2031
- 12.1. Market Analysis, Insights and Forecast - By Country/Sub-region
- 12.1.1. undefined
- 13. Asia Pacific Pain Management Devices Industry Analysis, Insights and Forecast, 2019-2031
- 13.1. Market Analysis, Insights and Forecast - By Country/Sub-region
- 13.1.1. undefined
- 14. Middle East and Africa Pain Management Devices Industry Analysis, Insights and Forecast, 2019-2031
- 14.1. Market Analysis, Insights and Forecast - By Country/Sub-region
- 14.1.1. undefined
- 15. South America Pain Management Devices Industry Analysis, Insights and Forecast, 2019-2031
- 15.1. Market Analysis, Insights and Forecast - By Country/Sub-region
- 15.1.1. undefined
- 16. Competitive Analysis
- 16.1. Global Market Share Analysis 2024
- 16.2. Company Profiles
- 16.2.1 ICU Medical Inc
- 16.2.1.1. Overview
- 16.2.1.2. Products
- 16.2.1.3. SWOT Analysis
- 16.2.1.4. Recent Developments
- 16.2.1.5. Financials (Based on Availability)
- 16.2.2 LivaNova
- 16.2.2.1. Overview
- 16.2.2.2. Products
- 16.2.2.3. SWOT Analysis
- 16.2.2.4. Recent Developments
- 16.2.2.5. Financials (Based on Availability)
- 16.2.3 DJO Global LLC
- 16.2.3.1. Overview
- 16.2.3.2. Products
- 16.2.3.3. SWOT Analysis
- 16.2.3.4. Recent Developments
- 16.2.3.5. Financials (Based on Availability)
- 16.2.4 Enovis
- 16.2.4.1. Overview
- 16.2.4.2. Products
- 16.2.4.3. SWOT Analysis
- 16.2.4.4. Recent Developments
- 16.2.4.5. Financials (Based on Availability)
- 16.2.5 Medtronic
- 16.2.5.1. Overview
- 16.2.5.2. Products
- 16.2.5.3. SWOT Analysis
- 16.2.5.4. Recent Developments
- 16.2.5.5. Financials (Based on Availability)
- 16.2.6 Baxter
- 16.2.6.1. Overview
- 16.2.6.2. Products
- 16.2.6.3. SWOT Analysis
- 16.2.6.4. Recent Developments
- 16.2.6.5. Financials (Based on Availability)
- 16.2.7 Stryker
- 16.2.7.1. Overview
- 16.2.7.2. Products
- 16.2.7.3. SWOT Analysis
- 16.2.7.4. Recent Developments
- 16.2.7.5. Financials (Based on Availability)
- 16.2.8 Abbott
- 16.2.8.1. Overview
- 16.2.8.2. Products
- 16.2.8.3. SWOT Analysis
- 16.2.8.4. Recent Developments
- 16.2.8.5. Financials (Based on Availability)
- 16.2.9 Boston Scientific Corporation
- 16.2.9.1. Overview
- 16.2.9.2. Products
- 16.2.9.3. SWOT Analysis
- 16.2.9.4. Recent Developments
- 16.2.9.5. Financials (Based on Availability)
- 16.2.10 Nevro Cor
- 16.2.10.1. Overview
- 16.2.10.2. Products
- 16.2.10.3. SWOT Analysis
- 16.2.10.4. Recent Developments
- 16.2.10.5. Financials (Based on Availability)
- 16.2.11 Stim Wave LLC
- 16.2.11.1. Overview
- 16.2.11.2. Products
- 16.2.11.3. SWOT Analysis
- 16.2.11.4. Recent Developments
- 16.2.11.5. Financials (Based on Availability)
- 16.2.12 SPR Therapeutics
- 16.2.12.1. Overview
- 16.2.12.2. Products
- 16.2.12.3. SWOT Analysis
- 16.2.12.4. Recent Developments
- 16.2.12.5. Financials (Based on Availability)
- 16.2.1 ICU Medical Inc
List of Figures
- Figure 1: Global Pain Management Devices Industry Revenue Breakdown (Million, %) by Region 2024 & 2032
- Figure 2: Global Pain Management Devices Industry Volume Breakdown (K Unit, %) by Region 2024 & 2032
- Figure 3: North America Pain Management Devices Industry Revenue (Million), by Country 2024 & 2032
- Figure 4: North America Pain Management Devices Industry Volume (K Unit), by Country 2024 & 2032
- Figure 5: North America Pain Management Devices Industry Revenue Share (%), by Country 2024 & 2032
- Figure 6: North America Pain Management Devices Industry Volume Share (%), by Country 2024 & 2032
- Figure 7: Europe Pain Management Devices Industry Revenue (Million), by Country 2024 & 2032
- Figure 8: Europe Pain Management Devices Industry Volume (K Unit), by Country 2024 & 2032
- Figure 9: Europe Pain Management Devices Industry Revenue Share (%), by Country 2024 & 2032
- Figure 10: Europe Pain Management Devices Industry Volume Share (%), by Country 2024 & 2032
- Figure 11: Asia Pacific Pain Management Devices Industry Revenue (Million), by Country 2024 & 2032
- Figure 12: Asia Pacific Pain Management Devices Industry Volume (K Unit), by Country 2024 & 2032
- Figure 13: Asia Pacific Pain Management Devices Industry Revenue Share (%), by Country 2024 & 2032
- Figure 14: Asia Pacific Pain Management Devices Industry Volume Share (%), by Country 2024 & 2032
- Figure 15: Middle East and Africa Pain Management Devices Industry Revenue (Million), by Country 2024 & 2032
- Figure 16: Middle East and Africa Pain Management Devices Industry Volume (K Unit), by Country 2024 & 2032
- Figure 17: Middle East and Africa Pain Management Devices Industry Revenue Share (%), by Country 2024 & 2032
- Figure 18: Middle East and Africa Pain Management Devices Industry Volume Share (%), by Country 2024 & 2032
- Figure 19: South America Pain Management Devices Industry Revenue (Million), by Country 2024 & 2032
- Figure 20: South America Pain Management Devices Industry Volume (K Unit), by Country 2024 & 2032
- Figure 21: South America Pain Management Devices Industry Revenue Share (%), by Country 2024 & 2032
- Figure 22: South America Pain Management Devices Industry Volume Share (%), by Country 2024 & 2032
- Figure 23: North America Pain Management Devices Industry Revenue (Million), by Product Type 2024 & 2032
- Figure 24: North America Pain Management Devices Industry Volume (K Unit), by Product Type 2024 & 2032
- Figure 25: North America Pain Management Devices Industry Revenue Share (%), by Product Type 2024 & 2032
- Figure 26: North America Pain Management Devices Industry Volume Share (%), by Product Type 2024 & 2032
- Figure 27: North America Pain Management Devices Industry Revenue (Million), by Application 2024 & 2032
- Figure 28: North America Pain Management Devices Industry Volume (K Unit), by Application 2024 & 2032
- Figure 29: North America Pain Management Devices Industry Revenue Share (%), by Application 2024 & 2032
- Figure 30: North America Pain Management Devices Industry Volume Share (%), by Application 2024 & 2032
- Figure 31: North America Pain Management Devices Industry Revenue (Million), by End-User 2024 & 2032
- Figure 32: North America Pain Management Devices Industry Volume (K Unit), by End-User 2024 & 2032
- Figure 33: North America Pain Management Devices Industry Revenue Share (%), by End-User 2024 & 2032
- Figure 34: North America Pain Management Devices Industry Volume Share (%), by End-User 2024 & 2032
- Figure 35: North America Pain Management Devices Industry Revenue (Million), by Country 2024 & 2032
- Figure 36: North America Pain Management Devices Industry Volume (K Unit), by Country 2024 & 2032
- Figure 37: North America Pain Management Devices Industry Revenue Share (%), by Country 2024 & 2032
- Figure 38: North America Pain Management Devices Industry Volume Share (%), by Country 2024 & 2032
- Figure 39: Europe Pain Management Devices Industry Revenue (Million), by Product Type 2024 & 2032
- Figure 40: Europe Pain Management Devices Industry Volume (K Unit), by Product Type 2024 & 2032
- Figure 41: Europe Pain Management Devices Industry Revenue Share (%), by Product Type 2024 & 2032
- Figure 42: Europe Pain Management Devices Industry Volume Share (%), by Product Type 2024 & 2032
- Figure 43: Europe Pain Management Devices Industry Revenue (Million), by Application 2024 & 2032
- Figure 44: Europe Pain Management Devices Industry Volume (K Unit), by Application 2024 & 2032
- Figure 45: Europe Pain Management Devices Industry Revenue Share (%), by Application 2024 & 2032
- Figure 46: Europe Pain Management Devices Industry Volume Share (%), by Application 2024 & 2032
- Figure 47: Europe Pain Management Devices Industry Revenue (Million), by End-User 2024 & 2032
- Figure 48: Europe Pain Management Devices Industry Volume (K Unit), by End-User 2024 & 2032
- Figure 49: Europe Pain Management Devices Industry Revenue Share (%), by End-User 2024 & 2032
- Figure 50: Europe Pain Management Devices Industry Volume Share (%), by End-User 2024 & 2032
- Figure 51: Europe Pain Management Devices Industry Revenue (Million), by Country 2024 & 2032
- Figure 52: Europe Pain Management Devices Industry Volume (K Unit), by Country 2024 & 2032
- Figure 53: Europe Pain Management Devices Industry Revenue Share (%), by Country 2024 & 2032
- Figure 54: Europe Pain Management Devices Industry Volume Share (%), by Country 2024 & 2032
- Figure 55: Asia Pacific Pain Management Devices Industry Revenue (Million), by Product Type 2024 & 2032
- Figure 56: Asia Pacific Pain Management Devices Industry Volume (K Unit), by Product Type 2024 & 2032
- Figure 57: Asia Pacific Pain Management Devices Industry Revenue Share (%), by Product Type 2024 & 2032
- Figure 58: Asia Pacific Pain Management Devices Industry Volume Share (%), by Product Type 2024 & 2032
- Figure 59: Asia Pacific Pain Management Devices Industry Revenue (Million), by Application 2024 & 2032
- Figure 60: Asia Pacific Pain Management Devices Industry Volume (K Unit), by Application 2024 & 2032
- Figure 61: Asia Pacific Pain Management Devices Industry Revenue Share (%), by Application 2024 & 2032
- Figure 62: Asia Pacific Pain Management Devices Industry Volume Share (%), by Application 2024 & 2032
- Figure 63: Asia Pacific Pain Management Devices Industry Revenue (Million), by End-User 2024 & 2032
- Figure 64: Asia Pacific Pain Management Devices Industry Volume (K Unit), by End-User 2024 & 2032
- Figure 65: Asia Pacific Pain Management Devices Industry Revenue Share (%), by End-User 2024 & 2032
- Figure 66: Asia Pacific Pain Management Devices Industry Volume Share (%), by End-User 2024 & 2032
- Figure 67: Asia Pacific Pain Management Devices Industry Revenue (Million), by Country 2024 & 2032
- Figure 68: Asia Pacific Pain Management Devices Industry Volume (K Unit), by Country 2024 & 2032
- Figure 69: Asia Pacific Pain Management Devices Industry Revenue Share (%), by Country 2024 & 2032
- Figure 70: Asia Pacific Pain Management Devices Industry Volume Share (%), by Country 2024 & 2032
- Figure 71: Middle East and Africa Pain Management Devices Industry Revenue (Million), by Product Type 2024 & 2032
- Figure 72: Middle East and Africa Pain Management Devices Industry Volume (K Unit), by Product Type 2024 & 2032
- Figure 73: Middle East and Africa Pain Management Devices Industry Revenue Share (%), by Product Type 2024 & 2032
- Figure 74: Middle East and Africa Pain Management Devices Industry Volume Share (%), by Product Type 2024 & 2032
- Figure 75: Middle East and Africa Pain Management Devices Industry Revenue (Million), by Application 2024 & 2032
- Figure 76: Middle East and Africa Pain Management Devices Industry Volume (K Unit), by Application 2024 & 2032
- Figure 77: Middle East and Africa Pain Management Devices Industry Revenue Share (%), by Application 2024 & 2032
- Figure 78: Middle East and Africa Pain Management Devices Industry Volume Share (%), by Application 2024 & 2032
- Figure 79: Middle East and Africa Pain Management Devices Industry Revenue (Million), by End-User 2024 & 2032
- Figure 80: Middle East and Africa Pain Management Devices Industry Volume (K Unit), by End-User 2024 & 2032
- Figure 81: Middle East and Africa Pain Management Devices Industry Revenue Share (%), by End-User 2024 & 2032
- Figure 82: Middle East and Africa Pain Management Devices Industry Volume Share (%), by End-User 2024 & 2032
- Figure 83: Middle East and Africa Pain Management Devices Industry Revenue (Million), by Country 2024 & 2032
- Figure 84: Middle East and Africa Pain Management Devices Industry Volume (K Unit), by Country 2024 & 2032
- Figure 85: Middle East and Africa Pain Management Devices Industry Revenue Share (%), by Country 2024 & 2032
- Figure 86: Middle East and Africa Pain Management Devices Industry Volume Share (%), by Country 2024 & 2032
- Figure 87: South America Pain Management Devices Industry Revenue (Million), by Product Type 2024 & 2032
- Figure 88: South America Pain Management Devices Industry Volume (K Unit), by Product Type 2024 & 2032
- Figure 89: South America Pain Management Devices Industry Revenue Share (%), by Product Type 2024 & 2032
- Figure 90: South America Pain Management Devices Industry Volume Share (%), by Product Type 2024 & 2032
- Figure 91: South America Pain Management Devices Industry Revenue (Million), by Application 2024 & 2032
- Figure 92: South America Pain Management Devices Industry Volume (K Unit), by Application 2024 & 2032
- Figure 93: South America Pain Management Devices Industry Revenue Share (%), by Application 2024 & 2032
- Figure 94: South America Pain Management Devices Industry Volume Share (%), by Application 2024 & 2032
- Figure 95: South America Pain Management Devices Industry Revenue (Million), by End-User 2024 & 2032
- Figure 96: South America Pain Management Devices Industry Volume (K Unit), by End-User 2024 & 2032
- Figure 97: South America Pain Management Devices Industry Revenue Share (%), by End-User 2024 & 2032
- Figure 98: South America Pain Management Devices Industry Volume Share (%), by End-User 2024 & 2032
- Figure 99: South America Pain Management Devices Industry Revenue (Million), by Country 2024 & 2032
- Figure 100: South America Pain Management Devices Industry Volume (K Unit), by Country 2024 & 2032
- Figure 101: South America Pain Management Devices Industry Revenue Share (%), by Country 2024 & 2032
- Figure 102: South America Pain Management Devices Industry Volume Share (%), by Country 2024 & 2032
List of Tables
- Table 1: Global Pain Management Devices Industry Revenue Million Forecast, by Region 2019 & 2032
- Table 2: Global Pain Management Devices Industry Volume K Unit Forecast, by Region 2019 & 2032
- Table 3: Global Pain Management Devices Industry Revenue Million Forecast, by Product Type 2019 & 2032
- Table 4: Global Pain Management Devices Industry Volume K Unit Forecast, by Product Type 2019 & 2032
- Table 5: Global Pain Management Devices Industry Revenue Million Forecast, by Application 2019 & 2032
- Table 6: Global Pain Management Devices Industry Volume K Unit Forecast, by Application 2019 & 2032
- Table 7: Global Pain Management Devices Industry Revenue Million Forecast, by End-User 2019 & 2032
- Table 8: Global Pain Management Devices Industry Volume K Unit Forecast, by End-User 2019 & 2032
- Table 9: Global Pain Management Devices Industry Revenue Million Forecast, by Region 2019 & 2032
- Table 10: Global Pain Management Devices Industry Volume K Unit Forecast, by Region 2019 & 2032
- Table 11: Global Pain Management Devices Industry Revenue Million Forecast, by Country 2019 & 2032
- Table 12: Global Pain Management Devices Industry Volume K Unit Forecast, by Country 2019 & 2032
- Table 13: Global Pain Management Devices Industry Revenue Million Forecast, by Country 2019 & 2032
- Table 14: Global Pain Management Devices Industry Volume K Unit Forecast, by Country 2019 & 2032
- Table 15: Global Pain Management Devices Industry Revenue Million Forecast, by Country 2019 & 2032
- Table 16: Global Pain Management Devices Industry Volume K Unit Forecast, by Country 2019 & 2032
- Table 17: Global Pain Management Devices Industry Revenue Million Forecast, by Country 2019 & 2032
- Table 18: Global Pain Management Devices Industry Volume K Unit Forecast, by Country 2019 & 2032
- Table 19: Global Pain Management Devices Industry Revenue Million Forecast, by Country 2019 & 2032
- Table 20: Global Pain Management Devices Industry Volume K Unit Forecast, by Country 2019 & 2032
- Table 21: Global Pain Management Devices Industry Revenue Million Forecast, by Product Type 2019 & 2032
- Table 22: Global Pain Management Devices Industry Volume K Unit Forecast, by Product Type 2019 & 2032
- Table 23: Global Pain Management Devices Industry Revenue Million Forecast, by Application 2019 & 2032
- Table 24: Global Pain Management Devices Industry Volume K Unit Forecast, by Application 2019 & 2032
- Table 25: Global Pain Management Devices Industry Revenue Million Forecast, by End-User 2019 & 2032
- Table 26: Global Pain Management Devices Industry Volume K Unit Forecast, by End-User 2019 & 2032
- Table 27: Global Pain Management Devices Industry Revenue Million Forecast, by Country 2019 & 2032
- Table 28: Global Pain Management Devices Industry Volume K Unit Forecast, by Country 2019 & 2032
- Table 29: United States Pain Management Devices Industry Revenue (Million) Forecast, by Application 2019 & 2032
- Table 30: United States Pain Management Devices Industry Volume (K Unit) Forecast, by Application 2019 & 2032
- Table 31: Canada Pain Management Devices Industry Revenue (Million) Forecast, by Application 2019 & 2032
- Table 32: Canada Pain Management Devices Industry Volume (K Unit) Forecast, by Application 2019 & 2032
- Table 33: Mexico Pain Management Devices Industry Revenue (Million) Forecast, by Application 2019 & 2032
- Table 34: Mexico Pain Management Devices Industry Volume (K Unit) Forecast, by Application 2019 & 2032
- Table 35: Global Pain Management Devices Industry Revenue Million Forecast, by Product Type 2019 & 2032
- Table 36: Global Pain Management Devices Industry Volume K Unit Forecast, by Product Type 2019 & 2032
- Table 37: Global Pain Management Devices Industry Revenue Million Forecast, by Application 2019 & 2032
- Table 38: Global Pain Management Devices Industry Volume K Unit Forecast, by Application 2019 & 2032
- Table 39: Global Pain Management Devices Industry Revenue Million Forecast, by End-User 2019 & 2032
- Table 40: Global Pain Management Devices Industry Volume K Unit Forecast, by End-User 2019 & 2032
- Table 41: Global Pain Management Devices Industry Revenue Million Forecast, by Country 2019 & 2032
- Table 42: Global Pain Management Devices Industry Volume K Unit Forecast, by Country 2019 & 2032
- Table 43: Germany Pain Management Devices Industry Revenue (Million) Forecast, by Application 2019 & 2032
- Table 44: Germany Pain Management Devices Industry Volume (K Unit) Forecast, by Application 2019 & 2032
- Table 45: United Kingdom Pain Management Devices Industry Revenue (Million) Forecast, by Application 2019 & 2032
- Table 46: United Kingdom Pain Management Devices Industry Volume (K Unit) Forecast, by Application 2019 & 2032
- Table 47: France Pain Management Devices Industry Revenue (Million) Forecast, by Application 2019 & 2032
- Table 48: France Pain Management Devices Industry Volume (K Unit) Forecast, by Application 2019 & 2032
- Table 49: Italy Pain Management Devices Industry Revenue (Million) Forecast, by Application 2019 & 2032
- Table 50: Italy Pain Management Devices Industry Volume (K Unit) Forecast, by Application 2019 & 2032
- Table 51: Spain Pain Management Devices Industry Revenue (Million) Forecast, by Application 2019 & 2032
- Table 52: Spain Pain Management Devices Industry Volume (K Unit) Forecast, by Application 2019 & 2032
- Table 53: Rest of Europe Pain Management Devices Industry Revenue (Million) Forecast, by Application 2019 & 2032
- Table 54: Rest of Europe Pain Management Devices Industry Volume (K Unit) Forecast, by Application 2019 & 2032
- Table 55: Global Pain Management Devices Industry Revenue Million Forecast, by Product Type 2019 & 2032
- Table 56: Global Pain Management Devices Industry Volume K Unit Forecast, by Product Type 2019 & 2032
- Table 57: Global Pain Management Devices Industry Revenue Million Forecast, by Application 2019 & 2032
- Table 58: Global Pain Management Devices Industry Volume K Unit Forecast, by Application 2019 & 2032
- Table 59: Global Pain Management Devices Industry Revenue Million Forecast, by End-User 2019 & 2032
- Table 60: Global Pain Management Devices Industry Volume K Unit Forecast, by End-User 2019 & 2032
- Table 61: Global Pain Management Devices Industry Revenue Million Forecast, by Country 2019 & 2032
- Table 62: Global Pain Management Devices Industry Volume K Unit Forecast, by Country 2019 & 2032
- Table 63: China Pain Management Devices Industry Revenue (Million) Forecast, by Application 2019 & 2032
- Table 64: China Pain Management Devices Industry Volume (K Unit) Forecast, by Application 2019 & 2032
- Table 65: Japan Pain Management Devices Industry Revenue (Million) Forecast, by Application 2019 & 2032
- Table 66: Japan Pain Management Devices Industry Volume (K Unit) Forecast, by Application 2019 & 2032
- Table 67: India Pain Management Devices Industry Revenue (Million) Forecast, by Application 2019 & 2032
- Table 68: India Pain Management Devices Industry Volume (K Unit) Forecast, by Application 2019 & 2032
- Table 69: Australia Pain Management Devices Industry Revenue (Million) Forecast, by Application 2019 & 2032
- Table 70: Australia Pain Management Devices Industry Volume (K Unit) Forecast, by Application 2019 & 2032
- Table 71: South Korea Pain Management Devices Industry Revenue (Million) Forecast, by Application 2019 & 2032
- Table 72: South Korea Pain Management Devices Industry Volume (K Unit) Forecast, by Application 2019 & 2032
- Table 73: Rest of Asia Pacific Pain Management Devices Industry Revenue (Million) Forecast, by Application 2019 & 2032
- Table 74: Rest of Asia Pacific Pain Management Devices Industry Volume (K Unit) Forecast, by Application 2019 & 2032
- Table 75: Global Pain Management Devices Industry Revenue Million Forecast, by Product Type 2019 & 2032
- Table 76: Global Pain Management Devices Industry Volume K Unit Forecast, by Product Type 2019 & 2032
- Table 77: Global Pain Management Devices Industry Revenue Million Forecast, by Application 2019 & 2032
- Table 78: Global Pain Management Devices Industry Volume K Unit Forecast, by Application 2019 & 2032
- Table 79: Global Pain Management Devices Industry Revenue Million Forecast, by End-User 2019 & 2032
- Table 80: Global Pain Management Devices Industry Volume K Unit Forecast, by End-User 2019 & 2032
- Table 81: Global Pain Management Devices Industry Revenue Million Forecast, by Country 2019 & 2032
- Table 82: Global Pain Management Devices Industry Volume K Unit Forecast, by Country 2019 & 2032
- Table 83: GCC Pain Management Devices Industry Revenue (Million) Forecast, by Application 2019 & 2032
- Table 84: GCC Pain Management Devices Industry Volume (K Unit) Forecast, by Application 2019 & 2032
- Table 85: South Africa Pain Management Devices Industry Revenue (Million) Forecast, by Application 2019 & 2032
- Table 86: South Africa Pain Management Devices Industry Volume (K Unit) Forecast, by Application 2019 & 2032
- Table 87: Rest of Middle East and Africa Pain Management Devices Industry Revenue (Million) Forecast, by Application 2019 & 2032
- Table 88: Rest of Middle East and Africa Pain Management Devices Industry Volume (K Unit) Forecast, by Application 2019 & 2032
- Table 89: Global Pain Management Devices Industry Revenue Million Forecast, by Product Type 2019 & 2032
- Table 90: Global Pain Management Devices Industry Volume K Unit Forecast, by Product Type 2019 & 2032
- Table 91: Global Pain Management Devices Industry Revenue Million Forecast, by Application 2019 & 2032
- Table 92: Global Pain Management Devices Industry Volume K Unit Forecast, by Application 2019 & 2032
- Table 93: Global Pain Management Devices Industry Revenue Million Forecast, by End-User 2019 & 2032
- Table 94: Global Pain Management Devices Industry Volume K Unit Forecast, by End-User 2019 & 2032
- Table 95: Global Pain Management Devices Industry Revenue Million Forecast, by Country 2019 & 2032
- Table 96: Global Pain Management Devices Industry Volume K Unit Forecast, by Country 2019 & 2032
- Table 97: Brazil Pain Management Devices Industry Revenue (Million) Forecast, by Application 2019 & 2032
- Table 98: Brazil Pain Management Devices Industry Volume (K Unit) Forecast, by Application 2019 & 2032
- Table 99: Argentina Pain Management Devices Industry Revenue (Million) Forecast, by Application 2019 & 2032
- Table 100: Argentina Pain Management Devices Industry Volume (K Unit) Forecast, by Application 2019 & 2032
- Table 101: Rest of South America Pain Management Devices Industry Revenue (Million) Forecast, by Application 2019 & 2032
- Table 102: Rest of South America Pain Management Devices Industry Volume (K Unit) Forecast, by Application 2019 & 2032
Frequently Asked Questions
1. What is the projected Compound Annual Growth Rate (CAGR) of the Pain Management Devices Industry?
The projected CAGR is approximately 9.70%.
2. Which companies are prominent players in the Pain Management Devices Industry?
Key companies in the market include ICU Medical Inc, LivaNova, DJO Global LLC, Enovis, Medtronic, Baxter, Stryker, Abbott, Boston Scientific Corporation, Nevro Cor, Stim Wave LLC, SPR Therapeutics.
3. What are the main segments of the Pain Management Devices Industry?
The market segments include Product Type, Application, End-User.
4. Can you provide details about the market size?
The market size is estimated to be USD 10.64 Million as of 2022.
5. What are some drivers contributing to market growth?
The advent of Innovative and Technologically Advanced Pain Management Devices; Increase in Adoption of Pain Management Devices; Rise in Geriatric Population.
6. What are the notable trends driving market growth?
The neuropathic pain management devices segment counted for the largest share of the global market and witness significant growth.
7. Are there any restraints impacting market growth?
Preferable use of medications for pain management.
8. Can you provide examples of recent developments in the market?
In June 2022, Coach Care has partnered with (Nexstim NBT System) NXTSTIM to Offer World's First Commercial (remote patient monitoring) RPM and Wellness Monitoring Device for Pain Management
9. What pricing options are available for accessing the report?
Pricing options include single-user, multi-user, and enterprise licenses priced at USD 4750, USD 5250, and USD 8750 respectively.
10. Is the market size provided in terms of value or volume?
The market size is provided in terms of value, measured in Million and volume, measured in K Unit.
11. Are there any specific market keywords associated with the report?
Yes, the market keyword associated with the report is "Pain Management Devices Industry," which aids in identifying and referencing the specific market segment covered.
12. How do I determine which pricing option suits my needs best?
The pricing options vary based on user requirements and access needs. Individual users may opt for single-user licenses, while businesses requiring broader access may choose multi-user or enterprise licenses for cost-effective access to the report.
13. Are there any additional resources or data provided in the Pain Management Devices Industry report?
While the report offers comprehensive insights, it's advisable to review the specific contents or supplementary materials provided to ascertain if additional resources or data are available.
14. How can I stay updated on further developments or reports in the Pain Management Devices Industry?
To stay informed about further developments, trends, and reports in the Pain Management Devices Industry, consider subscribing to industry newsletters, following relevant companies and organizations, or regularly checking reputable industry news sources and publications.
Methodology
Step 1 - Identification of Relevant Samples Size from Population Database


Step 2 - Approaches for Defining Global Market Size (Value, Volume* & Price*)

Note*: In applicable scenarios
Step 3 - Data Sources
Primary Research
- Web Analytics
- Survey Reports
- Research Institute
- Latest Research Reports
- Opinion Leaders
Secondary Research
- Annual Reports
- White Paper
- Latest Press Release
- Industry Association
- Paid Database
- Investor Presentations

Step 4 - Data Triangulation
Involves using different sources of information in order to increase the validity of a study
These sources are likely to be stakeholders in a program - participants, other researchers, program staff, other community members, and so on.
Then we put all data in single framework & apply various statistical tools to find out the dynamic on the market.
During the analysis stage, feedback from the stakeholder groups would be compared to determine areas of agreement as well as areas of divergence


