

Key Insights
The global Packaging Artwork Management Software market is poised for substantial growth, projected to reach USD 9.93 billion by 2025, with a remarkable Compound Annual Growth Rate (CAGR) of 15.8% from 2019 to 2033. This dynamic expansion is fueled by the escalating demand for sophisticated solutions that streamline the complex and often time-consuming process of creating and managing packaging artwork. Key drivers include the increasing need for regulatory compliance, brand consistency across diverse product lines, and the imperative to accelerate product launches in competitive markets. The software's ability to enhance collaboration among stakeholders, reduce errors, and ensure brand integrity makes it indispensable for businesses across various sectors. Furthermore, the growing emphasis on sustainability and the need for accurate labeling of product information are further propelling adoption. The market is segmented into applications for Small and Medium-sized Enterprises (SMEs) and Large Enterprises, with a growing preference for Cloud-Based solutions over traditional On-premises deployments due to their scalability, flexibility, and cost-effectiveness.
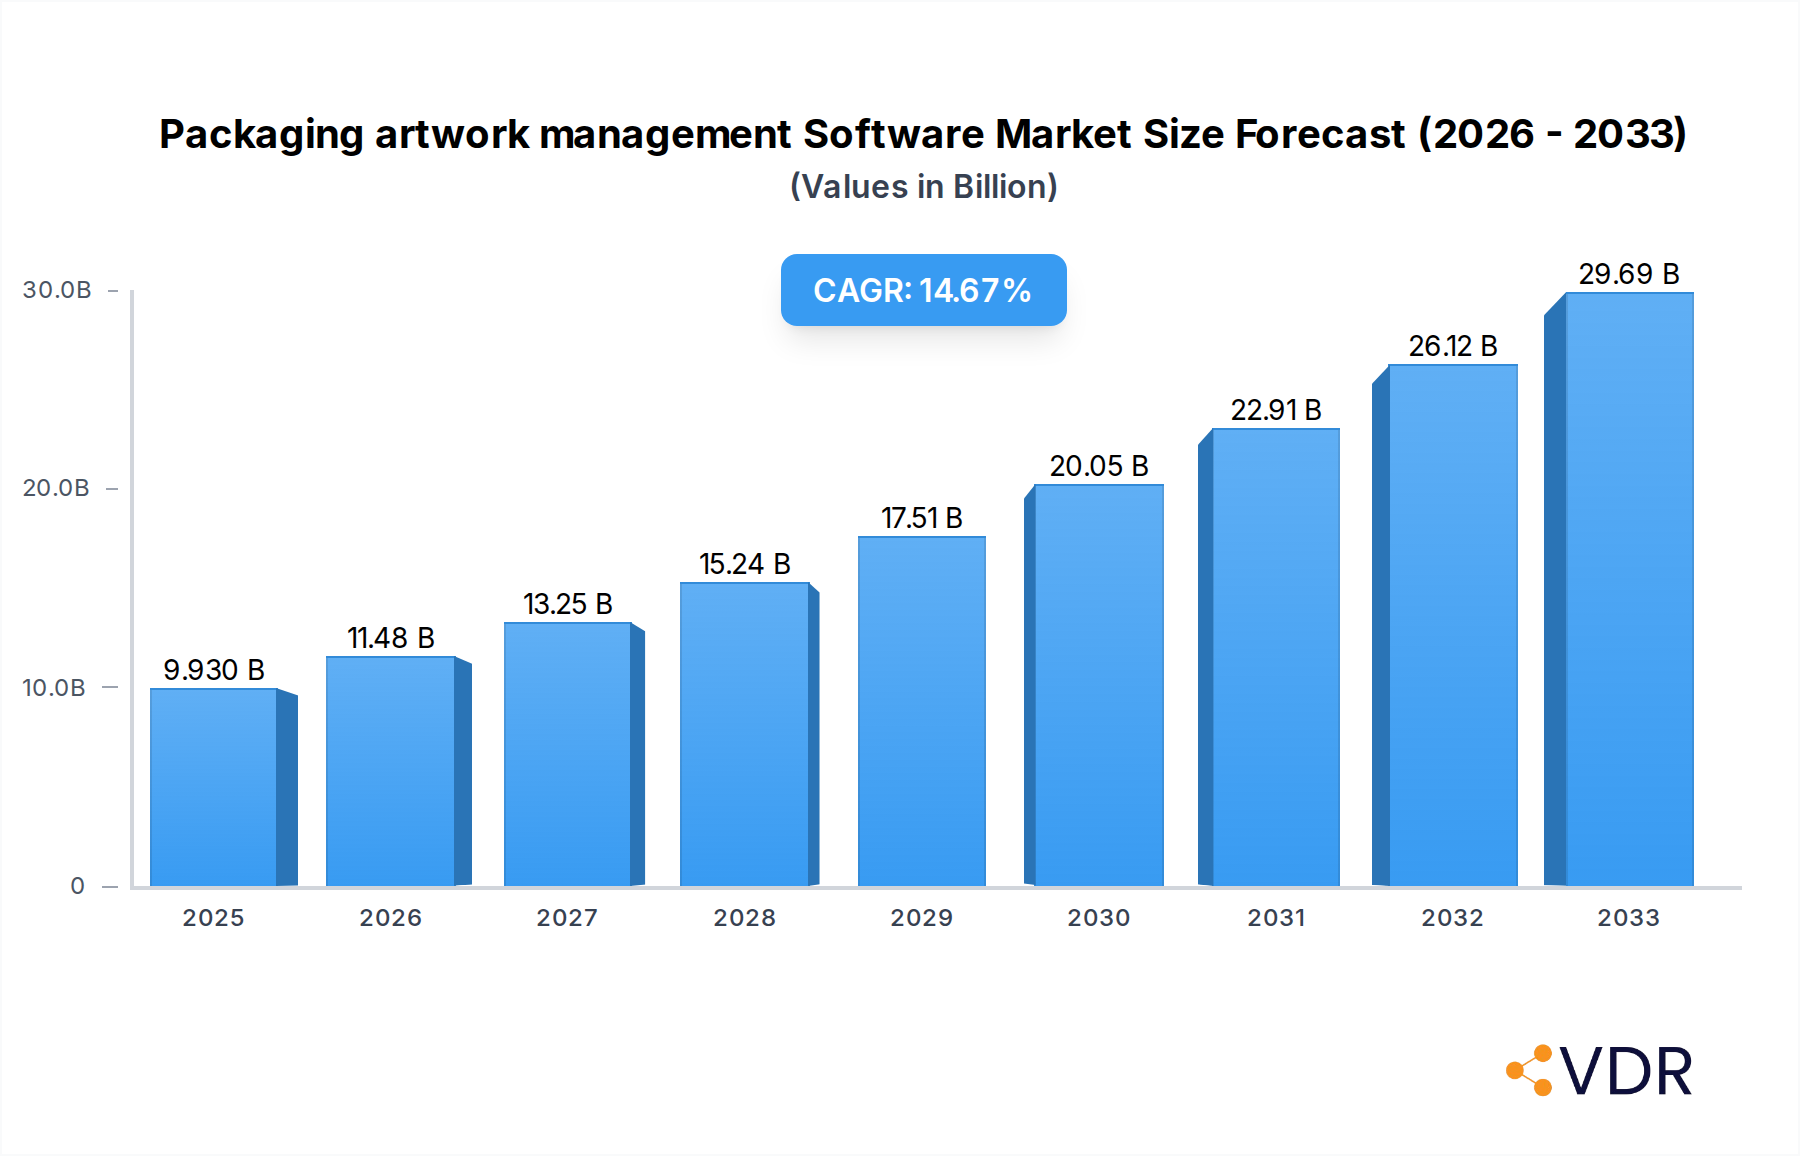
Packaging artwork management Software Market Size (In Billion)
The packaging artwork management software landscape is characterized by intense competition and continuous innovation. Leading companies like Esko, Seagull Scientific, Loftware, and NiceLabel are actively developing advanced features, including AI-powered design assistance, enhanced version control, and seamless integration with supply chain management systems. Emerging trends include the rise of automated artwork generation, the integration of augmented reality (AR) for packaging visualization, and a greater focus on data security and intellectual property protection. While the market exhibits robust growth, potential restraints might include the initial investment cost for some advanced solutions and the need for specialized training for users. However, the demonstrable return on investment through improved efficiency, reduced rework, and faster time-to-market is expected to outweigh these challenges, ensuring continued strong market performance. The Asia Pacific region, driven by rapid industrialization and a burgeoning consumer market, alongside North America and Europe, is expected to be a significant contributor to the market's expansion.

Packaging artwork management Software Company Market Share
This in-depth report provides a comprehensive analysis of the global Packaging Artwork Management Software market, spanning from 2019 to 2033, with a base year of 2025 and a forecast period from 2025 to 2033. It delves into market dynamics, growth trends, regional dominance, product landscapes, key drivers, barriers, challenges, emerging opportunities, growth accelerators, and a detailed outlook on the industry's future. The report incorporates high-traffic keywords, parent and child market segmentation, and quantitative data to offer actionable insights for industry professionals.
Packaging artwork management Software Market Dynamics & Structure
The global Packaging Artwork Management Software market exhibits a moderately concentrated structure, with established players like Esko, Seagull Scientific, Loftware, and NiceLabel holding significant market shares. Technological innovation is a primary driver, fueled by the increasing demand for streamlined label and packaging design, regulatory compliance, and reduced time-to-market. The increasing adoption of digital workflows and automation across industries, particularly in the CPG (Consumer Packaged Goods) and pharmaceutical sectors, is further accelerating this trend. Regulatory frameworks, such as those governing product labeling accuracy and safety, necessitate robust artwork management solutions. Competitive product substitutes, while present in the form of manual processes and less integrated design tools, are gradually being overshadowed by sophisticated, dedicated software. End-user demographics reveal a growing reliance on these solutions by both Small and Medium-sized Enterprises (SMEs) seeking cost-effective and scalable solutions, and Large Enterprises demanding complex workflow automation and global brand consistency. Mergers and acquisitions (M&A) trends are indicative of market consolidation and strategic expansion, with companies acquiring complementary technologies or customer bases. For instance, recent M&A activities have focused on integrating AI-powered features and cloud-based delivery models. The barriers to innovation often stem from legacy system integration challenges and the significant investment required for comprehensive software overhauls. The market size for packaging artwork management software is projected to reach USD 5.2 billion by 2025, with an estimated market share of 35% for cloud-based solutions.
Packaging artwork management Software Growth Trends & Insights
The global Packaging Artwork Management Software market is poised for substantial growth, driven by a confluence of technological advancements, evolving industry demands, and shifting consumer behaviors. The market size is projected to expand from an estimated USD 5.2 billion in the base year 2025 to an impressive USD 9.5 billion by the end of the forecast period in 2033, exhibiting a Compound Annual Growth Rate (CAGR) of approximately 7.8%. This robust growth trajectory is underpinned by the increasing adoption rates of specialized software solutions across various industries, including food and beverage, pharmaceuticals, cosmetics, and electronics. The digital transformation imperative, coupled with the growing complexity of global supply chains and stringent regulatory compliance requirements, is compelling businesses to invest in efficient and centralized artwork management systems. Technological disruptions, such as the integration of Artificial Intelligence (AI) and Machine Learning (ML) for automated design checks, color management, and plagiarism detection, are significantly enhancing the capabilities and appeal of these software platforms. Furthermore, the proliferation of e-commerce and direct-to-consumer (DTC) models is creating a heightened need for localized and dynamic packaging artwork that can be rapidly updated and deployed across diverse markets. Consumer behavior shifts, including a growing emphasis on sustainability and product transparency, are also influencing artwork requirements, demanding accurate and verifiable ingredient lists, recycling information, and brand storytelling. Market penetration is steadily increasing, particularly within the SME segment, as cloud-based solutions offer greater accessibility and affordability. The shift towards cloud-based deployment models, accounting for an estimated 65% of the market by 2033, signifies a move towards greater scalability, flexibility, and data accessibility, further accelerating adoption. The increasing demand for brand consistency across an ever-expanding array of SKUs and marketing channels is a critical growth driver, making centralized artwork management a non-negotiable requirement for competitive businesses.
Dominant Regions, Countries, or Segments in Packaging artwork management Software
North America currently stands as the dominant region in the Packaging Artwork Management Software market, driven by its mature industrial landscape, strong emphasis on innovation, and stringent regulatory environment. The United States, in particular, contributes significantly to this dominance due to the presence of a large number of CPG giants and pharmaceutical companies that are early adopters of advanced technological solutions. The region's robust economic policies that foster business growth and investment in digital infrastructure further cement its leading position. Within North America, Large Enterprises represent the largest segment, accounting for an estimated 70% of the market share in 2025, due to their complex operational needs, extensive product portfolios, and global brand management requirements. However, the SME segment is experiencing a higher CAGR of approximately 8.5%, fueled by the increasing availability of affordable cloud-based solutions and a growing awareness of the benefits of professional artwork management. In terms of deployment types, Cloud-Based solutions are rapidly gaining traction and are projected to account for over 60% of the market in North America by 2033, offering scalability, accessibility, and cost-effectiveness. Key drivers for this dominance include a proactive regulatory framework that mandates accurate and compliant labeling, a highly competitive market that demands rapid product launches and visual differentiation, and a well-established ecosystem of technology providers and service partners. The market share for North America is estimated to be USD 2.1 billion in 2025, with a projected growth to USD 3.8 billion by 2033. The presence of leading companies like Esko and Seagull Scientific, with their extensive portfolios and established customer bases, further solidifies this regional leadership. The ongoing digitalization of manufacturing processes and the increasing focus on supply chain transparency are expected to maintain North America's lead in the foreseeable future, even as other regions experience rapid growth.
Packaging artwork management Software Product Landscape
The Packaging Artwork Management Software product landscape is characterized by a rapid evolution of features and functionalities, driven by the need for enhanced efficiency, compliance, and collaboration. Leading solutions offer robust capabilities such as version control, digital proofing, automated color management, and integration with Enterprise Resource Planning (ERP) and Product Lifecycle Management (PLM) systems. Innovations include AI-powered tools for error detection and brand compliance checks, significantly reducing manual intervention and the risk of costly mistakes. Cloud-based platforms are increasingly common, providing seamless access and real-time collaboration for geographically dispersed teams. Unique selling propositions often revolve around specialized industry modules, advanced workflow automation, and comprehensive audit trails, crucial for regulated industries. Technological advancements are focused on improving user experience, integrating with emerging printing technologies, and ensuring data security and integrity throughout the artwork lifecycle.
Key Drivers, Barriers & Challenges in Packaging artwork management Software
Key Drivers:
- Growing demand for regulatory compliance: Stringent global regulations regarding product labeling, ingredient disclosure, and safety necessitate accurate and auditable artwork management.
- Need for brand consistency and differentiation: In a competitive market, maintaining consistent branding across diverse products and regions is critical.
- Increasing complexity of supply chains: Globalized operations require efficient collaboration and streamlined artwork workflows.
- Digital transformation initiatives: Businesses are investing in automation and digital tools to enhance operational efficiency.
- E-commerce growth: The rise of online retail demands faster product updates and localized packaging variations.
Barriers & Challenges:
- High initial investment and implementation costs: Deploying comprehensive software solutions can be a significant financial undertaking.
- Integration with legacy systems: Many organizations face challenges in integrating new artwork management software with existing IT infrastructure.
- Resistance to change and user adoption: Overcoming established manual processes and training staff can be a hurdle.
- Data security and intellectual property concerns: Protecting sensitive design data is paramount.
- Shortage of skilled personnel: Finding individuals with expertise in both design and artwork management software can be challenging.
- Global supply chain disruptions: Unforeseen disruptions can impact the timely delivery and implementation of artwork.
- Intense competitive pressure: The market is competitive, requiring continuous innovation and differentiation.
Emerging Opportunities in Packaging artwork management Software
Emerging opportunities lie in the increasing demand for sustainability-focused artwork management, enabling businesses to track and communicate eco-friendly packaging initiatives effectively. The expansion of AI and ML integration presents significant potential for predictive analytics in design trends and automated quality control. Untapped markets include developing economies with growing consumer bases and nascent regulatory frameworks for packaging. The rise of serialization and track-and-trace requirements in pharmaceuticals and food industries offers a niche for specialized artwork management solutions. Furthermore, the integration of augmented reality (AR) for virtual product prototyping and in-store visualization of packaging is an emerging application that can be supported by advanced artwork management platforms.
Growth Accelerators in the Packaging artwork management Software Industry
The Packaging Artwork Management Software industry is experiencing accelerated growth driven by strategic partnerships between software providers and printing technology companies, fostering end-to-end workflow optimization. Technological breakthroughs in AI and automation are enabling more intelligent and efficient artwork creation and approval processes. Market expansion strategies, including targeted outreach to rapidly growing sectors like e-commerce and personalized medicine, are further fueling growth. The increasing adoption of cloud-native solutions that offer enhanced scalability and flexibility is also a significant growth accelerator, allowing businesses of all sizes to leverage advanced capabilities without substantial upfront infrastructure investment.
Key Players Shaping the Packaging artwork management Software Market
Esko, Seagull Scientific, Loftware, Twona, Kallik, NiceLabel, Kalypso, enLabel Global Services, BLUE SOFTWARE, ManageArtworks, Lascom CPG, Athreva, Karomi, Jupiter Prestige Group, GreatFour Systems, Managed Artwork, GLAMS.
Notable Milestones in Packaging artwork management Software Sector
- 2019: Launch of advanced AI-powered proofing tools by major vendors, enhancing error detection capabilities.
- 2020: Increased adoption of cloud-based solutions amidst global remote work trends.
- 2021: Significant M&A activity as larger players acquire niche technology providers to expand offerings.
- 2022: Introduction of enhanced sustainability reporting features within artwork management platforms.
- 2023: Greater integration with extended reality (XR) technologies for virtual prototyping and client approvals.
- 2024: Focus on cybersecurity enhancements and compliance with evolving data privacy regulations.
In-Depth Packaging artwork management Software Market Outlook
The future outlook for the Packaging Artwork Management Software market is exceptionally promising, driven by an insatiable demand for operational efficiency, global compliance, and compelling brand experiences. Growth accelerators such as continuous innovation in AI, the widespread adoption of cloud infrastructure, and strategic collaborations will propel the market forward. Strategic opportunities lie in catering to the burgeoning needs of sustainable packaging initiatives and leveraging the increasing sophistication of digital printing technologies. The market is anticipated to witness sustained growth as businesses across all sectors recognize the indispensable role of robust artwork management in navigating the complexities of modern product development and market entry.
Packaging artwork management Software Segmentation
-
1. Application
- 1.1. SMEs
- 1.2. Large Enterprises
-
2. Types
- 2.1. Cloud Based
- 2.2. On-premises
Packaging artwork management Software Segmentation By Geography
-
1. North America
- 1.1. United States
- 1.2. Canada
- 1.3. Mexico
-
2. South America
- 2.1. Brazil
- 2.2. Argentina
- 2.3. Rest of South America
-
3. Europe
- 3.1. United Kingdom
- 3.2. Germany
- 3.3. France
- 3.4. Italy
- 3.5. Spain
- 3.6. Russia
- 3.7. Benelux
- 3.8. Nordics
- 3.9. Rest of Europe
-
4. Middle East & Africa
- 4.1. Turkey
- 4.2. Israel
- 4.3. GCC
- 4.4. North Africa
- 4.5. South Africa
- 4.6. Rest of Middle East & Africa
-
5. Asia Pacific
- 5.1. China
- 5.2. India
- 5.3. Japan
- 5.4. South Korea
- 5.5. ASEAN
- 5.6. Oceania
- 5.7. Rest of Asia Pacific
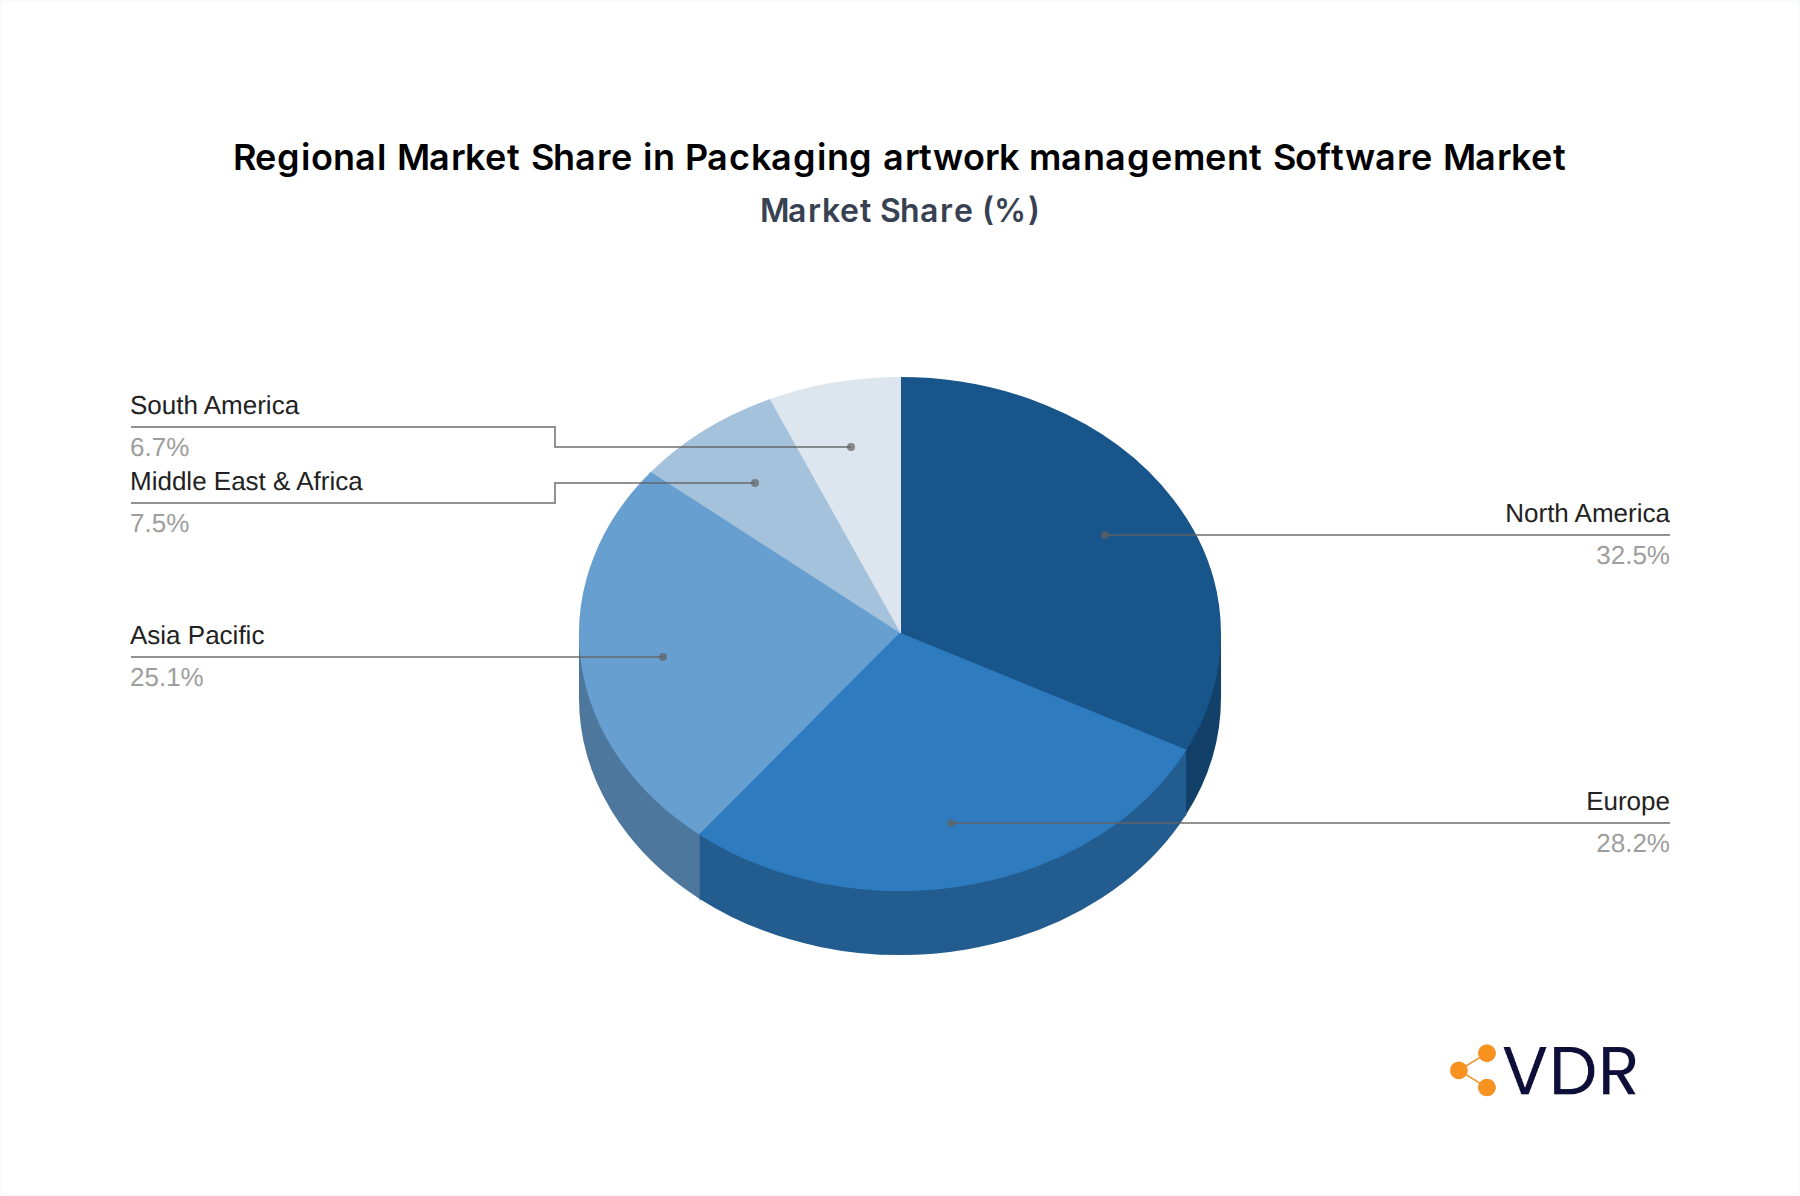
Packaging artwork management Software Regional Market Share
Geographic Coverage of Packaging artwork management Software
Packaging artwork management Software REPORT HIGHLIGHTS
| Aspects | Details |
|---|---|
| Study Period | 2020-2034 |
| Base Year | 2025 |
| Estimated Year | 2026 |
| Forecast Period | 2026-2034 |
| Historical Period | 2020-2025 |
| Growth Rate | CAGR of 15.8% from 2020-2034 |
| Segmentation |
|
Table of Contents
- 1. Introduction
- 1.1. Research Scope
- 1.2. Market Segmentation
- 1.3. Research Methodology
- 1.4. Definitions and Assumptions
- 2. Executive Summary
- 2.1. Introduction
- 3. Market Dynamics
- 3.1. Introduction
- 3.2. Market Drivers
- 3.3. Market Restrains
- 3.4. Market Trends
- 4. Market Factor Analysis
- 4.1. Porters Five Forces
- 4.2. Supply/Value Chain
- 4.3. PESTEL analysis
- 4.4. Market Entropy
- 4.5. Patent/Trademark Analysis
- 5. Global Packaging artwork management Software Analysis, Insights and Forecast, 2020-2032
- 5.1. Market Analysis, Insights and Forecast - by Application
- 5.1.1. SMEs
- 5.1.2. Large Enterprises
- 5.2. Market Analysis, Insights and Forecast - by Types
- 5.2.1. Cloud Based
- 5.2.2. On-premises
- 5.3. Market Analysis, Insights and Forecast - by Region
- 5.3.1. North America
- 5.3.2. South America
- 5.3.3. Europe
- 5.3.4. Middle East & Africa
- 5.3.5. Asia Pacific
- 5.1. Market Analysis, Insights and Forecast - by Application
- 6. North America Packaging artwork management Software Analysis, Insights and Forecast, 2020-2032
- 6.1. Market Analysis, Insights and Forecast - by Application
- 6.1.1. SMEs
- 6.1.2. Large Enterprises
- 6.2. Market Analysis, Insights and Forecast - by Types
- 6.2.1. Cloud Based
- 6.2.2. On-premises
- 6.1. Market Analysis, Insights and Forecast - by Application
- 7. South America Packaging artwork management Software Analysis, Insights and Forecast, 2020-2032
- 7.1. Market Analysis, Insights and Forecast - by Application
- 7.1.1. SMEs
- 7.1.2. Large Enterprises
- 7.2. Market Analysis, Insights and Forecast - by Types
- 7.2.1. Cloud Based
- 7.2.2. On-premises
- 7.1. Market Analysis, Insights and Forecast - by Application
- 8. Europe Packaging artwork management Software Analysis, Insights and Forecast, 2020-2032
- 8.1. Market Analysis, Insights and Forecast - by Application
- 8.1.1. SMEs
- 8.1.2. Large Enterprises
- 8.2. Market Analysis, Insights and Forecast - by Types
- 8.2.1. Cloud Based
- 8.2.2. On-premises
- 8.1. Market Analysis, Insights and Forecast - by Application
- 9. Middle East & Africa Packaging artwork management Software Analysis, Insights and Forecast, 2020-2032
- 9.1. Market Analysis, Insights and Forecast - by Application
- 9.1.1. SMEs
- 9.1.2. Large Enterprises
- 9.2. Market Analysis, Insights and Forecast - by Types
- 9.2.1. Cloud Based
- 9.2.2. On-premises
- 9.1. Market Analysis, Insights and Forecast - by Application
- 10. Asia Pacific Packaging artwork management Software Analysis, Insights and Forecast, 2020-2032
- 10.1. Market Analysis, Insights and Forecast - by Application
- 10.1.1. SMEs
- 10.1.2. Large Enterprises
- 10.2. Market Analysis, Insights and Forecast - by Types
- 10.2.1. Cloud Based
- 10.2.2. On-premises
- 10.1. Market Analysis, Insights and Forecast - by Application
- 11. Competitive Analysis
- 11.1. Global Market Share Analysis 2025
- 11.2. Company Profiles
- 11.2.1 Esko
- 11.2.1.1. Overview
- 11.2.1.2. Products
- 11.2.1.3. SWOT Analysis
- 11.2.1.4. Recent Developments
- 11.2.1.5. Financials (Based on Availability)
- 11.2.2 Seagull Scientific
- 11.2.2.1. Overview
- 11.2.2.2. Products
- 11.2.2.3. SWOT Analysis
- 11.2.2.4. Recent Developments
- 11.2.2.5. Financials (Based on Availability)
- 11.2.3 Loftware
- 11.2.3.1. Overview
- 11.2.3.2. Products
- 11.2.3.3. SWOT Analysis
- 11.2.3.4. Recent Developments
- 11.2.3.5. Financials (Based on Availability)
- 11.2.4 Twona
- 11.2.4.1. Overview
- 11.2.4.2. Products
- 11.2.4.3. SWOT Analysis
- 11.2.4.4. Recent Developments
- 11.2.4.5. Financials (Based on Availability)
- 11.2.5 Kallik
- 11.2.5.1. Overview
- 11.2.5.2. Products
- 11.2.5.3. SWOT Analysis
- 11.2.5.4. Recent Developments
- 11.2.5.5. Financials (Based on Availability)
- 11.2.6 NiceLabel
- 11.2.6.1. Overview
- 11.2.6.2. Products
- 11.2.6.3. SWOT Analysis
- 11.2.6.4. Recent Developments
- 11.2.6.5. Financials (Based on Availability)
- 11.2.7 Kalypso
- 11.2.7.1. Overview
- 11.2.7.2. Products
- 11.2.7.3. SWOT Analysis
- 11.2.7.4. Recent Developments
- 11.2.7.5. Financials (Based on Availability)
- 11.2.8 enLabel Global Services
- 11.2.8.1. Overview
- 11.2.8.2. Products
- 11.2.8.3. SWOT Analysis
- 11.2.8.4. Recent Developments
- 11.2.8.5. Financials (Based on Availability)
- 11.2.9 BLUE Software
- 11.2.9.1. Overview
- 11.2.9.2. Products
- 11.2.9.3. SWOT Analysis
- 11.2.9.4. Recent Developments
- 11.2.9.5. Financials (Based on Availability)
- 11.2.10 ManageArtworks
- 11.2.10.1. Overview
- 11.2.10.2. Products
- 11.2.10.3. SWOT Analysis
- 11.2.10.4. Recent Developments
- 11.2.10.5. Financials (Based on Availability)
- 11.2.11 Lascom CPG
- 11.2.11.1. Overview
- 11.2.11.2. Products
- 11.2.11.3. SWOT Analysis
- 11.2.11.4. Recent Developments
- 11.2.11.5. Financials (Based on Availability)
- 11.2.12 Athreva
- 11.2.12.1. Overview
- 11.2.12.2. Products
- 11.2.12.3. SWOT Analysis
- 11.2.12.4. Recent Developments
- 11.2.12.5. Financials (Based on Availability)
- 11.2.13 Karomi
- 11.2.13.1. Overview
- 11.2.13.2. Products
- 11.2.13.3. SWOT Analysis
- 11.2.13.4. Recent Developments
- 11.2.13.5. Financials (Based on Availability)
- 11.2.14 Jupiter Prestige Group
- 11.2.14.1. Overview
- 11.2.14.2. Products
- 11.2.14.3. SWOT Analysis
- 11.2.14.4. Recent Developments
- 11.2.14.5. Financials (Based on Availability)
- 11.2.15 GreatFour Systems
- 11.2.15.1. Overview
- 11.2.15.2. Products
- 11.2.15.3. SWOT Analysis
- 11.2.15.4. Recent Developments
- 11.2.15.5. Financials (Based on Availability)
- 11.2.16 Managed Artwork
- 11.2.16.1. Overview
- 11.2.16.2. Products
- 11.2.16.3. SWOT Analysis
- 11.2.16.4. Recent Developments
- 11.2.16.5. Financials (Based on Availability)
- 11.2.17 GLAMS
- 11.2.17.1. Overview
- 11.2.17.2. Products
- 11.2.17.3. SWOT Analysis
- 11.2.17.4. Recent Developments
- 11.2.17.5. Financials (Based on Availability)
- 11.2.1 Esko
List of Figures
- Figure 1: Global Packaging artwork management Software Revenue Breakdown (undefined, %) by Region 2025 & 2033
- Figure 2: North America Packaging artwork management Software Revenue (undefined), by Application 2025 & 2033
- Figure 3: North America Packaging artwork management Software Revenue Share (%), by Application 2025 & 2033
- Figure 4: North America Packaging artwork management Software Revenue (undefined), by Types 2025 & 2033
- Figure 5: North America Packaging artwork management Software Revenue Share (%), by Types 2025 & 2033
- Figure 6: North America Packaging artwork management Software Revenue (undefined), by Country 2025 & 2033
- Figure 7: North America Packaging artwork management Software Revenue Share (%), by Country 2025 & 2033
- Figure 8: South America Packaging artwork management Software Revenue (undefined), by Application 2025 & 2033
- Figure 9: South America Packaging artwork management Software Revenue Share (%), by Application 2025 & 2033
- Figure 10: South America Packaging artwork management Software Revenue (undefined), by Types 2025 & 2033
- Figure 11: South America Packaging artwork management Software Revenue Share (%), by Types 2025 & 2033
- Figure 12: South America Packaging artwork management Software Revenue (undefined), by Country 2025 & 2033
- Figure 13: South America Packaging artwork management Software Revenue Share (%), by Country 2025 & 2033
- Figure 14: Europe Packaging artwork management Software Revenue (undefined), by Application 2025 & 2033
- Figure 15: Europe Packaging artwork management Software Revenue Share (%), by Application 2025 & 2033
- Figure 16: Europe Packaging artwork management Software Revenue (undefined), by Types 2025 & 2033
- Figure 17: Europe Packaging artwork management Software Revenue Share (%), by Types 2025 & 2033
- Figure 18: Europe Packaging artwork management Software Revenue (undefined), by Country 2025 & 2033
- Figure 19: Europe Packaging artwork management Software Revenue Share (%), by Country 2025 & 2033
- Figure 20: Middle East & Africa Packaging artwork management Software Revenue (undefined), by Application 2025 & 2033
- Figure 21: Middle East & Africa Packaging artwork management Software Revenue Share (%), by Application 2025 & 2033
- Figure 22: Middle East & Africa Packaging artwork management Software Revenue (undefined), by Types 2025 & 2033
- Figure 23: Middle East & Africa Packaging artwork management Software Revenue Share (%), by Types 2025 & 2033
- Figure 24: Middle East & Africa Packaging artwork management Software Revenue (undefined), by Country 2025 & 2033
- Figure 25: Middle East & Africa Packaging artwork management Software Revenue Share (%), by Country 2025 & 2033
- Figure 26: Asia Pacific Packaging artwork management Software Revenue (undefined), by Application 2025 & 2033
- Figure 27: Asia Pacific Packaging artwork management Software Revenue Share (%), by Application 2025 & 2033
- Figure 28: Asia Pacific Packaging artwork management Software Revenue (undefined), by Types 2025 & 2033
- Figure 29: Asia Pacific Packaging artwork management Software Revenue Share (%), by Types 2025 & 2033
- Figure 30: Asia Pacific Packaging artwork management Software Revenue (undefined), by Country 2025 & 2033
- Figure 31: Asia Pacific Packaging artwork management Software Revenue Share (%), by Country 2025 & 2033
List of Tables
- Table 1: Global Packaging artwork management Software Revenue undefined Forecast, by Application 2020 & 2033
- Table 2: Global Packaging artwork management Software Revenue undefined Forecast, by Types 2020 & 2033
- Table 3: Global Packaging artwork management Software Revenue undefined Forecast, by Region 2020 & 2033
- Table 4: Global Packaging artwork management Software Revenue undefined Forecast, by Application 2020 & 2033
- Table 5: Global Packaging artwork management Software Revenue undefined Forecast, by Types 2020 & 2033
- Table 6: Global Packaging artwork management Software Revenue undefined Forecast, by Country 2020 & 2033
- Table 7: United States Packaging artwork management Software Revenue (undefined) Forecast, by Application 2020 & 2033
- Table 8: Canada Packaging artwork management Software Revenue (undefined) Forecast, by Application 2020 & 2033
- Table 9: Mexico Packaging artwork management Software Revenue (undefined) Forecast, by Application 2020 & 2033
- Table 10: Global Packaging artwork management Software Revenue undefined Forecast, by Application 2020 & 2033
- Table 11: Global Packaging artwork management Software Revenue undefined Forecast, by Types 2020 & 2033
- Table 12: Global Packaging artwork management Software Revenue undefined Forecast, by Country 2020 & 2033
- Table 13: Brazil Packaging artwork management Software Revenue (undefined) Forecast, by Application 2020 & 2033
- Table 14: Argentina Packaging artwork management Software Revenue (undefined) Forecast, by Application 2020 & 2033
- Table 15: Rest of South America Packaging artwork management Software Revenue (undefined) Forecast, by Application 2020 & 2033
- Table 16: Global Packaging artwork management Software Revenue undefined Forecast, by Application 2020 & 2033
- Table 17: Global Packaging artwork management Software Revenue undefined Forecast, by Types 2020 & 2033
- Table 18: Global Packaging artwork management Software Revenue undefined Forecast, by Country 2020 & 2033
- Table 19: United Kingdom Packaging artwork management Software Revenue (undefined) Forecast, by Application 2020 & 2033
- Table 20: Germany Packaging artwork management Software Revenue (undefined) Forecast, by Application 2020 & 2033
- Table 21: France Packaging artwork management Software Revenue (undefined) Forecast, by Application 2020 & 2033
- Table 22: Italy Packaging artwork management Software Revenue (undefined) Forecast, by Application 2020 & 2033
- Table 23: Spain Packaging artwork management Software Revenue (undefined) Forecast, by Application 2020 & 2033
- Table 24: Russia Packaging artwork management Software Revenue (undefined) Forecast, by Application 2020 & 2033
- Table 25: Benelux Packaging artwork management Software Revenue (undefined) Forecast, by Application 2020 & 2033
- Table 26: Nordics Packaging artwork management Software Revenue (undefined) Forecast, by Application 2020 & 2033
- Table 27: Rest of Europe Packaging artwork management Software Revenue (undefined) Forecast, by Application 2020 & 2033
- Table 28: Global Packaging artwork management Software Revenue undefined Forecast, by Application 2020 & 2033
- Table 29: Global Packaging artwork management Software Revenue undefined Forecast, by Types 2020 & 2033
- Table 30: Global Packaging artwork management Software Revenue undefined Forecast, by Country 2020 & 2033
- Table 31: Turkey Packaging artwork management Software Revenue (undefined) Forecast, by Application 2020 & 2033
- Table 32: Israel Packaging artwork management Software Revenue (undefined) Forecast, by Application 2020 & 2033
- Table 33: GCC Packaging artwork management Software Revenue (undefined) Forecast, by Application 2020 & 2033
- Table 34: North Africa Packaging artwork management Software Revenue (undefined) Forecast, by Application 2020 & 2033
- Table 35: South Africa Packaging artwork management Software Revenue (undefined) Forecast, by Application 2020 & 2033
- Table 36: Rest of Middle East & Africa Packaging artwork management Software Revenue (undefined) Forecast, by Application 2020 & 2033
- Table 37: Global Packaging artwork management Software Revenue undefined Forecast, by Application 2020 & 2033
- Table 38: Global Packaging artwork management Software Revenue undefined Forecast, by Types 2020 & 2033
- Table 39: Global Packaging artwork management Software Revenue undefined Forecast, by Country 2020 & 2033
- Table 40: China Packaging artwork management Software Revenue (undefined) Forecast, by Application 2020 & 2033
- Table 41: India Packaging artwork management Software Revenue (undefined) Forecast, by Application 2020 & 2033
- Table 42: Japan Packaging artwork management Software Revenue (undefined) Forecast, by Application 2020 & 2033
- Table 43: South Korea Packaging artwork management Software Revenue (undefined) Forecast, by Application 2020 & 2033
- Table 44: ASEAN Packaging artwork management Software Revenue (undefined) Forecast, by Application 2020 & 2033
- Table 45: Oceania Packaging artwork management Software Revenue (undefined) Forecast, by Application 2020 & 2033
- Table 46: Rest of Asia Pacific Packaging artwork management Software Revenue (undefined) Forecast, by Application 2020 & 2033
Frequently Asked Questions
1. What is the projected Compound Annual Growth Rate (CAGR) of the Packaging artwork management Software?
The projected CAGR is approximately 15.8%.
2. Which companies are prominent players in the Packaging artwork management Software?
Key companies in the market include Esko, Seagull Scientific, Loftware, Twona, Kallik, NiceLabel, Kalypso, enLabel Global Services, BLUE Software, ManageArtworks, Lascom CPG, Athreva, Karomi, Jupiter Prestige Group, GreatFour Systems, Managed Artwork, GLAMS.
3. What are the main segments of the Packaging artwork management Software?
The market segments include Application, Types.
4. Can you provide details about the market size?
The market size is estimated to be USD XXX N/A as of 2022.
5. What are some drivers contributing to market growth?
N/A
6. What are the notable trends driving market growth?
N/A
7. Are there any restraints impacting market growth?
N/A
8. Can you provide examples of recent developments in the market?
N/A
9. What pricing options are available for accessing the report?
Pricing options include single-user, multi-user, and enterprise licenses priced at USD 3350.00, USD 5025.00, and USD 6700.00 respectively.
10. Is the market size provided in terms of value or volume?
The market size is provided in terms of value, measured in N/A.
11. Are there any specific market keywords associated with the report?
Yes, the market keyword associated with the report is "Packaging artwork management Software," which aids in identifying and referencing the specific market segment covered.
12. How do I determine which pricing option suits my needs best?
The pricing options vary based on user requirements and access needs. Individual users may opt for single-user licenses, while businesses requiring broader access may choose multi-user or enterprise licenses for cost-effective access to the report.
13. Are there any additional resources or data provided in the Packaging artwork management Software report?
While the report offers comprehensive insights, it's advisable to review the specific contents or supplementary materials provided to ascertain if additional resources or data are available.
14. How can I stay updated on further developments or reports in the Packaging artwork management Software?
To stay informed about further developments, trends, and reports in the Packaging artwork management Software, consider subscribing to industry newsletters, following relevant companies and organizations, or regularly checking reputable industry news sources and publications.
Methodology
Step 1 - Identification of Relevant Samples Size from Population Database


Step 2 - Approaches for Defining Global Market Size (Value, Volume* & Price*)

Note*: In applicable scenarios
Step 3 - Data Sources
Primary Research
- Web Analytics
- Survey Reports
- Research Institute
- Latest Research Reports
- Opinion Leaders
Secondary Research
- Annual Reports
- White Paper
- Latest Press Release
- Industry Association
- Paid Database
- Investor Presentations

Step 4 - Data Triangulation
Involves using different sources of information in order to increase the validity of a study
These sources are likely to be stakeholders in a program - participants, other researchers, program staff, other community members, and so on.
Then we put all data in single framework & apply various statistical tools to find out the dynamic on the market.
During the analysis stage, feedback from the stakeholder groups would be compared to determine areas of agreement as well as areas of divergence