

Key Insights
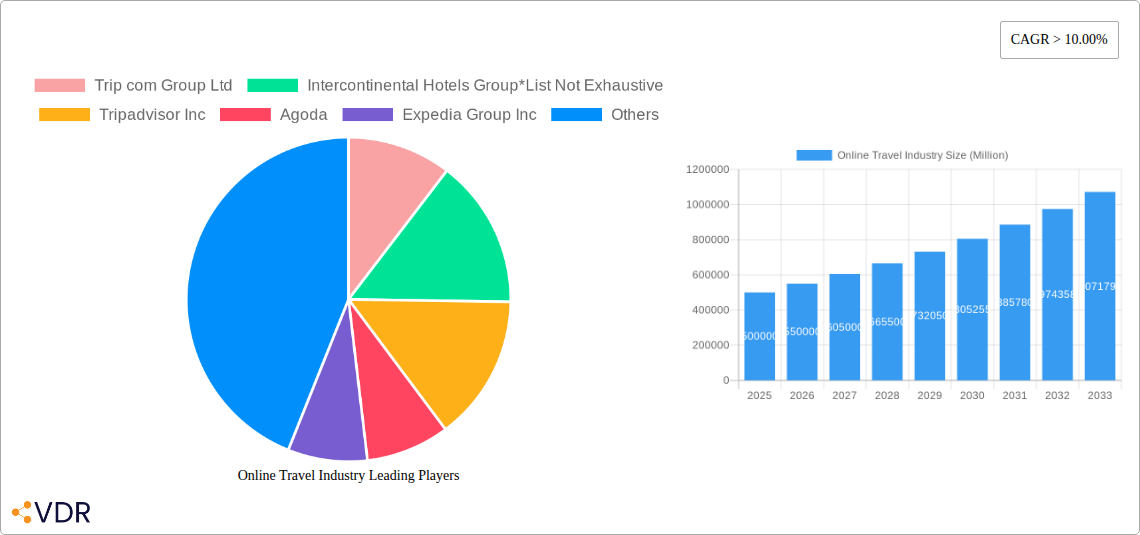
The global online travel market, projected to reach $622.6 billion by 2025, is poised for substantial expansion with a Compound Annual Growth Rate (CAGR) of 9.75%. This growth is propelled by increasing smartphone adoption for bookings, the convenience of online platforms, and the rise of budget travel with accessible airfare and accommodation. Expanding internet penetration, especially in emerging economies, creates significant opportunities. The industry is also shifting towards personalized travel, with a growing demand for curated itineraries and custom packages, addressed by established players and startups leveraging AI and data analytics. Intense competition from giants like Booking Holdings, Expedia, and Trip.com, alongside innovators such as Airbnb and Traveloka, fosters continuous innovation.
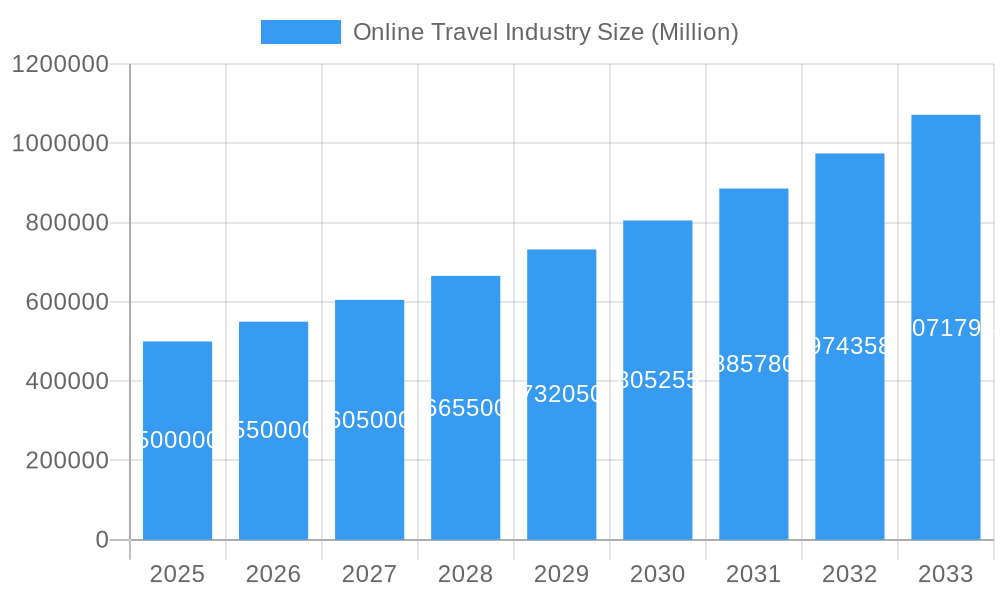
Online Travel Industry Market Size (In Billion)
Despite its robust growth, the online travel sector faces challenges including economic downturns, volatile fuel prices, geopolitical instability, and evolving data privacy regulations. Reliance on third-party platforms also introduces complexities in revenue management and customer service. Mobile booking applications are leading segment growth due to their convenience. Direct bookings via company portals are also increasing as firms prioritize customer loyalty and reduced commission dependency. The Asia-Pacific region, driven by China, India, and Southeast Asia, offers significant expansion potential due to a growing middle class with increased disposable income and a desire for travel. North America and Europe, though mature, remain key revenue contributors. The coming decade will witness industry consolidation, technological advancements, and a stronger emphasis on sustainable and responsible tourism.
Online Travel Industry Company Market Share
Online Travel Industry Market Report: 2019-2033
This comprehensive report provides an in-depth analysis of the online travel industry, encompassing market dynamics, growth trends, dominant segments, and key players. The study period covers 2019-2033, with 2025 as the base and estimated year, and a forecast period of 2025-2033. The historical period analyzed is 2019-2024. This report is invaluable for industry professionals, investors, and anyone seeking to understand this dynamic and rapidly evolving market. The market is segmented by Platform (Mobile Application, Website) and Mode of Booking (Third-party online portals, Direct/captive portals). Key players analyzed include Trip.com Group Ltd, Intercontinental Hotels Group, Tripadvisor Inc, Agoda, Expedia Group Inc, Traveloka Indonesia PT, HRS GmbH, Oravel Stays Pvt Ltd, Airbnb Inc, Hostelworld Group, Hotelbeds Group SL, and Booking Holdings Inc.
Online Travel Industry Market Dynamics & Structure
The online travel industry is characterized by a moderately concentrated market structure, with a few dominant players holding significant market share. Technological innovation, particularly in areas such as AI-powered personalization and immersive travel experiences, is a key driver of growth. Regulatory frameworks, varying across different jurisdictions, significantly influence market dynamics. Competitive product substitutes, such as peer-to-peer accommodation platforms, exert pressure on traditional players. The end-user demographic is diverse, ranging from budget-conscious travelers to luxury seekers. The industry experiences considerable M&A activity, further shaping its landscape.
- Market Concentration: The top 5 players hold approximately xx% of the global market share in 2025 (estimated).
- Technological Innovation: Investment in AI, VR/AR, and blockchain technologies are reshaping customer experience and operational efficiency.
- Regulatory Landscape: Data privacy regulations (GDPR, CCPA) and antitrust concerns impact market operations.
- M&A Activity: An estimated xx M&A deals occurred between 2019 and 2024, with a total value of xx Million. (Note: These figures are estimates in the absence of precise data)
- Innovation Barriers: High initial investment costs and the need for continuous technological upgrades pose significant barriers to entry for new players.
Online Travel Industry Growth Trends & Insights
The online travel market experienced robust growth during the historical period (2019-2024), albeit with fluctuations due to global events. The market size is projected to reach xx Million in 2025, growing at a CAGR of xx% from 2025 to 2033, driven by factors such as increasing internet penetration, smartphone adoption, and rising disposable incomes. The adoption rate of online travel booking platforms has significantly increased, particularly among younger demographics. Technological disruptions, including the rise of mobile booking and personalized travel recommendations, continue to redefine customer experience. Consumer behavior is shifting towards personalized itineraries, experiential travel, and sustainable tourism.
Dominant Regions, Countries, or Segments in Online Travel Industry
North America and Europe currently dominate the online travel market, accounting for a combined xx% of the global market share in 2025 (estimated). Within these regions, specific countries like the US, UK, and Germany demonstrate particularly strong growth. The mobile application segment holds the largest share of the market for platform type, exceeding website bookings significantly. Third-party online travel agencies (OTAs) continue to command significant market share within the booking mode segment, driven by their extensive network and comparative pricing. However, direct bookings through captive portals are increasing, suggesting a trend toward direct consumer relationships for travel businesses.
- Key Drivers for North America: High disposable incomes, advanced technology infrastructure, and a large outbound travel market.
- Key Drivers for Europe: Strong domestic tourism, increasing inbound tourism, and a well-developed digital infrastructure.
- Mobile Application Dominance: Convenience, accessibility, and personalized features drive its popularity among users.
- Third-Party OTA Strength: Wide selection, competitive pricing, and established brand recognition contribute to significant market share.
Online Travel Industry Product Landscape
The online travel industry offers a diverse range of products and services, from flight and hotel bookings to package tours and activity bookings. Key product innovations include AI-powered travel planning tools, personalized recommendations, virtual reality tours, and integrated travel management platforms. Performance metrics such as conversion rates, booking values, and customer satisfaction scores are crucial for evaluating product success. Unique selling propositions often center around user experience, pricing competitiveness, and exclusive offers.
Key Drivers, Barriers & Challenges in Online Travel Industry
Key Drivers:
- Rising disposable incomes and increasing leisure time
- Growing internet and mobile penetration
- Advancements in technology enhancing user experience
- Government initiatives promoting tourism
Key Challenges:
- Intense competition among established players and emerging startups.
- Fluctuations in fuel prices impacting airfare costs and overall travel expenses.
- Geopolitical instability and economic downturns affecting travel demand.
- Dependence on third-party suppliers leading to potential supply chain disruptions. (estimated impact: xx Million loss in revenue in 2024).
Emerging Opportunities in Online Travel Industry
- Sustainable and responsible travel: Growing consumer demand for eco-friendly options presents a significant opportunity.
- Hyper-personalization: Leveraging AI and data analytics to deliver highly tailored travel experiences.
- Experiential travel: Focus on unique and immersive travel experiences, rather than simply sightseeing.
- Expansion into underserved markets: Targeting emerging economies with growing middle classes.
Growth Accelerators in the Online Travel Industry
Technological advancements continue to be a major growth driver. Strategic partnerships between OTAs and hospitality providers expand reach and offer enhanced services. Market expansion into emerging markets with increasing travel demand further contributes to growth. Furthermore, the adoption of innovative marketing strategies and personalized customer service enhances engagement and loyalty.
Key Players Shaping the Online Travel Industry Market
Notable Milestones in Online Travel Industry Sector
- 2020 (March): Global travel restrictions due to COVID-19 pandemic significantly impacted the market.
- 2021 (Q3): Gradual recovery in travel demand as vaccination rates increased and restrictions eased.
- 2022 (Q4): Increased focus on sustainable tourism practices and personalized travel experiences.
- 2023 (Ongoing): Further technological advancements and adoption of innovative booking platforms and services. (Specific examples of product launches or mergers would be added here in a complete report)
In-Depth Online Travel Industry Market Outlook
The online travel industry is poised for continued growth driven by technological innovation, increasing consumer adoption, and expansion into new markets. Strategic partnerships and the development of innovative travel products and services will be crucial for success. The focus on sustainable tourism and personalized experiences will shape future market trends. Untapped markets in emerging economies represent a significant growth opportunity for companies to expand their reach and capture market share.
Online Travel Industry Segmentation
-
1. Platform
- 1.1. Mobile Application
- 1.2. Website
-
2. Mode of Booking
- 2.1. Third party online portals
- 2.2. Direct / captive portals
Online Travel Industry Segmentation By Geography
-
1. North America
- 1.1. United States
- 1.2. Canada
- 1.3. Mexico
-
2. South America
- 2.1. Brazil
- 2.2. Argentina
- 2.3. Rest of South America
-
3. Europe
- 3.1. United Kingdom
- 3.2. Germany
- 3.3. France
- 3.4. Italy
- 3.5. Spain
- 3.6. Russia
- 3.7. Benelux
- 3.8. Nordics
- 3.9. Rest of Europe
-
4. Middle East & Africa
- 4.1. Turkey
- 4.2. Israel
- 4.3. GCC
- 4.4. North Africa
- 4.5. South Africa
- 4.6. Rest of Middle East & Africa
-
5. Asia Pacific
- 5.1. China
- 5.2. India
- 5.3. Japan
- 5.4. South Korea
- 5.5. ASEAN
- 5.6. Oceania
- 5.7. Rest of Asia Pacific
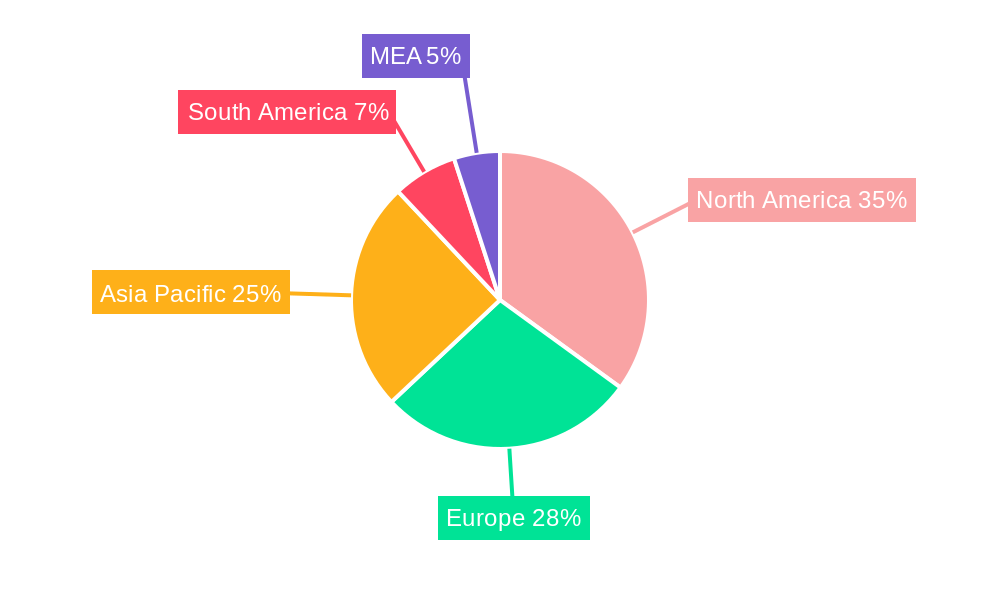
Online Travel Industry Regional Market Share
Geographic Coverage of Online Travel Industry
Online Travel Industry REPORT HIGHLIGHTS
| Aspects | Details |
|---|---|
| Study Period | 2020-2034 |
| Base Year | 2025 |
| Estimated Year | 2026 |
| Forecast Period | 2026-2034 |
| Historical Period | 2020-2025 |
| Growth Rate | CAGR of 9.75% from 2020-2034 |
| Segmentation |
|
Table of Contents
- 1. Introduction
- 1.1. Research Scope
- 1.2. Market Segmentation
- 1.3. Research Objective
- 1.4. Definitions and Assumptions
- 2. Executive Summary
- 2.1. Market Snapshot
- 3. Market Dynamics
- 3.1. Market Drivers
- 3.2. Market Restrains
- 3.3. Market Trends
- 3.4. Market Opportunities
- 4. Market Factor Analysis
- 4.1. Porters Five Forces
- 4.1.1. Bargaining Power of Suppliers
- 4.1.2. Bargaining Power of Buyers
- 4.1.3. Threat of New Entrants
- 4.1.4. Threat of Substitutes
- 4.1.5. Competitive Rivalry
- 4.2. PESTEL analysis
- 4.3. BCG Analysis
- 4.3.1. Stars (High Growth, High Market Share)
- 4.3.2. Cash Cows (Low Growth, High Market Share)
- 4.3.3. Question Mark (High Growth, Low Market Share)
- 4.3.4. Dogs (Low Growth, Low Market Share)
- 4.4. Ansoff Matrix Analysis
- 4.5. Supply Chain Analysis
- 4.6. Regulatory Landscape
- 4.7. Current Market Potential and Opportunity Assessment (TAM–SAM–SOM Framework)
- 4.8. VDR Analyst Note
- 4.1. Porters Five Forces
- 5. Market Analysis, Insights and Forecast 2021-2033
- 5.1. Market Analysis, Insights and Forecast - by Platform
- 5.1.1. Mobile Application
- 5.1.2. Website
- 5.2. Market Analysis, Insights and Forecast - by Mode of Booking
- 5.2.1. Third party online portals
- 5.2.2. Direct / captive portals
- 5.3. Market Analysis, Insights and Forecast - by Region
- 5.3.1. North America
- 5.3.2. South America
- 5.3.3. Europe
- 5.3.4. Middle East & Africa
- 5.3.5. Asia Pacific
- 5.1. Market Analysis, Insights and Forecast - by Platform
- 6. Global Online Travel Industry Analysis, Insights and Forecast, 2021-2033
- 6.1. Market Analysis, Insights and Forecast - by Platform
- 6.1.1. Mobile Application
- 6.1.2. Website
- 6.2. Market Analysis, Insights and Forecast - by Mode of Booking
- 6.2.1. Third party online portals
- 6.2.2. Direct / captive portals
- 6.1. Market Analysis, Insights and Forecast - by Platform
- 7. North America Online Travel Industry Analysis, Insights and Forecast, 2021-2033
- 7.1. Market Analysis, Insights and Forecast - by Platform
- 7.1.1. Mobile Application
- 7.1.2. Website
- 7.2. Market Analysis, Insights and Forecast - by Mode of Booking
- 7.2.1. Third party online portals
- 7.2.2. Direct / captive portals
- 7.1. Market Analysis, Insights and Forecast - by Platform
- 8. South America Online Travel Industry Analysis, Insights and Forecast, 2021-2033
- 8.1. Market Analysis, Insights and Forecast - by Platform
- 8.1.1. Mobile Application
- 8.1.2. Website
- 8.2. Market Analysis, Insights and Forecast - by Mode of Booking
- 8.2.1. Third party online portals
- 8.2.2. Direct / captive portals
- 8.1. Market Analysis, Insights and Forecast - by Platform
- 9. Europe Online Travel Industry Analysis, Insights and Forecast, 2021-2033
- 9.1. Market Analysis, Insights and Forecast - by Platform
- 9.1.1. Mobile Application
- 9.1.2. Website
- 9.2. Market Analysis, Insights and Forecast - by Mode of Booking
- 9.2.1. Third party online portals
- 9.2.2. Direct / captive portals
- 9.1. Market Analysis, Insights and Forecast - by Platform
- 10. Middle East & Africa Online Travel Industry Analysis, Insights and Forecast, 2021-2033
- 10.1. Market Analysis, Insights and Forecast - by Platform
- 10.1.1. Mobile Application
- 10.1.2. Website
- 10.2. Market Analysis, Insights and Forecast - by Mode of Booking
- 10.2.1. Third party online portals
- 10.2.2. Direct / captive portals
- 10.1. Market Analysis, Insights and Forecast - by Platform
- 11. Asia Pacific Online Travel Industry Analysis, Insights and Forecast, 2021-2033
- 11.1. Market Analysis, Insights and Forecast - by Platform
- 11.1.1. Mobile Application
- 11.1.2. Website
- 11.2. Market Analysis, Insights and Forecast - by Mode of Booking
- 11.2.1. Third party online portals
- 11.2.2. Direct / captive portals
- 11.1. Market Analysis, Insights and Forecast - by Platform
- 12. Competitive Analysis
- 12.1. Company Profiles
- 12.1.1 Trip com Group Ltd
- 12.1.1.1. Company Overview
- 12.1.1.2. Products
- 12.1.1.3. Company Financials
- 12.1.1.4. SWOT Analysis
- 12.1.2 Intercontinental Hotels Group*List Not Exhaustive
- 12.1.2.1. Company Overview
- 12.1.2.2. Products
- 12.1.2.3. Company Financials
- 12.1.2.4. SWOT Analysis
- 12.1.3 Tripadvisor Inc
- 12.1.3.1. Company Overview
- 12.1.3.2. Products
- 12.1.3.3. Company Financials
- 12.1.3.4. SWOT Analysis
- 12.1.4 Agoda
- 12.1.4.1. Company Overview
- 12.1.4.2. Products
- 12.1.4.3. Company Financials
- 12.1.4.4. SWOT Analysis
- 12.1.5 Expedia Group Inc
- 12.1.5.1. Company Overview
- 12.1.5.2. Products
- 12.1.5.3. Company Financials
- 12.1.5.4. SWOT Analysis
- 12.1.6 Traveloka Indonesia PT
- 12.1.6.1. Company Overview
- 12.1.6.2. Products
- 12.1.6.3. Company Financials
- 12.1.6.4. SWOT Analysis
- 12.1.7 HRS GmbH
- 12.1.7.1. Company Overview
- 12.1.7.2. Products
- 12.1.7.3. Company Financials
- 12.1.7.4. SWOT Analysis
- 12.1.8 Oravel Stays Pvt Ltd
- 12.1.8.1. Company Overview
- 12.1.8.2. Products
- 12.1.8.3. Company Financials
- 12.1.8.4. SWOT Analysis
- 12.1.9 Airbnb Inc
- 12.1.9.1. Company Overview
- 12.1.9.2. Products
- 12.1.9.3. Company Financials
- 12.1.9.4. SWOT Analysis
- 12.1.10 Hostelworld Group
- 12.1.10.1. Company Overview
- 12.1.10.2. Products
- 12.1.10.3. Company Financials
- 12.1.10.4. SWOT Analysis
- 12.1.11 Hotelbeds Group SL
- 12.1.11.1. Company Overview
- 12.1.11.2. Products
- 12.1.11.3. Company Financials
- 12.1.11.4. SWOT Analysis
- 12.1.12 Booking Holdings Inc
- 12.1.12.1. Company Overview
- 12.1.12.2. Products
- 12.1.12.3. Company Financials
- 12.1.12.4. SWOT Analysis
- 12.1.1 Trip com Group Ltd
- 12.2. Market Entropy
- 12.2.1 Company's Key Areas Served
- 12.2.2 Recent Developments
- 12.3. Company Market Share Analysis 2025
- 12.3.1 Top 5 Companies Market Share Analysis
- 12.3.2 Top 3 Companies Market Share Analysis
- 12.4. List of Potential Customers
- 13. Research Methodology
List of Figures
- Figure 1: Global Online Travel Industry Revenue Breakdown (billion, %) by Region 2025 & 2033
- Figure 2: North America Online Travel Industry Revenue (billion), by Platform 2025 & 2033
- Figure 3: North America Online Travel Industry Revenue Share (%), by Platform 2025 & 2033
- Figure 4: North America Online Travel Industry Revenue (billion), by Mode of Booking 2025 & 2033
- Figure 5: North America Online Travel Industry Revenue Share (%), by Mode of Booking 2025 & 2033
- Figure 6: North America Online Travel Industry Revenue (billion), by Country 2025 & 2033
- Figure 7: North America Online Travel Industry Revenue Share (%), by Country 2025 & 2033
- Figure 8: South America Online Travel Industry Revenue (billion), by Platform 2025 & 2033
- Figure 9: South America Online Travel Industry Revenue Share (%), by Platform 2025 & 2033
- Figure 10: South America Online Travel Industry Revenue (billion), by Mode of Booking 2025 & 2033
- Figure 11: South America Online Travel Industry Revenue Share (%), by Mode of Booking 2025 & 2033
- Figure 12: South America Online Travel Industry Revenue (billion), by Country 2025 & 2033
- Figure 13: South America Online Travel Industry Revenue Share (%), by Country 2025 & 2033
- Figure 14: Europe Online Travel Industry Revenue (billion), by Platform 2025 & 2033
- Figure 15: Europe Online Travel Industry Revenue Share (%), by Platform 2025 & 2033
- Figure 16: Europe Online Travel Industry Revenue (billion), by Mode of Booking 2025 & 2033
- Figure 17: Europe Online Travel Industry Revenue Share (%), by Mode of Booking 2025 & 2033
- Figure 18: Europe Online Travel Industry Revenue (billion), by Country 2025 & 2033
- Figure 19: Europe Online Travel Industry Revenue Share (%), by Country 2025 & 2033
- Figure 20: Middle East & Africa Online Travel Industry Revenue (billion), by Platform 2025 & 2033
- Figure 21: Middle East & Africa Online Travel Industry Revenue Share (%), by Platform 2025 & 2033
- Figure 22: Middle East & Africa Online Travel Industry Revenue (billion), by Mode of Booking 2025 & 2033
- Figure 23: Middle East & Africa Online Travel Industry Revenue Share (%), by Mode of Booking 2025 & 2033
- Figure 24: Middle East & Africa Online Travel Industry Revenue (billion), by Country 2025 & 2033
- Figure 25: Middle East & Africa Online Travel Industry Revenue Share (%), by Country 2025 & 2033
- Figure 26: Asia Pacific Online Travel Industry Revenue (billion), by Platform 2025 & 2033
- Figure 27: Asia Pacific Online Travel Industry Revenue Share (%), by Platform 2025 & 2033
- Figure 28: Asia Pacific Online Travel Industry Revenue (billion), by Mode of Booking 2025 & 2033
- Figure 29: Asia Pacific Online Travel Industry Revenue Share (%), by Mode of Booking 2025 & 2033
- Figure 30: Asia Pacific Online Travel Industry Revenue (billion), by Country 2025 & 2033
- Figure 31: Asia Pacific Online Travel Industry Revenue Share (%), by Country 2025 & 2033
List of Tables
- Table 1: Global Online Travel Industry Revenue billion Forecast, by Platform 2020 & 2033
- Table 2: Global Online Travel Industry Revenue billion Forecast, by Mode of Booking 2020 & 2033
- Table 3: Global Online Travel Industry Revenue billion Forecast, by Region 2020 & 2033
- Table 4: Global Online Travel Industry Revenue billion Forecast, by Platform 2020 & 2033
- Table 5: Global Online Travel Industry Revenue billion Forecast, by Mode of Booking 2020 & 2033
- Table 6: Global Online Travel Industry Revenue billion Forecast, by Country 2020 & 2033
- Table 7: United States Online Travel Industry Revenue (billion) Forecast, by Application 2020 & 2033
- Table 8: Canada Online Travel Industry Revenue (billion) Forecast, by Application 2020 & 2033
- Table 9: Mexico Online Travel Industry Revenue (billion) Forecast, by Application 2020 & 2033
- Table 10: Global Online Travel Industry Revenue billion Forecast, by Platform 2020 & 2033
- Table 11: Global Online Travel Industry Revenue billion Forecast, by Mode of Booking 2020 & 2033
- Table 12: Global Online Travel Industry Revenue billion Forecast, by Country 2020 & 2033
- Table 13: Brazil Online Travel Industry Revenue (billion) Forecast, by Application 2020 & 2033
- Table 14: Argentina Online Travel Industry Revenue (billion) Forecast, by Application 2020 & 2033
- Table 15: Rest of South America Online Travel Industry Revenue (billion) Forecast, by Application 2020 & 2033
- Table 16: Global Online Travel Industry Revenue billion Forecast, by Platform 2020 & 2033
- Table 17: Global Online Travel Industry Revenue billion Forecast, by Mode of Booking 2020 & 2033
- Table 18: Global Online Travel Industry Revenue billion Forecast, by Country 2020 & 2033
- Table 19: United Kingdom Online Travel Industry Revenue (billion) Forecast, by Application 2020 & 2033
- Table 20: Germany Online Travel Industry Revenue (billion) Forecast, by Application 2020 & 2033
- Table 21: France Online Travel Industry Revenue (billion) Forecast, by Application 2020 & 2033
- Table 22: Italy Online Travel Industry Revenue (billion) Forecast, by Application 2020 & 2033
- Table 23: Spain Online Travel Industry Revenue (billion) Forecast, by Application 2020 & 2033
- Table 24: Russia Online Travel Industry Revenue (billion) Forecast, by Application 2020 & 2033
- Table 25: Benelux Online Travel Industry Revenue (billion) Forecast, by Application 2020 & 2033
- Table 26: Nordics Online Travel Industry Revenue (billion) Forecast, by Application 2020 & 2033
- Table 27: Rest of Europe Online Travel Industry Revenue (billion) Forecast, by Application 2020 & 2033
- Table 28: Global Online Travel Industry Revenue billion Forecast, by Platform 2020 & 2033
- Table 29: Global Online Travel Industry Revenue billion Forecast, by Mode of Booking 2020 & 2033
- Table 30: Global Online Travel Industry Revenue billion Forecast, by Country 2020 & 2033
- Table 31: Turkey Online Travel Industry Revenue (billion) Forecast, by Application 2020 & 2033
- Table 32: Israel Online Travel Industry Revenue (billion) Forecast, by Application 2020 & 2033
- Table 33: GCC Online Travel Industry Revenue (billion) Forecast, by Application 2020 & 2033
- Table 34: North Africa Online Travel Industry Revenue (billion) Forecast, by Application 2020 & 2033
- Table 35: South Africa Online Travel Industry Revenue (billion) Forecast, by Application 2020 & 2033
- Table 36: Rest of Middle East & Africa Online Travel Industry Revenue (billion) Forecast, by Application 2020 & 2033
- Table 37: Global Online Travel Industry Revenue billion Forecast, by Platform 2020 & 2033
- Table 38: Global Online Travel Industry Revenue billion Forecast, by Mode of Booking 2020 & 2033
- Table 39: Global Online Travel Industry Revenue billion Forecast, by Country 2020 & 2033
- Table 40: China Online Travel Industry Revenue (billion) Forecast, by Application 2020 & 2033
- Table 41: India Online Travel Industry Revenue (billion) Forecast, by Application 2020 & 2033
- Table 42: Japan Online Travel Industry Revenue (billion) Forecast, by Application 2020 & 2033
- Table 43: South Korea Online Travel Industry Revenue (billion) Forecast, by Application 2020 & 2033
- Table 44: ASEAN Online Travel Industry Revenue (billion) Forecast, by Application 2020 & 2033
- Table 45: Oceania Online Travel Industry Revenue (billion) Forecast, by Application 2020 & 2033
- Table 46: Rest of Asia Pacific Online Travel Industry Revenue (billion) Forecast, by Application 2020 & 2033
Frequently Asked Questions
1. What is the projected Compound Annual Growth Rate (CAGR) of the Online Travel Industry?
The projected CAGR is approximately 9.75%.
2. Which companies are prominent players in the Online Travel Industry?
Key companies in the market include Trip com Group Ltd, Intercontinental Hotels Group*List Not Exhaustive, Tripadvisor Inc, Agoda, Expedia Group Inc, Traveloka Indonesia PT, HRS GmbH, Oravel Stays Pvt Ltd, Airbnb Inc, Hostelworld Group, Hotelbeds Group SL, Booking Holdings Inc.
3. What are the main segments of the Online Travel Industry?
The market segments include Platform, Mode of Booking.
4. Can you provide details about the market size?
The market size is estimated to be USD 622.6 billion as of 2022.
5. What are some drivers contributing to market growth?
Increase in Domestic Travel Driving the Market; Growing Tourist Footfall Driving the Market.
6. What are the notable trends driving market growth?
Increasing Internet Penetration has Huge Impact on the Market.
7. Are there any restraints impacting market growth?
Restrictions on Purchases of Number of Products; Customs Regulations and Taxation Policies.
8. Can you provide examples of recent developments in the market?
N/A
9. What pricing options are available for accessing the report?
Pricing options include single-user, multi-user, and enterprise licenses priced at USD 3800, USD 4500, and USD 5800 respectively.
10. Is the market size provided in terms of value or volume?
The market size is provided in terms of value, measured in billion.
11. Are there any specific market keywords associated with the report?
Yes, the market keyword associated with the report is "Online Travel Industry," which aids in identifying and referencing the specific market segment covered.
12. How do I determine which pricing option suits my needs best?
The pricing options vary based on user requirements and access needs. Individual users may opt for single-user licenses, while businesses requiring broader access may choose multi-user or enterprise licenses for cost-effective access to the report.
13. Are there any additional resources or data provided in the Online Travel Industry report?
While the report offers comprehensive insights, it's advisable to review the specific contents or supplementary materials provided to ascertain if additional resources or data are available.
14. How can I stay updated on further developments or reports in the Online Travel Industry?
To stay informed about further developments, trends, and reports in the Online Travel Industry, consider subscribing to industry newsletters, following relevant companies and organizations, or regularly checking reputable industry news sources and publications.
Methodology
Step 1 - Identification of Relevant Samples Size from Population Database


Step 2 - Approaches for Defining Global Market Size (Value, Volume* & Price*)

Note*: In applicable scenarios
Step 3 - Data Sources
Primary Research
- Web Analytics
- Survey Reports
- Research Institute
- Latest Research Reports
- Opinion Leaders
Secondary Research
- Annual Reports
- White Paper
- Latest Press Release
- Industry Association
- Paid Database
- Investor Presentations

Step 4 - Data Triangulation
Involves using different sources of information in order to increase the validity of a study
These sources are likely to be stakeholders in a program - participants, other researchers, program staff, other community members, and so on.
Then we put all data in single framework & apply various statistical tools to find out the dynamic on the market.
During the analysis stage, feedback from the stakeholder groups would be compared to determine areas of agreement as well as areas of divergence