

Key Insights
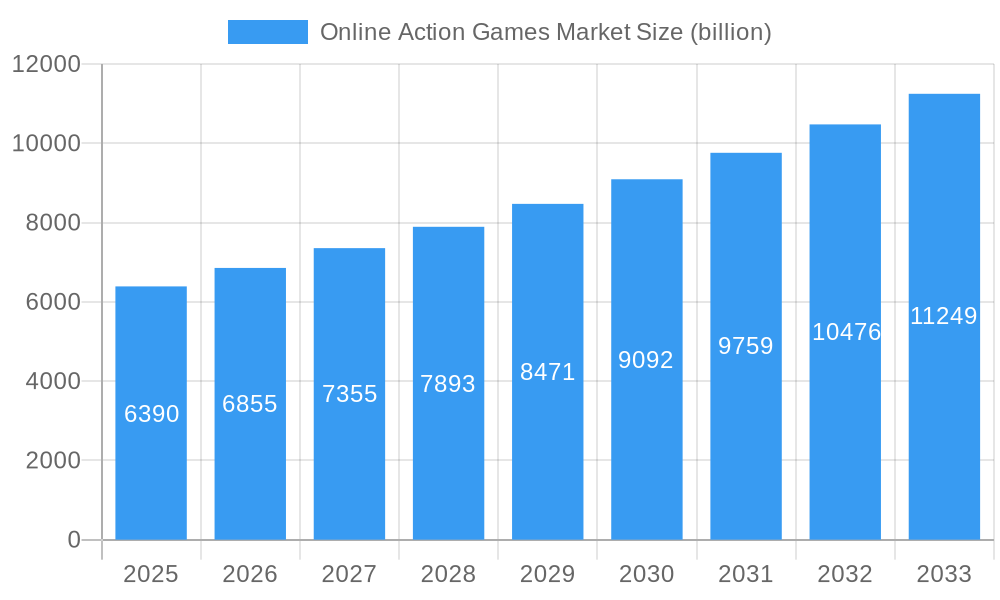
The global Online Action Games Market is poised for substantial expansion, projected to reach USD 6.39 billion in 2025 and is anticipated to grow at a robust Compound Annual Growth Rate (CAGR) of 7.2% through 2033. This remarkable growth trajectory is fueled by an escalating global demand for immersive and interactive entertainment experiences, driven by the increasing accessibility of high-speed internet and the proliferation of powerful gaming devices. The market's dynamism is further stimulated by continuous innovation in game development, with studios like Tencent, EA DICE, and Ubisoft consistently delivering cutting-edge titles that captivate a diverse player base. The widespread adoption of free-to-play models, alongside premium paid services, has democratized access to high-quality action gaming, attracting a broader demographic and fostering a vibrant online gaming community. Furthermore, advancements in cloud gaming and virtual reality technologies are opening up new avenues for engagement and pushing the boundaries of what's possible in online action gaming.
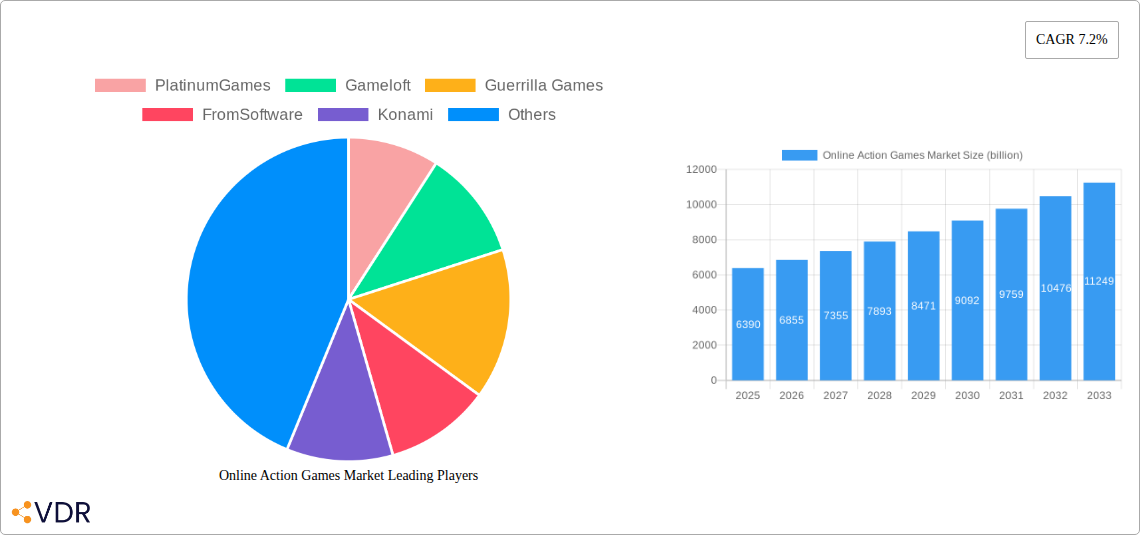
Online Action Games Market Market Size (In Billion)
Key market drivers include the increasing disposable income across emerging economies, the growing popularity of esports and competitive gaming, and the strong influence of social media in promoting new game releases and trending titles. The market is segmented by revenue models into Free Gaming Services and Paid Gaming Services, with both segments demonstrating significant growth potential. Platform-wise, PCs, consoles, and mobile phones are the dominant segments, with mobile gaming, in particular, experiencing exponential growth due to the ubiquity of smartphones. Operating systems like iOS and Android are crucial for the mobile gaming ecosystem, while Windows continues to be a strong contender for PC gaming. Leading companies such as Sony Interactive Entertainment, Nintendo EPD, and PlayStation are investing heavily in developing exclusive action game titles, further solidifying market leadership. Geographically, North America and Asia Pacific are expected to be significant revenue-generating regions, with Asia Pacific projected for the fastest growth due to a burgeoning gamer population and increasing internet penetration in countries like China and India.
Online Action Games Market Company Market Share
This comprehensive report offers an in-depth analysis of the global Online Action Games Market, meticulously examining its dynamics, growth trends, key players, and future trajectory. Covering the period from 2019 to 2033, with a base and estimated year of 2025, this study provides critical insights for stakeholders navigating this rapidly evolving industry. The report delves into parent and child market segments, offering a granular view of revenue models, platform proliferation, and operating system dominance.
Online Action Games Market Market Dynamics & Structure
The Online Action Games Market is characterized by a dynamic and evolving landscape, driven by relentless technological innovation and shifting consumer preferences. Market concentration varies across different segments, with some areas exhibiting dominance by a few large players while others remain fragmented. Technological innovation remains a paramount driver, with advancements in graphics rendering, artificial intelligence, cloud gaming, and virtual/augmented reality continuously pushing the boundaries of immersive gameplay. Regulatory frameworks, while not as stringent as in some other tech sectors, are increasingly focusing on data privacy, in-game purchases, and age restrictions, influencing game development and distribution strategies.
Competitive product substitutes, while not directly replacing online action games, include other forms of digital entertainment such as streaming services and social media. The proliferation of mobile devices has significantly expanded the end-user demographics, bringing in a younger and more diverse audience alongside traditional PC and console gamers. Mergers and acquisition (M&A) trends are a notable feature, with major publishers acquiring smaller studios to gain access to talent, intellectual property, and new market segments. For instance, the past few years have witnessed numerous strategic acquisitions aimed at bolstering portfolios in the mobile and free-to-play gaming spaces. The market share of major companies is constantly being reshaped by these activities, with a particular focus on expanding reach within emerging economies and capturing younger demographics through accessible entry points like free-to-play titles. Innovation barriers include the high cost of game development, the constant need for updates and content, and the challenge of maintaining player engagement in a crowded market.
Online Action Games Market Growth Trends & Insights
The Online Action Games Market has witnessed an exponential growth trajectory, fueled by increasing internet penetration, the widespread adoption of smartphones, and the continuous evolution of gaming technology. The market size has consistently expanded, driven by robust adoption rates of both free-to-play and premium action titles. Technological disruptions, such as the advent of cloud gaming platforms and the refinement of augmented and virtual reality experiences, are playing a pivotal role in shaping player engagement and accessibility. These innovations are not only enhancing the visual fidelity and interactive depth of action games but also democratizing access to high-end gaming experiences, irrespective of individual hardware capabilities.
Consumer behavior shifts have been equally significant. There's a discernible move towards more social and collaborative gaming experiences, with online multiplayer modes and esports gaining substantial traction. The rise of live-service games, which offer continuous content updates and community engagement, has fostered long-term player loyalty and recurring revenue streams. The integration of advanced AI in games, creating more intelligent and challenging opponents and more dynamic game worlds, further enhances the player experience. The market penetration of online action games continues to climb, particularly in developing regions where mobile gaming serves as the primary gateway to digital entertainment. The CAGR for the Online Action Games Market is projected to remain strong, indicating sustained investor interest and continued innovation. The increasing accessibility of powerful mobile devices and the development of more sophisticated mobile game engines are further broadening the addressable market. The demand for high-fidelity graphics and immersive gameplay is pushing developers to leverage cutting-edge technologies, contributing to a cycle of continuous improvement and market expansion. The increasing social aspect of gaming, where players connect and compete with friends and strangers alike, is a key driver of sustained engagement and market growth.
Dominant Regions, Countries, or Segments in Online Action Games Market
The Mobile Phones segment, particularly within the Free Gaming Services revenue model, is currently the most dominant force driving growth in the global Online Action Games Market. This dominance is underpinned by several key factors. The unparalleled accessibility of mobile devices worldwide, coupled with their decreasing cost, has created a vast and rapidly expanding player base, especially in emerging economies across Asia-Pacific, Latin America, and Africa. Free-to-play models, often supported by in-app purchases and advertising, effectively remove the initial financial barrier to entry, making these games accessible to a broader demographic than traditional console or PC titles.
- Asia-Pacific stands out as the leading region, propelled by its massive population, high smartphone adoption rates, and a deeply ingrained gaming culture. Countries like China, South Korea, and India are colossal markets for mobile gaming, with a strong preference for action-packed titles.
- North America and Europe remain significant markets, with a strong presence of console and PC gamers, as well as a rapidly growing mobile gaming segment. Here, a mix of free-to-play and paid gaming services thrives, with a higher propensity for spending on premium content and subscriptions.
- Revenue Model Dominance: Free Gaming Services, particularly on mobile platforms, represent the largest revenue stream due to the sheer volume of players. However, Paid Gaming Services, encompassing premium titles and subscriptions on PC and consoles, contribute significantly to overall revenue due to higher per-user spending.
- Platform Dominance: Mobile Phones have surpassed PCs and Consoles in terms of sheer user numbers and engagement hours, making it the primary platform for market growth. However, Consoles continue to command a premium for AAA titles, contributing substantially to revenue.
- Operating System Dominance: iOS and Android collectively dominate the mobile operating system landscape, serving as the primary conduits for mobile action games. Windows remains crucial for the PC gaming segment.
- Economic Policies and Infrastructure: Favorable internet infrastructure development and increasing disposable incomes in emerging markets are critical economic enablers. Government initiatives promoting digital economies and reducing import duties on electronic devices also contribute to market expansion. The competitive landscape within the mobile free-to-play space is fierce, driving innovation in monetization strategies and player retention.
Online Action Games Market Product Landscape
The Online Action Games Market product landscape is characterized by an impressive array of innovative titles that continually push the boundaries of interactive entertainment. Developers are focusing on delivering hyper-realistic graphics, sophisticated physics engines, and intricate gameplay mechanics that offer players unparalleled immersion and engagement. Titles like the upcoming Tom Clancy's The Division® Resurgence exemplify this trend, offering a rich, narrative-driven RPG experience on mobile platforms, a testament to the expanding capabilities of mobile gaming. Unique selling propositions often lie in the blend of intense combat, strategic decision-making, and compelling storylines. Technological advancements are evident in the seamless integration of online multiplayer, real-time cooperative play, and competitive esports-ready features, ensuring replayability and community building. The performance metrics of these games are increasingly judged not just by their visual fidelity but also by their server stability, low latency, and accessibility across various devices.
Key Drivers, Barriers & Challenges in Online Action Games Market
Key Drivers:
- Technological Advancements: Continuous innovation in graphics, AI, cloud gaming, and mobile hardware fuels more immersive and accessible experiences.
- Growing Internet Penetration: Increased global access to high-speed internet enables wider adoption of online gaming.
- Rise of Mobile Gaming: The ubiquity of smartphones has democratized access to action games for billions worldwide.
- Esports Popularity: The burgeoning esports scene drives engagement and spectator interest, creating a positive feedback loop for competitive online action games.
- Free-to-Play Models: Lowering the barrier to entry attracts a massive player base, with monetization through in-app purchases and subscriptions.
Barriers & Challenges:
- High Development Costs: Producing AAA action games requires substantial investment, increasing financial risk for developers and publishers.
- Intense Competition: The market is highly saturated, making it challenging for new titles to gain traction and retain player attention.
- Player Retention: Keeping players engaged long-term requires continuous content updates, community management, and evolving gameplay.
- Monetization Challenges: Balancing player experience with effective monetization strategies is crucial and can be a delicate act.
- Regulatory Scrutiny: Increasing concerns over loot boxes, data privacy, and addictive gameplay may lead to stricter regulations. Supply chain issues related to hardware availability can also indirectly impact the market.
Emerging Opportunities in Online Action Games Market
Emerging opportunities in the Online Action Games Market lie in the continued expansion of cloud gaming services, making high-fidelity action games accessible on a wider range of devices without requiring powerful local hardware. The integration of augmented reality (AR) and virtual reality (VR) technologies, while still nascent, presents a significant avenue for creating deeply immersive and unique action game experiences that can captivate a new generation of players. Untapped markets in developing regions, particularly in Africa and Southeast Asia, offer substantial growth potential as internet infrastructure improves and disposable incomes rise. Furthermore, the increasing demand for cross-platform play and interoperability between different gaming ecosystems presents an opportunity for developers to broaden their audience and foster more interconnected gaming communities.
Growth Accelerators in the Online Action Games Market Industry
Several key catalysts are accelerating the growth of the Online Action Games Market. Technological breakthroughs in areas like 5G connectivity are paving the way for seamless, low-latency online gaming experiences, especially on mobile devices. Strategic partnerships between game developers and hardware manufacturers, as well as content creators and streaming platforms, are crucial for expanding reach and building brand awareness. Market expansion strategies, including localized content development and tailored marketing campaigns for diverse regional audiences, are vital for capturing market share in emerging economies. The continued evolution of esports as a global phenomenon, attracting significant viewership and sponsorship, further incentivizes investment in competitive online action games.
Key Players Shaping the Online Action Games Market Market
- PlatinumGames
- Gameloft
- Guerrilla Games
- FromSoftware
- Konami
- SIE Santa Monica Studio
- Nintendo EPD
- Rocksteady Studios
- Tencent
- Rockstar North
- Sony Interactive Entertainment
- EA DICE
- Bethesda Game Studios
- Capcom
- Ubisoft
- id Software
Notable Milestones in Online Action Games Market Sector
- July 2022: Ubisoft unveiled Tom Clancy's The Division® Resurgence, a new free-to-play third-person shooter RPG mobile game. This launch signifies a significant push for major publishers into the lucrative mobile action RPG space, emphasizing fresh narratives and challenging gameplay accessible on iOS and Android devices.
In-Depth Online Action Games Market Market Outlook
The future outlook for the Online Action Games Market is exceptionally robust, driven by sustained growth accelerators and emerging opportunities. The continued evolution of cloud gaming and the increasing integration of AR/VR technologies promise to redefine immersive gameplay and broaden accessibility. Untapped markets in developing regions represent significant untapped potential, while the ongoing demand for cross-platform play will foster more interconnected gaming communities. Strategic partnerships, localized content, and the continued rise of esports will further propel market expansion. The focus on live-service games and community engagement will ensure long-term player retention, solidifying the market's position as a dominant force in the global entertainment landscape.
Online Action Games Market Segmentation
-
1. Revenue Model
- 1.1. Free Gaming Services
- 1.2. Paid Gaming Services
-
2. Platform
- 2.1. PCs
- 2.2. Consoles
- 2.3. Mobile Phones
-
3. Operating System
- 3.1. iOS
- 3.2. Android
- 3.3. Windows
- 3.4. Other Operating Systems
Online Action Games Market Segmentation By Geography
-
1. North America
- 1.1. United States
- 1.2. Canada
- 1.3. Mexico
- 1.4. Rest of North America
-
2. Europe
- 2.1. Germany
- 2.2. United Kingdom
- 2.3. France
- 2.4. Russia
- 2.5. Spain
- 2.6. Rest of Europe
-
3. Asia Pacific
- 3.1. India
- 3.2. China
- 3.3. Japan
- 3.4. Rest of Asia Pacific
-
4. South America
- 4.1. Brazil
- 4.2. Argentina
-
5. Middle East
- 5.1. United Arab Emirates
- 5.2. Saudi Arabia
- 5.3. Rest of the Middle East
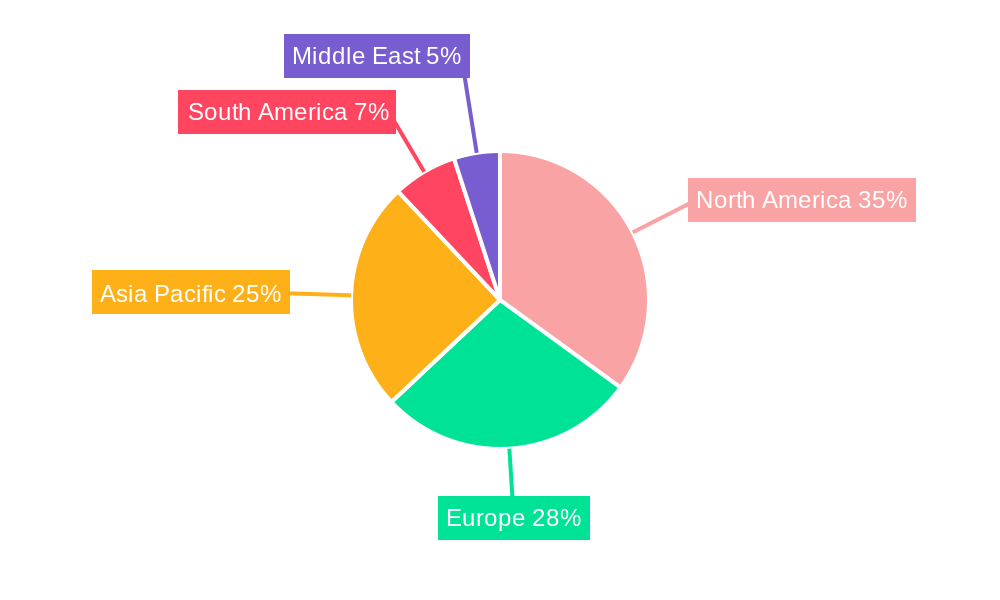
Online Action Games Market Regional Market Share
Geographic Coverage of Online Action Games Market
Online Action Games Market REPORT HIGHLIGHTS
| Aspects | Details |
|---|---|
| Study Period | 2020-2034 |
| Base Year | 2025 |
| Estimated Year | 2026 |
| Forecast Period | 2026-2034 |
| Historical Period | 2020-2025 |
| Growth Rate | CAGR of 7.2% from 2020-2034 |
| Segmentation |
|
Table of Contents
- 1. Introduction
- 1.1. Research Scope
- 1.2. Market Segmentation
- 1.3. Research Objective
- 1.4. Definitions and Assumptions
- 2. Executive Summary
- 2.1. Market Snapshot
- 3. Market Dynamics
- 3.1. Market Drivers
- 3.2. Market Restrains
- 3.3. Market Trends
- 3.4. Market Opportunities
- 4. Market Factor Analysis
- 4.1. Porters Five Forces
- 4.1.1. Bargaining Power of Suppliers
- 4.1.2. Bargaining Power of Buyers
- 4.1.3. Threat of New Entrants
- 4.1.4. Threat of Substitutes
- 4.1.5. Competitive Rivalry
- 4.2. PESTEL analysis
- 4.3. BCG Analysis
- 4.3.1. Stars (High Growth, High Market Share)
- 4.3.2. Cash Cows (Low Growth, High Market Share)
- 4.3.3. Question Mark (High Growth, Low Market Share)
- 4.3.4. Dogs (Low Growth, Low Market Share)
- 4.4. Ansoff Matrix Analysis
- 4.5. Supply Chain Analysis
- 4.6. Regulatory Landscape
- 4.7. Current Market Potential and Opportunity Assessment (TAM–SAM–SOM Framework)
- 4.8. VDR Analyst Note
- 4.1. Porters Five Forces
- 5. Market Analysis, Insights and Forecast 2021-2033
- 5.1. Market Analysis, Insights and Forecast - by Revenue Model
- 5.1.1. Free Gaming Services
- 5.1.2. Paid Gaming Services
- 5.2. Market Analysis, Insights and Forecast - by Platform
- 5.2.1. PCs
- 5.2.2. Consoles
- 5.2.3. Mobile Phones
- 5.3. Market Analysis, Insights and Forecast - by Operating System
- 5.3.1. iOS
- 5.3.2. Android
- 5.3.3. Windows
- 5.3.4. Other Operating Systems
- 5.4. Market Analysis, Insights and Forecast - by Region
- 5.4.1. North America
- 5.4.2. Europe
- 5.4.3. Asia Pacific
- 5.4.4. South America
- 5.4.5. Middle East
- 5.1. Market Analysis, Insights and Forecast - by Revenue Model
- 6. Global Online Action Games Market Analysis, Insights and Forecast, 2021-2033
- 6.1. Market Analysis, Insights and Forecast - by Revenue Model
- 6.1.1. Free Gaming Services
- 6.1.2. Paid Gaming Services
- 6.2. Market Analysis, Insights and Forecast - by Platform
- 6.2.1. PCs
- 6.2.2. Consoles
- 6.2.3. Mobile Phones
- 6.3. Market Analysis, Insights and Forecast - by Operating System
- 6.3.1. iOS
- 6.3.2. Android
- 6.3.3. Windows
- 6.3.4. Other Operating Systems
- 6.1. Market Analysis, Insights and Forecast - by Revenue Model
- 7. North America Online Action Games Market Analysis, Insights and Forecast, 2021-2033
- 7.1. Market Analysis, Insights and Forecast - by Revenue Model
- 7.1.1. Free Gaming Services
- 7.1.2. Paid Gaming Services
- 7.2. Market Analysis, Insights and Forecast - by Platform
- 7.2.1. PCs
- 7.2.2. Consoles
- 7.2.3. Mobile Phones
- 7.3. Market Analysis, Insights and Forecast - by Operating System
- 7.3.1. iOS
- 7.3.2. Android
- 7.3.3. Windows
- 7.3.4. Other Operating Systems
- 7.1. Market Analysis, Insights and Forecast - by Revenue Model
- 8. Europe Online Action Games Market Analysis, Insights and Forecast, 2021-2033
- 8.1. Market Analysis, Insights and Forecast - by Revenue Model
- 8.1.1. Free Gaming Services
- 8.1.2. Paid Gaming Services
- 8.2. Market Analysis, Insights and Forecast - by Platform
- 8.2.1. PCs
- 8.2.2. Consoles
- 8.2.3. Mobile Phones
- 8.3. Market Analysis, Insights and Forecast - by Operating System
- 8.3.1. iOS
- 8.3.2. Android
- 8.3.3. Windows
- 8.3.4. Other Operating Systems
- 8.1. Market Analysis, Insights and Forecast - by Revenue Model
- 9. Asia Pacific Online Action Games Market Analysis, Insights and Forecast, 2021-2033
- 9.1. Market Analysis, Insights and Forecast - by Revenue Model
- 9.1.1. Free Gaming Services
- 9.1.2. Paid Gaming Services
- 9.2. Market Analysis, Insights and Forecast - by Platform
- 9.2.1. PCs
- 9.2.2. Consoles
- 9.2.3. Mobile Phones
- 9.3. Market Analysis, Insights and Forecast - by Operating System
- 9.3.1. iOS
- 9.3.2. Android
- 9.3.3. Windows
- 9.3.4. Other Operating Systems
- 9.1. Market Analysis, Insights and Forecast - by Revenue Model
- 10. South America Online Action Games Market Analysis, Insights and Forecast, 2021-2033
- 10.1. Market Analysis, Insights and Forecast - by Revenue Model
- 10.1.1. Free Gaming Services
- 10.1.2. Paid Gaming Services
- 10.2. Market Analysis, Insights and Forecast - by Platform
- 10.2.1. PCs
- 10.2.2. Consoles
- 10.2.3. Mobile Phones
- 10.3. Market Analysis, Insights and Forecast - by Operating System
- 10.3.1. iOS
- 10.3.2. Android
- 10.3.3. Windows
- 10.3.4. Other Operating Systems
- 10.1. Market Analysis, Insights and Forecast - by Revenue Model
- 11. Middle East Online Action Games Market Analysis, Insights and Forecast, 2021-2033
- 11.1. Market Analysis, Insights and Forecast - by Revenue Model
- 11.1.1. Free Gaming Services
- 11.1.2. Paid Gaming Services
- 11.2. Market Analysis, Insights and Forecast - by Platform
- 11.2.1. PCs
- 11.2.2. Consoles
- 11.2.3. Mobile Phones
- 11.3. Market Analysis, Insights and Forecast - by Operating System
- 11.3.1. iOS
- 11.3.2. Android
- 11.3.3. Windows
- 11.3.4. Other Operating Systems
- 11.1. Market Analysis, Insights and Forecast - by Revenue Model
- 12. Competitive Analysis
- 12.1. Company Profiles
- 12.1.1 PlatinumGames
- 12.1.1.1. Company Overview
- 12.1.1.2. Products
- 12.1.1.3. Company Financials
- 12.1.1.4. SWOT Analysis
- 12.1.2 Gameloft
- 12.1.2.1. Company Overview
- 12.1.2.2. Products
- 12.1.2.3. Company Financials
- 12.1.2.4. SWOT Analysis
- 12.1.3 Guerrilla Games
- 12.1.3.1. Company Overview
- 12.1.3.2. Products
- 12.1.3.3. Company Financials
- 12.1.3.4. SWOT Analysis
- 12.1.4 FromSoftware
- 12.1.4.1. Company Overview
- 12.1.4.2. Products
- 12.1.4.3. Company Financials
- 12.1.4.4. SWOT Analysis
- 12.1.5 Konami
- 12.1.5.1. Company Overview
- 12.1.5.2. Products
- 12.1.5.3. Company Financials
- 12.1.5.4. SWOT Analysis
- 12.1.6 SIE Santa Monica Studio
- 12.1.6.1. Company Overview
- 12.1.6.2. Products
- 12.1.6.3. Company Financials
- 12.1.6.4. SWOT Analysis
- 12.1.7 Nintendo EPD
- 12.1.7.1. Company Overview
- 12.1.7.2. Products
- 12.1.7.3. Company Financials
- 12.1.7.4. SWOT Analysis
- 12.1.8 Rocksteady Studios
- 12.1.8.1. Company Overview
- 12.1.8.2. Products
- 12.1.8.3. Company Financials
- 12.1.8.4. SWOT Analysis
- 12.1.9 Tencent
- 12.1.9.1. Company Overview
- 12.1.9.2. Products
- 12.1.9.3. Company Financials
- 12.1.9.4. SWOT Analysis
- 12.1.10 Rockstar North
- 12.1.10.1. Company Overview
- 12.1.10.2. Products
- 12.1.10.3. Company Financials
- 12.1.10.4. SWOT Analysis
- 12.1.11 Sony Interactive Entertainment
- 12.1.11.1. Company Overview
- 12.1.11.2. Products
- 12.1.11.3. Company Financials
- 12.1.11.4. SWOT Analysis
- 12.1.12 EA DICE*List Not Exhaustive
- 12.1.12.1. Company Overview
- 12.1.12.2. Products
- 12.1.12.3. Company Financials
- 12.1.12.4. SWOT Analysis
- 12.1.13 Bethesda Game Studios
- 12.1.13.1. Company Overview
- 12.1.13.2. Products
- 12.1.13.3. Company Financials
- 12.1.13.4. SWOT Analysis
- 12.1.14 Capcom
- 12.1.14.1. Company Overview
- 12.1.14.2. Products
- 12.1.14.3. Company Financials
- 12.1.14.4. SWOT Analysis
- 12.1.15 Ubisoft
- 12.1.15.1. Company Overview
- 12.1.15.2. Products
- 12.1.15.3. Company Financials
- 12.1.15.4. SWOT Analysis
- 12.1.16 id Software
- 12.1.16.1. Company Overview
- 12.1.16.2. Products
- 12.1.16.3. Company Financials
- 12.1.16.4. SWOT Analysis
- 12.1.1 PlatinumGames
- 12.2. Market Entropy
- 12.2.1 Company's Key Areas Served
- 12.2.2 Recent Developments
- 12.3. Company Market Share Analysis 2025
- 12.3.1 Top 5 Companies Market Share Analysis
- 12.3.2 Top 3 Companies Market Share Analysis
- 12.4. List of Potential Customers
- 13. Research Methodology
List of Figures
- Figure 1: Global Online Action Games Market Revenue Breakdown (billion, %) by Region 2025 & 2033
- Figure 2: North America Online Action Games Market Revenue (billion), by Revenue Model 2025 & 2033
- Figure 3: North America Online Action Games Market Revenue Share (%), by Revenue Model 2025 & 2033
- Figure 4: North America Online Action Games Market Revenue (billion), by Platform 2025 & 2033
- Figure 5: North America Online Action Games Market Revenue Share (%), by Platform 2025 & 2033
- Figure 6: North America Online Action Games Market Revenue (billion), by Operating System 2025 & 2033
- Figure 7: North America Online Action Games Market Revenue Share (%), by Operating System 2025 & 2033
- Figure 8: North America Online Action Games Market Revenue (billion), by Country 2025 & 2033
- Figure 9: North America Online Action Games Market Revenue Share (%), by Country 2025 & 2033
- Figure 10: Europe Online Action Games Market Revenue (billion), by Revenue Model 2025 & 2033
- Figure 11: Europe Online Action Games Market Revenue Share (%), by Revenue Model 2025 & 2033
- Figure 12: Europe Online Action Games Market Revenue (billion), by Platform 2025 & 2033
- Figure 13: Europe Online Action Games Market Revenue Share (%), by Platform 2025 & 2033
- Figure 14: Europe Online Action Games Market Revenue (billion), by Operating System 2025 & 2033
- Figure 15: Europe Online Action Games Market Revenue Share (%), by Operating System 2025 & 2033
- Figure 16: Europe Online Action Games Market Revenue (billion), by Country 2025 & 2033
- Figure 17: Europe Online Action Games Market Revenue Share (%), by Country 2025 & 2033
- Figure 18: Asia Pacific Online Action Games Market Revenue (billion), by Revenue Model 2025 & 2033
- Figure 19: Asia Pacific Online Action Games Market Revenue Share (%), by Revenue Model 2025 & 2033
- Figure 20: Asia Pacific Online Action Games Market Revenue (billion), by Platform 2025 & 2033
- Figure 21: Asia Pacific Online Action Games Market Revenue Share (%), by Platform 2025 & 2033
- Figure 22: Asia Pacific Online Action Games Market Revenue (billion), by Operating System 2025 & 2033
- Figure 23: Asia Pacific Online Action Games Market Revenue Share (%), by Operating System 2025 & 2033
- Figure 24: Asia Pacific Online Action Games Market Revenue (billion), by Country 2025 & 2033
- Figure 25: Asia Pacific Online Action Games Market Revenue Share (%), by Country 2025 & 2033
- Figure 26: South America Online Action Games Market Revenue (billion), by Revenue Model 2025 & 2033
- Figure 27: South America Online Action Games Market Revenue Share (%), by Revenue Model 2025 & 2033
- Figure 28: South America Online Action Games Market Revenue (billion), by Platform 2025 & 2033
- Figure 29: South America Online Action Games Market Revenue Share (%), by Platform 2025 & 2033
- Figure 30: South America Online Action Games Market Revenue (billion), by Operating System 2025 & 2033
- Figure 31: South America Online Action Games Market Revenue Share (%), by Operating System 2025 & 2033
- Figure 32: South America Online Action Games Market Revenue (billion), by Country 2025 & 2033
- Figure 33: South America Online Action Games Market Revenue Share (%), by Country 2025 & 2033
- Figure 34: Middle East Online Action Games Market Revenue (billion), by Revenue Model 2025 & 2033
- Figure 35: Middle East Online Action Games Market Revenue Share (%), by Revenue Model 2025 & 2033
- Figure 36: Middle East Online Action Games Market Revenue (billion), by Platform 2025 & 2033
- Figure 37: Middle East Online Action Games Market Revenue Share (%), by Platform 2025 & 2033
- Figure 38: Middle East Online Action Games Market Revenue (billion), by Operating System 2025 & 2033
- Figure 39: Middle East Online Action Games Market Revenue Share (%), by Operating System 2025 & 2033
- Figure 40: Middle East Online Action Games Market Revenue (billion), by Country 2025 & 2033
- Figure 41: Middle East Online Action Games Market Revenue Share (%), by Country 2025 & 2033
List of Tables
- Table 1: Global Online Action Games Market Revenue billion Forecast, by Revenue Model 2020 & 2033
- Table 2: Global Online Action Games Market Revenue billion Forecast, by Platform 2020 & 2033
- Table 3: Global Online Action Games Market Revenue billion Forecast, by Operating System 2020 & 2033
- Table 4: Global Online Action Games Market Revenue billion Forecast, by Region 2020 & 2033
- Table 5: Global Online Action Games Market Revenue billion Forecast, by Revenue Model 2020 & 2033
- Table 6: Global Online Action Games Market Revenue billion Forecast, by Platform 2020 & 2033
- Table 7: Global Online Action Games Market Revenue billion Forecast, by Operating System 2020 & 2033
- Table 8: Global Online Action Games Market Revenue billion Forecast, by Country 2020 & 2033
- Table 9: United States Online Action Games Market Revenue (billion) Forecast, by Application 2020 & 2033
- Table 10: Canada Online Action Games Market Revenue (billion) Forecast, by Application 2020 & 2033
- Table 11: Mexico Online Action Games Market Revenue (billion) Forecast, by Application 2020 & 2033
- Table 12: Rest of North America Online Action Games Market Revenue (billion) Forecast, by Application 2020 & 2033
- Table 13: Global Online Action Games Market Revenue billion Forecast, by Revenue Model 2020 & 2033
- Table 14: Global Online Action Games Market Revenue billion Forecast, by Platform 2020 & 2033
- Table 15: Global Online Action Games Market Revenue billion Forecast, by Operating System 2020 & 2033
- Table 16: Global Online Action Games Market Revenue billion Forecast, by Country 2020 & 2033
- Table 17: Germany Online Action Games Market Revenue (billion) Forecast, by Application 2020 & 2033
- Table 18: United Kingdom Online Action Games Market Revenue (billion) Forecast, by Application 2020 & 2033
- Table 19: France Online Action Games Market Revenue (billion) Forecast, by Application 2020 & 2033
- Table 20: Russia Online Action Games Market Revenue (billion) Forecast, by Application 2020 & 2033
- Table 21: Spain Online Action Games Market Revenue (billion) Forecast, by Application 2020 & 2033
- Table 22: Rest of Europe Online Action Games Market Revenue (billion) Forecast, by Application 2020 & 2033
- Table 23: Global Online Action Games Market Revenue billion Forecast, by Revenue Model 2020 & 2033
- Table 24: Global Online Action Games Market Revenue billion Forecast, by Platform 2020 & 2033
- Table 25: Global Online Action Games Market Revenue billion Forecast, by Operating System 2020 & 2033
- Table 26: Global Online Action Games Market Revenue billion Forecast, by Country 2020 & 2033
- Table 27: India Online Action Games Market Revenue (billion) Forecast, by Application 2020 & 2033
- Table 28: China Online Action Games Market Revenue (billion) Forecast, by Application 2020 & 2033
- Table 29: Japan Online Action Games Market Revenue (billion) Forecast, by Application 2020 & 2033
- Table 30: Rest of Asia Pacific Online Action Games Market Revenue (billion) Forecast, by Application 2020 & 2033
- Table 31: Global Online Action Games Market Revenue billion Forecast, by Revenue Model 2020 & 2033
- Table 32: Global Online Action Games Market Revenue billion Forecast, by Platform 2020 & 2033
- Table 33: Global Online Action Games Market Revenue billion Forecast, by Operating System 2020 & 2033
- Table 34: Global Online Action Games Market Revenue billion Forecast, by Country 2020 & 2033
- Table 35: Brazil Online Action Games Market Revenue (billion) Forecast, by Application 2020 & 2033
- Table 36: Argentina Online Action Games Market Revenue (billion) Forecast, by Application 2020 & 2033
- Table 37: Global Online Action Games Market Revenue billion Forecast, by Revenue Model 2020 & 2033
- Table 38: Global Online Action Games Market Revenue billion Forecast, by Platform 2020 & 2033
- Table 39: Global Online Action Games Market Revenue billion Forecast, by Operating System 2020 & 2033
- Table 40: Global Online Action Games Market Revenue billion Forecast, by Country 2020 & 2033
- Table 41: United Arab Emirates Online Action Games Market Revenue (billion) Forecast, by Application 2020 & 2033
- Table 42: Saudi Arabia Online Action Games Market Revenue (billion) Forecast, by Application 2020 & 2033
- Table 43: Rest of the Middle East Online Action Games Market Revenue (billion) Forecast, by Application 2020 & 2033
Frequently Asked Questions
1. What is the projected Compound Annual Growth Rate (CAGR) of the Online Action Games Market?
The projected CAGR is approximately 7.2%.
2. Which companies are prominent players in the Online Action Games Market?
Key companies in the market include PlatinumGames, Gameloft, Guerrilla Games, FromSoftware, Konami, SIE Santa Monica Studio, Nintendo EPD, Rocksteady Studios, Tencent, Rockstar North, Sony Interactive Entertainment, EA DICE*List Not Exhaustive, Bethesda Game Studios, Capcom, Ubisoft, id Software.
3. What are the main segments of the Online Action Games Market?
The market segments include Revenue Model, Platform, Operating System.
4. Can you provide details about the market size?
The market size is estimated to be USD 6.39 billion as of 2022.
5. What are some drivers contributing to market growth?
Increased Adoption of Smartphones; Increased Utilization of Gaming Simulation for Training and Analysis Across a Variety of Fields; Growing Demand for VR Headsets.
6. What are the notable trends driving market growth?
Surge in the usage of MMORPG Games.
7. Are there any restraints impacting market growth?
Need for Expensive Graphic Cards.
8. Can you provide examples of recent developments in the market?
In July 2022 - Tom Clancy's The Division® Resurgence, a new free-to-play third-person shooter RPG mobile game from Tom Clancy's The Division franchise, was unveiled by Ubisoft. The Division Resurgence by Tom Clancy is a masterpiece with a fresh plot, a new storyline, and difficult opponent groups. The game is accessible for iOS and Android devices in the App Store® and Google PlayTM.
9. What pricing options are available for accessing the report?
Pricing options include single-user, multi-user, and enterprise licenses priced at USD 4750, USD 5250, and USD 8750 respectively.
10. Is the market size provided in terms of value or volume?
The market size is provided in terms of value, measured in billion.
11. Are there any specific market keywords associated with the report?
Yes, the market keyword associated with the report is "Online Action Games Market," which aids in identifying and referencing the specific market segment covered.
12. How do I determine which pricing option suits my needs best?
The pricing options vary based on user requirements and access needs. Individual users may opt for single-user licenses, while businesses requiring broader access may choose multi-user or enterprise licenses for cost-effective access to the report.
13. Are there any additional resources or data provided in the Online Action Games Market report?
While the report offers comprehensive insights, it's advisable to review the specific contents or supplementary materials provided to ascertain if additional resources or data are available.
14. How can I stay updated on further developments or reports in the Online Action Games Market?
To stay informed about further developments, trends, and reports in the Online Action Games Market, consider subscribing to industry newsletters, following relevant companies and organizations, or regularly checking reputable industry news sources and publications.
Methodology
Step 1 - Identification of Relevant Samples Size from Population Database


Step 2 - Approaches for Defining Global Market Size (Value, Volume* & Price*)

Note*: In applicable scenarios
Step 3 - Data Sources
Primary Research
- Web Analytics
- Survey Reports
- Research Institute
- Latest Research Reports
- Opinion Leaders
Secondary Research
- Annual Reports
- White Paper
- Latest Press Release
- Industry Association
- Paid Database
- Investor Presentations

Step 4 - Data Triangulation
Involves using different sources of information in order to increase the validity of a study
These sources are likely to be stakeholders in a program - participants, other researchers, program staff, other community members, and so on.
Then we put all data in single framework & apply various statistical tools to find out the dynamic on the market.
During the analysis stage, feedback from the stakeholder groups would be compared to determine areas of agreement as well as areas of divergence