


Key Insights
The OLED light-emitting layer green dopant material market is poised for substantial growth, projected to reach an estimated market size of approximately $1,500 million by 2025, expanding at a Compound Annual Growth Rate (CAGR) of around 12.5% through 2033. This robust expansion is primarily driven by the escalating demand for advanced display technologies in consumer electronics, particularly smartphones and televisions. The superior color purity, energy efficiency, and thin form factor offered by OLED displays continue to make them the preferred choice for manufacturers seeking to differentiate their products. Furthermore, the growing adoption of OLED technology in emerging applications such as flexible displays, wearables, and automotive dashboards is further fueling market penetration. The market's trajectory is also being shaped by significant investments in research and development by key players, focusing on enhancing dopant material performance, stability, and cost-effectiveness. This continuous innovation is crucial for meeting the stringent requirements of next-generation display technologies.
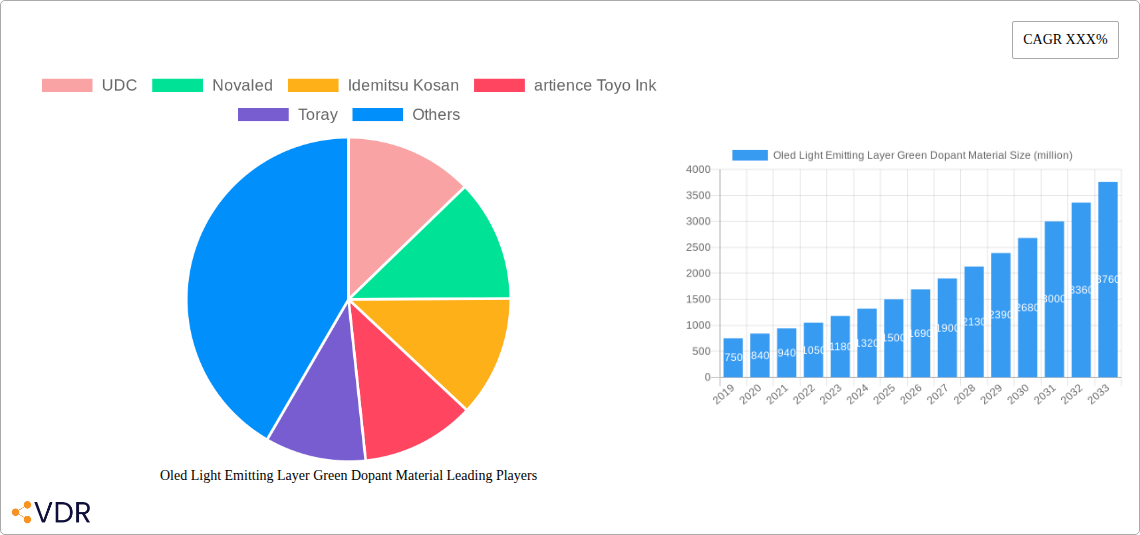
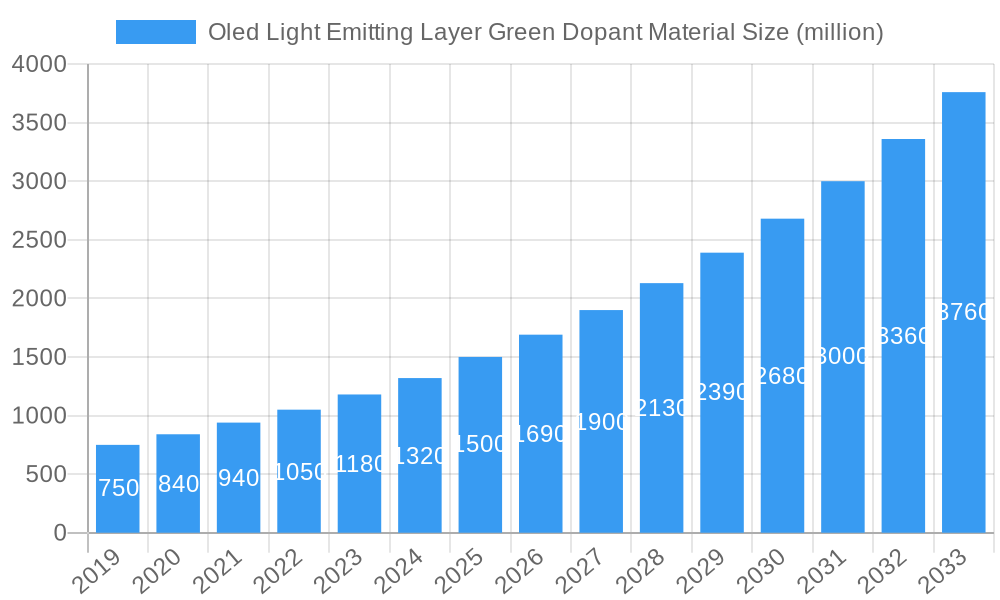
Oled Light Emitting Layer Green Dopant Material Market Size (In Million)

The market is segmented by application into TV, mobile phone, and others, with mobile phones currently representing a dominant segment due to the high replacement rate and increasing integration of OLED screens. However, the "others" segment, encompassing wearables, automotive displays, and emerging applications, is expected to witness the fastest growth. By type, the market comprises fluorescent and phosphorescent materials, with phosphorescent materials gaining traction due to their higher efficiency. Leading companies such as Universal Display Corporation (UDC), Novaled, Idemitsu Kosan, and Toray are at the forefront of this market, actively engaged in product development and strategic collaborations. Geographically, Asia Pacific, led by China and South Korea, is the largest market owing to its strong manufacturing base for consumer electronics and significant domestic demand. While the market enjoys strong growth drivers, potential restraints include the high cost of OLED manufacturing and the ongoing competition from other display technologies like MicroLED. Nevertheless, the inherent advantages of OLEDs and continued technological advancements are expected to outweigh these challenges, solidifying its position in the display industry.
Oled Light Emitting Layer Green Dopant Material Company Market Share
OLED Light Emitting Layer Green Dopant Material Market: Comprehensive Report 2019-2033
This report offers an in-depth analysis of the global OLED Light Emitting Layer Green Dopant Material market, a critical component driving advancements in display technology. Covering the historical period from 2019 to 2024, the base year 2025, and a robust forecast period extending to 2033, this comprehensive study provides actionable insights for stakeholders. We explore market dynamics, growth trends, regional dominance, product landscape, key drivers, barriers, emerging opportunities, and the competitive environment. The report is meticulously structured to provide clear, concise, and data-rich information, valuable for industry professionals, researchers, and investors alike.
OLED Light Emitting Layer Green Dopant Material Market Dynamics & Structure
The OLED light emitting layer green dopant material market is characterized by a moderate to high concentration, with key players investing heavily in research and development to achieve higher efficiency, longer lifetimes, and purer green emission. Technological innovation is the primary driver, fueled by the insatiable demand for brighter, more energy-efficient, and color-accurate displays in consumer electronics. The regulatory framework is largely driven by environmental compliance and material safety standards, influencing the types of dopants and manufacturing processes adopted. Competitive product substitutes, while emerging, currently offer limited performance parity, making material innovation the key differentiator. End-user demographics, particularly the growing demand for premium smartphones and high-resolution televisions, dictate the pace of adoption. Mergers and acquisitions (M&A) are likely to increase as companies seek to consolidate intellectual property and expand their product portfolios, potentially leading to further market consolidation.
- Market Concentration: Dominated by a few key chemical and materials science companies.
- Technological Innovation Drivers: Enhanced quantum efficiency, improved color purity (CIE coordinates), extended operational lifetime (LT95, LT50), and reduced manufacturing costs.
- Regulatory Frameworks: REACH compliance, RoHS directives, and evolving standards for material safety and environmental impact.
- Competitive Product Substitutes: While advancements in other display technologies exist, the superior contrast ratio and black levels of OLEDs maintain strong demand for OLED materials.
- End-User Demographics: Growing middle class in emerging economies, increasing disposable income, and preference for premium electronics.
- M&A Trends: Anticipated consolidation to gain market share and acquire critical IP, potentially involving a few significant deals in the forecast period.
OLED Light Emitting Layer Green Dopant Material Growth Trends & Insights
The global OLED light emitting layer green dopant material market is poised for substantial growth, driven by the escalating adoption of OLED technology across various consumer electronics. The market is projected to witness a compound annual growth rate (CAGR) of approximately 12.5% from 2025 to 2033. This robust expansion is underpinned by the increasing penetration of OLED displays in smartphones, which have become a primary growth engine. Beyond mobile devices, the burgeoning demand for large-format, high-resolution OLED televisions, coupled with emerging applications in wearables, automotive displays, and augmented/virtual reality (AR/VR) devices, will further accelerate market adoption.
Technological disruptions, particularly the continuous improvement in dopant efficiency and material stability, are crucial in enabling next-generation OLED displays with enhanced performance characteristics. Manufacturers are actively developing dopants that offer deeper green hues, higher luminescence, and extended operational lifetimes, directly addressing consumer demands for more immersive and visually appealing experiences. Furthermore, the shift towards phosphorescent emitters, offering theoretical internal quantum efficiencies of 100%, is a significant trend impacting the dopant material market. This transition necessitates the development of highly efficient green phosphorescent dopants that can maintain color purity and long lifetimes.
Consumer behavior shifts, including a growing preference for flexible and foldable displays, are also influencing the market. The demand for dopant materials compatible with these form factors, while maintaining performance, presents both challenges and opportunities. The increasing awareness among consumers about display quality, color accuracy, and energy efficiency further propends the adoption of OLEDs, thereby boosting the demand for advanced green dopant materials. The market penetration of OLED technology in premium smartphone segments is already high, and its expansion into mid-range devices and other electronic categories is expected to create significant new avenues for growth in the coming years. The market size is estimated to reach $4,500 million by 2033, up from an estimated $1,750 million in 2025.
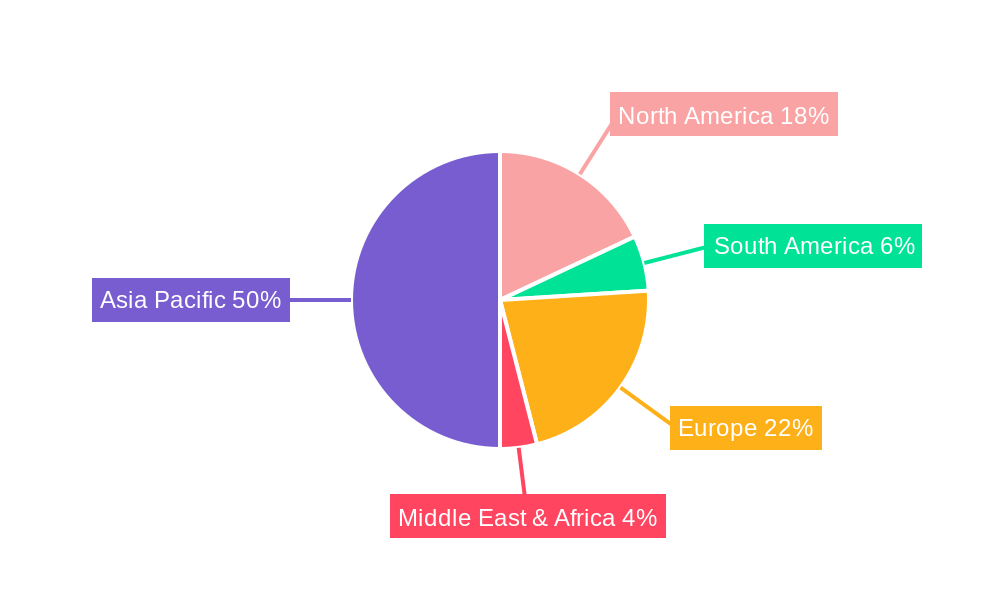
Dominant Regions, Countries, or Segments in Oled Light Emitting Layer Green Dopant Material
The Asia-Pacific region stands as the undisputed leader in the OLED light emitting layer green dopant material market, driven by its manufacturing prowess and the sheer volume of OLED panel production. Within this region, South Korea and China are the dominant countries. South Korea, home to pioneering OLED manufacturers like Samsung Display and LG Display, has consistently led in technological innovation and production capacity. China, with its rapidly expanding display industry and substantial government investment, is rapidly closing the gap and is expected to become the largest consumer and producer of OLED materials in the forecast period.
The Application: Mobile Phone segment is the largest contributor to the market's current value and is expected to maintain its dominance throughout the forecast period. The widespread adoption of OLED displays in smartphones, from premium flagships to increasingly capable mid-range devices, fuels a constant demand for high-performance green dopant materials. The superior contrast ratios, vibrant colors, and energy efficiency offered by OLED technology make it the preferred choice for mobile device manufacturers catering to consumer preferences for visually appealing and power-efficient smartphones.
The Type: Phosphorescent Material segment is experiencing the most rapid growth. While fluorescent materials have historically played a role, phosphorescent dopants offer significantly higher internal quantum efficiencies, translating to brighter displays and lower power consumption. This technological advantage is driving a strong trend towards phosphorescent-based OLED devices. The development of stable and efficient green phosphorescent dopants is critical for achieving the full potential of OLED technology, making this segment a key area of focus for research and investment.
- Dominant Region: Asia-Pacific
- Key Countries: South Korea, China, Japan
- Drivers: High concentration of OLED panel manufacturers, robust electronics industry, government support for display technology R&D.
- Dominant Segment (Application): Mobile Phone
- Market Share (Estimated 2025): ~65%
- Growth Drivers: Increasing OLED penetration in mid-range devices, demand for foldable and flexible displays, consumer preference for premium visuals.
- Dominant Segment (Type): Phosphorescent Material
- Market Share (Estimated 2025): ~58%
- Growth Drivers: Superior quantum efficiency (up to 100% internal), improved power efficiency, enhanced brightness and color purity.
- Country-Specific Dominance: South Korean companies (e.g., UDC, Novaled) have historically led in phosphorescent emitter development, while Chinese and Japanese firms are rapidly advancing their capabilities.
OLED Light Emitting Layer Green Dopant Material Product Landscape
The product landscape for OLED light emitting layer green dopant materials is characterized by continuous innovation aimed at enhancing efficiency, stability, and color purity. Key product developments focus on highly efficient phosphorescent emitters that achieve deeper green wavelengths with precise CIE coordinates, minimizing color shift over time. Manufacturers are also developing dopants with extended operational lifetimes, crucial for the longevity of OLED displays in devices like televisions and monitors. Furthermore, the demand for solution-processable dopants is growing, enabling more cost-effective manufacturing techniques like inkjet printing, which could revolutionize OLED production. Novel molecular designs are being explored to improve thermal stability and prevent degradation, ensuring consistent performance across a wide range of operating temperatures.
Key Drivers, Barriers & Challenges in Oled Light Emitting Layer Green Dopant Material
Key Drivers:
- Rising Demand for OLED Displays: The increasing adoption of OLEDs in smartphones, TVs, wearables, and automotive applications is the primary growth catalyst.
- Technological Advancements: Continuous innovation in dopant efficiency, color purity, and operational lifetime directly fuels market expansion.
- Energy Efficiency Requirements: OLEDs' inherent energy efficiency appeals to consumers and regulatory bodies, driving demand for advanced materials.
- Premium Product Differentiation: Manufacturers leverage OLED technology to offer visually superior and differentiated products.
Barriers & Challenges:
- High R&D Costs: Developing novel and high-performance dopant materials requires significant and ongoing investment in research.
- Intellectual Property Landscape: A complex web of patents can create barriers to entry and necessitate licensing agreements, impacting profitability.
- Supply Chain Volatility: Reliance on specialized raw materials and complex manufacturing processes can lead to supply chain disruptions and price fluctuations.
- Competition from Emerging Technologies: While OLED dominates premium segments, continuous advancements in MicroLED and other display technologies pose a long-term competitive threat.
- Cost-Sensitivity in Mid-Range Markets: Achieving cost-competitiveness in broader market segments remains a challenge, impacting the widespread adoption of the most advanced dopants.
Emerging Opportunities in Oled Light Emitting Layer Green Dopant Material
Emerging opportunities lie in the development of ultra-high efficiency and long-lifetime green dopants that can enable next-generation foldable and rollable displays with enhanced durability. The growing automotive sector's demand for sophisticated in-car displays presents a significant untapped market. Furthermore, research into thermally activated delayed fluorescence (TADF) materials for green emitters offers a promising pathway to achieve efficiencies comparable to phosphorescence with simpler molecular structures. The exploration of novel encapsulation techniques that improve dopant stability against moisture and oxygen will also unlock new application possibilities, particularly in outdoor and industrial display environments.
Growth Accelerators in the Oled Light Emitting Layer Green Dopant Material Industry
The long-term growth of the OLED light emitting layer green dopant material industry is propelled by several key accelerators. Technological breakthroughs in material design, particularly those enabling higher quantum efficiencies and improved color saturation, are fundamental. Strategic partnerships between dopant material manufacturers, OLED panel producers, and device brands foster collaborative innovation and ensure market alignment. The expansion of OLED technology into new application areas such as automotive displays, medical devices, and digital signage will significantly broaden the market base. Furthermore, increasing consumer demand for immersive visual experiences and the ongoing trend towards larger, more flexible, and higher-resolution displays will continue to drive the need for advanced green dopant materials.
Key Players Shaping the Oled Light Emitting Layer Green Dopant Material Market
- Universal Display Corporation (UDC)
- Novaled
- Idemitsu Kosan
- artience Toyo Ink
- Toray
- Nippon Fine Chemical
- Doosan
- Duk San Neolux
Notable Milestones in Oled Light Emitting Layer Green Dopant Material Sector
- 2019: Introduction of next-generation phosphorescent green emitters by UDC with enhanced lifetime and efficiency.
- 2020: Novaled expands its portfolio with highly stable dopant materials for improved device longevity.
- 2021: Idemitsu Kosan announces breakthroughs in solution-processable OLED materials for cost-effective manufacturing.
- 2022: artience Toyo Ink focuses on developing environmentally friendly dopant synthesis processes.
- 2023: Toray showcases advanced green dopants with superior color purity for high-end display applications.
- 2024: Duk San Neolux introduces dopant materials optimized for foldable and flexible OLED displays.
- 2025 (Estimated): Significant advancements in TADF-based green emitters are anticipated, potentially impacting market dynamics.
- 2026 (Estimated): Increased adoption of dopant materials tailored for automotive and industrial display applications.
In-Depth Oled Light Emitting Layer Green Dopant Material Market Outlook
The future outlook for the OLED light emitting layer green dopant material market is exceptionally positive, driven by sustained innovation and expanding application frontiers. Growth accelerators, including continuous technological breakthroughs in efficiency and lifetime, coupled with strategic collaborations across the value chain, will solidify the market's upward trajectory. The increasing penetration of OLEDs into mid-range smartphones and the burgeoning demand from the automotive and AR/VR sectors represent significant untapped potential. As display technology evolves towards more flexible, transparent, and energy-efficient form factors, the development and adoption of advanced green dopant materials will be paramount, ensuring a dynamic and lucrative market landscape for the foreseeable future.
Oled Light Emitting Layer Green Dopant Material Segmentation
-
1. Application
- 1.1. TV
- 1.2. Mobile Phone
- 1.3. Others
-
2. Type
- 2.1. Fluorescent Material
- 2.2. Phosphorescent Material
Oled Light Emitting Layer Green Dopant Material Segmentation By Geography
-
1. North America
- 1.1. United States
- 1.2. Canada
- 1.3. Mexico
-
2. South America
- 2.1. Brazil
- 2.2. Argentina
- 2.3. Rest of South America
-
3. Europe
- 3.1. United Kingdom
- 3.2. Germany
- 3.3. France
- 3.4. Italy
- 3.5. Spain
- 3.6. Russia
- 3.7. Benelux
- 3.8. Nordics
- 3.9. Rest of Europe
-
4. Middle East & Africa
- 4.1. Turkey
- 4.2. Israel
- 4.3. GCC
- 4.4. North Africa
- 4.5. South Africa
- 4.6. Rest of Middle East & Africa
-
5. Asia Pacific
- 5.1. China
- 5.2. India
- 5.3. Japan
- 5.4. South Korea
- 5.5. ASEAN
- 5.6. Oceania
- 5.7. Rest of Asia Pacific
Oled Light Emitting Layer Green Dopant Material Regional Market Share
Geographic Coverage of Oled Light Emitting Layer Green Dopant Material
Oled Light Emitting Layer Green Dopant Material REPORT HIGHLIGHTS
| Aspects | Details |
|---|---|
| Study Period | 2020-2034 |
| Base Year | 2025 |
| Estimated Year | 2026 |
| Forecast Period | 2026-2034 |
| Historical Period | 2020-2025 |
| Growth Rate | CAGR of XXX% from 2020-2034 |
| Segmentation |
|
Table of Contents
- 1. Introduction
- 1.1. Research Scope
- 1.2. Market Segmentation
- 1.3. Research Methodology
- 1.4. Definitions and Assumptions
- 2. Executive Summary
- 2.1. Introduction
- 3. Market Dynamics
- 3.1. Introduction
- 3.2. Market Drivers
- 3.3. Market Restrains
- 3.4. Market Trends
- 4. Market Factor Analysis
- 4.1. Porters Five Forces
- 4.2. Supply/Value Chain
- 4.3. PESTEL analysis
- 4.4. Market Entropy
- 4.5. Patent/Trademark Analysis
- 5. Global Oled Light Emitting Layer Green Dopant Material Analysis, Insights and Forecast, 2020-2032
- 5.1. Market Analysis, Insights and Forecast - by Application
- 5.1.1. TV
- 5.1.2. Mobile Phone
- 5.1.3. Others
- 5.2. Market Analysis, Insights and Forecast - by Type
- 5.2.1. Fluorescent Material
- 5.2.2. Phosphorescent Material
- 5.3. Market Analysis, Insights and Forecast - by Region
- 5.3.1. North America
- 5.3.2. South America
- 5.3.3. Europe
- 5.3.4. Middle East & Africa
- 5.3.5. Asia Pacific
- 5.1. Market Analysis, Insights and Forecast - by Application
- 6. North America Oled Light Emitting Layer Green Dopant Material Analysis, Insights and Forecast, 2020-2032
- 6.1. Market Analysis, Insights and Forecast - by Application
- 6.1.1. TV
- 6.1.2. Mobile Phone
- 6.1.3. Others
- 6.2. Market Analysis, Insights and Forecast - by Type
- 6.2.1. Fluorescent Material
- 6.2.2. Phosphorescent Material
- 6.1. Market Analysis, Insights and Forecast - by Application
- 7. South America Oled Light Emitting Layer Green Dopant Material Analysis, Insights and Forecast, 2020-2032
- 7.1. Market Analysis, Insights and Forecast - by Application
- 7.1.1. TV
- 7.1.2. Mobile Phone
- 7.1.3. Others
- 7.2. Market Analysis, Insights and Forecast - by Type
- 7.2.1. Fluorescent Material
- 7.2.2. Phosphorescent Material
- 7.1. Market Analysis, Insights and Forecast - by Application
- 8. Europe Oled Light Emitting Layer Green Dopant Material Analysis, Insights and Forecast, 2020-2032
- 8.1. Market Analysis, Insights and Forecast - by Application
- 8.1.1. TV
- 8.1.2. Mobile Phone
- 8.1.3. Others
- 8.2. Market Analysis, Insights and Forecast - by Type
- 8.2.1. Fluorescent Material
- 8.2.2. Phosphorescent Material
- 8.1. Market Analysis, Insights and Forecast - by Application
- 9. Middle East & Africa Oled Light Emitting Layer Green Dopant Material Analysis, Insights and Forecast, 2020-2032
- 9.1. Market Analysis, Insights and Forecast - by Application
- 9.1.1. TV
- 9.1.2. Mobile Phone
- 9.1.3. Others
- 9.2. Market Analysis, Insights and Forecast - by Type
- 9.2.1. Fluorescent Material
- 9.2.2. Phosphorescent Material
- 9.1. Market Analysis, Insights and Forecast - by Application
- 10. Asia Pacific Oled Light Emitting Layer Green Dopant Material Analysis, Insights and Forecast, 2020-2032
- 10.1. Market Analysis, Insights and Forecast - by Application
- 10.1.1. TV
- 10.1.2. Mobile Phone
- 10.1.3. Others
- 10.2. Market Analysis, Insights and Forecast - by Type
- 10.2.1. Fluorescent Material
- 10.2.2. Phosphorescent Material
- 10.1. Market Analysis, Insights and Forecast - by Application
- 11. Competitive Analysis
- 11.1. Global Market Share Analysis 2025
- 11.2. Company Profiles
- 11.2.1 UDC
- 11.2.1.1. Overview
- 11.2.1.2. Products
- 11.2.1.3. SWOT Analysis
- 11.2.1.4. Recent Developments
- 11.2.1.5. Financials (Based on Availability)
- 11.2.2 Novaled
- 11.2.2.1. Overview
- 11.2.2.2. Products
- 11.2.2.3. SWOT Analysis
- 11.2.2.4. Recent Developments
- 11.2.2.5. Financials (Based on Availability)
- 11.2.3 Idemitsu Kosan
- 11.2.3.1. Overview
- 11.2.3.2. Products
- 11.2.3.3. SWOT Analysis
- 11.2.3.4. Recent Developments
- 11.2.3.5. Financials (Based on Availability)
- 11.2.4 artience Toyo Ink
- 11.2.4.1. Overview
- 11.2.4.2. Products
- 11.2.4.3. SWOT Analysis
- 11.2.4.4. Recent Developments
- 11.2.4.5. Financials (Based on Availability)
- 11.2.5 Toray
- 11.2.5.1. Overview
- 11.2.5.2. Products
- 11.2.5.3. SWOT Analysis
- 11.2.5.4. Recent Developments
- 11.2.5.5. Financials (Based on Availability)
- 11.2.6 Nippon Fine Chemical
- 11.2.6.1. Overview
- 11.2.6.2. Products
- 11.2.6.3. SWOT Analysis
- 11.2.6.4. Recent Developments
- 11.2.6.5. Financials (Based on Availability)
- 11.2.7 Doosan
- 11.2.7.1. Overview
- 11.2.7.2. Products
- 11.2.7.3. SWOT Analysis
- 11.2.7.4. Recent Developments
- 11.2.7.5. Financials (Based on Availability)
- 11.2.8 Duk San Neolux
- 11.2.8.1. Overview
- 11.2.8.2. Products
- 11.2.8.3. SWOT Analysis
- 11.2.8.4. Recent Developments
- 11.2.8.5. Financials (Based on Availability)
- 11.2.1 UDC
List of Figures
- Figure 1: Global Oled Light Emitting Layer Green Dopant Material Revenue Breakdown (million, %) by Region 2025 & 2033
- Figure 2: North America Oled Light Emitting Layer Green Dopant Material Revenue (million), by Application 2025 & 2033
- Figure 3: North America Oled Light Emitting Layer Green Dopant Material Revenue Share (%), by Application 2025 & 2033
- Figure 4: North America Oled Light Emitting Layer Green Dopant Material Revenue (million), by Type 2025 & 2033
- Figure 5: North America Oled Light Emitting Layer Green Dopant Material Revenue Share (%), by Type 2025 & 2033
- Figure 6: North America Oled Light Emitting Layer Green Dopant Material Revenue (million), by Country 2025 & 2033
- Figure 7: North America Oled Light Emitting Layer Green Dopant Material Revenue Share (%), by Country 2025 & 2033
- Figure 8: South America Oled Light Emitting Layer Green Dopant Material Revenue (million), by Application 2025 & 2033
- Figure 9: South America Oled Light Emitting Layer Green Dopant Material Revenue Share (%), by Application 2025 & 2033
- Figure 10: South America Oled Light Emitting Layer Green Dopant Material Revenue (million), by Type 2025 & 2033
- Figure 11: South America Oled Light Emitting Layer Green Dopant Material Revenue Share (%), by Type 2025 & 2033
- Figure 12: South America Oled Light Emitting Layer Green Dopant Material Revenue (million), by Country 2025 & 2033
- Figure 13: South America Oled Light Emitting Layer Green Dopant Material Revenue Share (%), by Country 2025 & 2033
- Figure 14: Europe Oled Light Emitting Layer Green Dopant Material Revenue (million), by Application 2025 & 2033
- Figure 15: Europe Oled Light Emitting Layer Green Dopant Material Revenue Share (%), by Application 2025 & 2033
- Figure 16: Europe Oled Light Emitting Layer Green Dopant Material Revenue (million), by Type 2025 & 2033
- Figure 17: Europe Oled Light Emitting Layer Green Dopant Material Revenue Share (%), by Type 2025 & 2033
- Figure 18: Europe Oled Light Emitting Layer Green Dopant Material Revenue (million), by Country 2025 & 2033
- Figure 19: Europe Oled Light Emitting Layer Green Dopant Material Revenue Share (%), by Country 2025 & 2033
- Figure 20: Middle East & Africa Oled Light Emitting Layer Green Dopant Material Revenue (million), by Application 2025 & 2033
- Figure 21: Middle East & Africa Oled Light Emitting Layer Green Dopant Material Revenue Share (%), by Application 2025 & 2033
- Figure 22: Middle East & Africa Oled Light Emitting Layer Green Dopant Material Revenue (million), by Type 2025 & 2033
- Figure 23: Middle East & Africa Oled Light Emitting Layer Green Dopant Material Revenue Share (%), by Type 2025 & 2033
- Figure 24: Middle East & Africa Oled Light Emitting Layer Green Dopant Material Revenue (million), by Country 2025 & 2033
- Figure 25: Middle East & Africa Oled Light Emitting Layer Green Dopant Material Revenue Share (%), by Country 2025 & 2033
- Figure 26: Asia Pacific Oled Light Emitting Layer Green Dopant Material Revenue (million), by Application 2025 & 2033
- Figure 27: Asia Pacific Oled Light Emitting Layer Green Dopant Material Revenue Share (%), by Application 2025 & 2033
- Figure 28: Asia Pacific Oled Light Emitting Layer Green Dopant Material Revenue (million), by Type 2025 & 2033
- Figure 29: Asia Pacific Oled Light Emitting Layer Green Dopant Material Revenue Share (%), by Type 2025 & 2033
- Figure 30: Asia Pacific Oled Light Emitting Layer Green Dopant Material Revenue (million), by Country 2025 & 2033
- Figure 31: Asia Pacific Oled Light Emitting Layer Green Dopant Material Revenue Share (%), by Country 2025 & 2033
List of Tables
- Table 1: Global Oled Light Emitting Layer Green Dopant Material Revenue million Forecast, by Application 2020 & 2033
- Table 2: Global Oled Light Emitting Layer Green Dopant Material Revenue million Forecast, by Type 2020 & 2033
- Table 3: Global Oled Light Emitting Layer Green Dopant Material Revenue million Forecast, by Region 2020 & 2033
- Table 4: Global Oled Light Emitting Layer Green Dopant Material Revenue million Forecast, by Application 2020 & 2033
- Table 5: Global Oled Light Emitting Layer Green Dopant Material Revenue million Forecast, by Type 2020 & 2033
- Table 6: Global Oled Light Emitting Layer Green Dopant Material Revenue million Forecast, by Country 2020 & 2033
- Table 7: United States Oled Light Emitting Layer Green Dopant Material Revenue (million) Forecast, by Application 2020 & 2033
- Table 8: Canada Oled Light Emitting Layer Green Dopant Material Revenue (million) Forecast, by Application 2020 & 2033
- Table 9: Mexico Oled Light Emitting Layer Green Dopant Material Revenue (million) Forecast, by Application 2020 & 2033
- Table 10: Global Oled Light Emitting Layer Green Dopant Material Revenue million Forecast, by Application 2020 & 2033
- Table 11: Global Oled Light Emitting Layer Green Dopant Material Revenue million Forecast, by Type 2020 & 2033
- Table 12: Global Oled Light Emitting Layer Green Dopant Material Revenue million Forecast, by Country 2020 & 2033
- Table 13: Brazil Oled Light Emitting Layer Green Dopant Material Revenue (million) Forecast, by Application 2020 & 2033
- Table 14: Argentina Oled Light Emitting Layer Green Dopant Material Revenue (million) Forecast, by Application 2020 & 2033
- Table 15: Rest of South America Oled Light Emitting Layer Green Dopant Material Revenue (million) Forecast, by Application 2020 & 2033
- Table 16: Global Oled Light Emitting Layer Green Dopant Material Revenue million Forecast, by Application 2020 & 2033
- Table 17: Global Oled Light Emitting Layer Green Dopant Material Revenue million Forecast, by Type 2020 & 2033
- Table 18: Global Oled Light Emitting Layer Green Dopant Material Revenue million Forecast, by Country 2020 & 2033
- Table 19: United Kingdom Oled Light Emitting Layer Green Dopant Material Revenue (million) Forecast, by Application 2020 & 2033
- Table 20: Germany Oled Light Emitting Layer Green Dopant Material Revenue (million) Forecast, by Application 2020 & 2033
- Table 21: France Oled Light Emitting Layer Green Dopant Material Revenue (million) Forecast, by Application 2020 & 2033
- Table 22: Italy Oled Light Emitting Layer Green Dopant Material Revenue (million) Forecast, by Application 2020 & 2033
- Table 23: Spain Oled Light Emitting Layer Green Dopant Material Revenue (million) Forecast, by Application 2020 & 2033
- Table 24: Russia Oled Light Emitting Layer Green Dopant Material Revenue (million) Forecast, by Application 2020 & 2033
- Table 25: Benelux Oled Light Emitting Layer Green Dopant Material Revenue (million) Forecast, by Application 2020 & 2033
- Table 26: Nordics Oled Light Emitting Layer Green Dopant Material Revenue (million) Forecast, by Application 2020 & 2033
- Table 27: Rest of Europe Oled Light Emitting Layer Green Dopant Material Revenue (million) Forecast, by Application 2020 & 2033
- Table 28: Global Oled Light Emitting Layer Green Dopant Material Revenue million Forecast, by Application 2020 & 2033
- Table 29: Global Oled Light Emitting Layer Green Dopant Material Revenue million Forecast, by Type 2020 & 2033
- Table 30: Global Oled Light Emitting Layer Green Dopant Material Revenue million Forecast, by Country 2020 & 2033
- Table 31: Turkey Oled Light Emitting Layer Green Dopant Material Revenue (million) Forecast, by Application 2020 & 2033
- Table 32: Israel Oled Light Emitting Layer Green Dopant Material Revenue (million) Forecast, by Application 2020 & 2033
- Table 33: GCC Oled Light Emitting Layer Green Dopant Material Revenue (million) Forecast, by Application 2020 & 2033
- Table 34: North Africa Oled Light Emitting Layer Green Dopant Material Revenue (million) Forecast, by Application 2020 & 2033
- Table 35: South Africa Oled Light Emitting Layer Green Dopant Material Revenue (million) Forecast, by Application 2020 & 2033
- Table 36: Rest of Middle East & Africa Oled Light Emitting Layer Green Dopant Material Revenue (million) Forecast, by Application 2020 & 2033
- Table 37: Global Oled Light Emitting Layer Green Dopant Material Revenue million Forecast, by Application 2020 & 2033
- Table 38: Global Oled Light Emitting Layer Green Dopant Material Revenue million Forecast, by Type 2020 & 2033
- Table 39: Global Oled Light Emitting Layer Green Dopant Material Revenue million Forecast, by Country 2020 & 2033
- Table 40: China Oled Light Emitting Layer Green Dopant Material Revenue (million) Forecast, by Application 2020 & 2033
- Table 41: India Oled Light Emitting Layer Green Dopant Material Revenue (million) Forecast, by Application 2020 & 2033
- Table 42: Japan Oled Light Emitting Layer Green Dopant Material Revenue (million) Forecast, by Application 2020 & 2033
- Table 43: South Korea Oled Light Emitting Layer Green Dopant Material Revenue (million) Forecast, by Application 2020 & 2033
- Table 44: ASEAN Oled Light Emitting Layer Green Dopant Material Revenue (million) Forecast, by Application 2020 & 2033
- Table 45: Oceania Oled Light Emitting Layer Green Dopant Material Revenue (million) Forecast, by Application 2020 & 2033
- Table 46: Rest of Asia Pacific Oled Light Emitting Layer Green Dopant Material Revenue (million) Forecast, by Application 2020 & 2033
Frequently Asked Questions
1. What is the projected Compound Annual Growth Rate (CAGR) of the Oled Light Emitting Layer Green Dopant Material?
The projected CAGR is approximately XXX%.
2. Which companies are prominent players in the Oled Light Emitting Layer Green Dopant Material?
Key companies in the market include UDC, Novaled, Idemitsu Kosan, artience Toyo Ink, Toray, Nippon Fine Chemical, Doosan, Duk San Neolux.
3. What are the main segments of the Oled Light Emitting Layer Green Dopant Material?
The market segments include Application, Type.
4. Can you provide details about the market size?
The market size is estimated to be USD XXX million as of 2022.
5. What are some drivers contributing to market growth?
N/A
6. What are the notable trends driving market growth?
N/A
7. Are there any restraints impacting market growth?
N/A
8. Can you provide examples of recent developments in the market?
N/A
9. What pricing options are available for accessing the report?
Pricing options include single-user, multi-user, and enterprise licenses priced at USD 2900.00, USD 4350.00, and USD 5800.00 respectively.
10. Is the market size provided in terms of value or volume?
The market size is provided in terms of value, measured in million.
11. Are there any specific market keywords associated with the report?
Yes, the market keyword associated with the report is "Oled Light Emitting Layer Green Dopant Material," which aids in identifying and referencing the specific market segment covered.
12. How do I determine which pricing option suits my needs best?
The pricing options vary based on user requirements and access needs. Individual users may opt for single-user licenses, while businesses requiring broader access may choose multi-user or enterprise licenses for cost-effective access to the report.
13. Are there any additional resources or data provided in the Oled Light Emitting Layer Green Dopant Material report?
While the report offers comprehensive insights, it's advisable to review the specific contents or supplementary materials provided to ascertain if additional resources or data are available.
14. How can I stay updated on further developments or reports in the Oled Light Emitting Layer Green Dopant Material?
To stay informed about further developments, trends, and reports in the Oled Light Emitting Layer Green Dopant Material, consider subscribing to industry newsletters, following relevant companies and organizations, or regularly checking reputable industry news sources and publications.
Methodology
Step 1 - Identification of Relevant Samples Size from Population Database


Step 2 - Approaches for Defining Global Market Size (Value, Volume* & Price*)

Note*: In applicable scenarios
Step 3 - Data Sources
Primary Research
- Web Analytics
- Survey Reports
- Research Institute
- Latest Research Reports
- Opinion Leaders
Secondary Research
- Annual Reports
- White Paper
- Latest Press Release
- Industry Association
- Paid Database
- Investor Presentations

Step 4 - Data Triangulation
Involves using different sources of information in order to increase the validity of a study
These sources are likely to be stakeholders in a program - participants, other researchers, program staff, other community members, and so on.
Then we put all data in single framework & apply various statistical tools to find out the dynamic on the market.
During the analysis stage, feedback from the stakeholder groups would be compared to determine areas of agreement as well as areas of divergence