

Key Insights
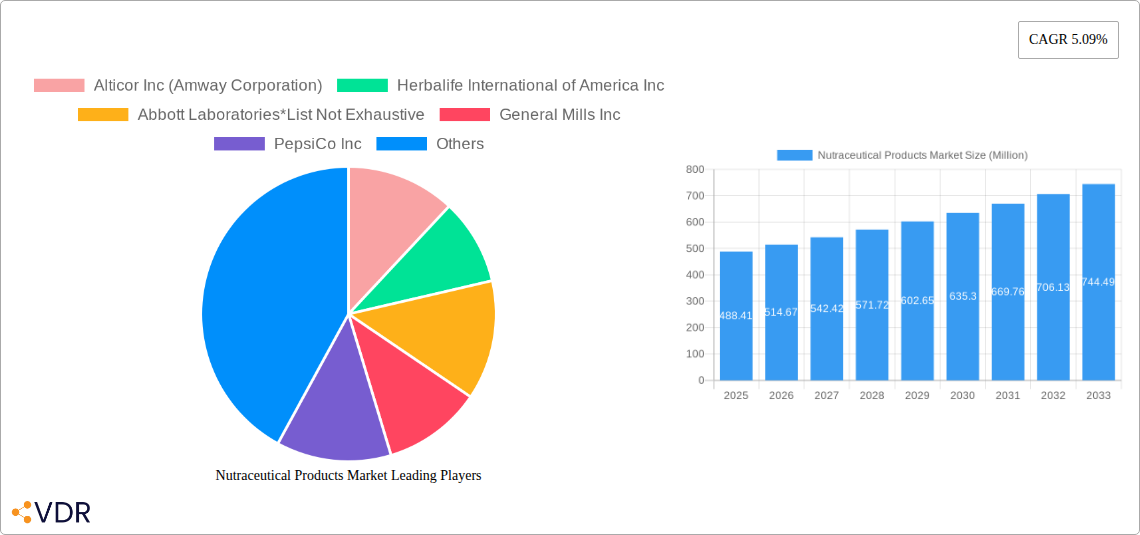
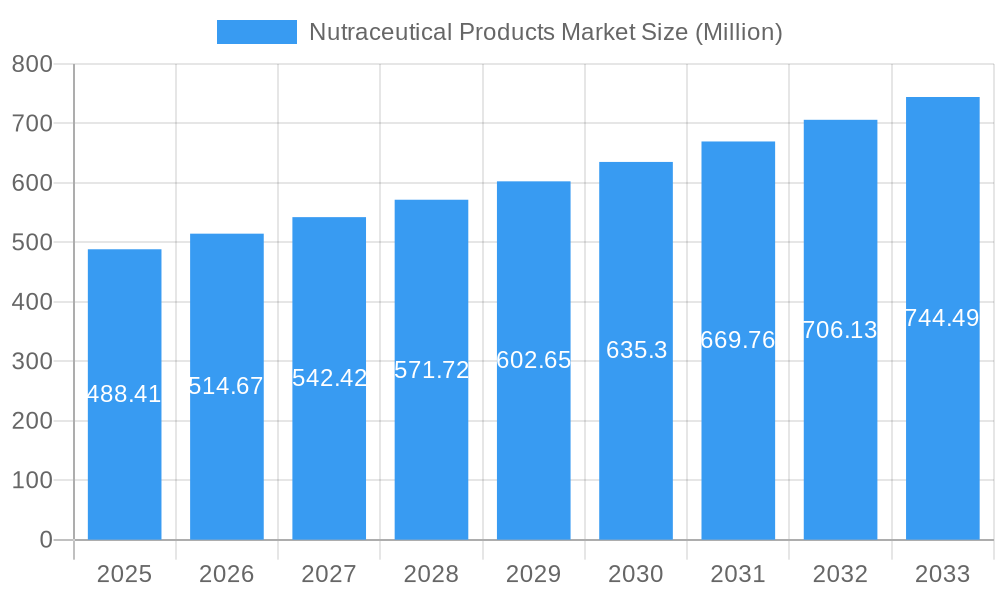
The global nutraceutical products market, valued at $488.41 million in 2025, is projected to experience robust growth, driven by increasing health consciousness among consumers and a rising prevalence of chronic diseases. The market's Compound Annual Growth Rate (CAGR) of 5.09% from 2019 to 2024 suggests a sustained upward trajectory, expected to continue throughout the forecast period (2025-2033). Key drivers include the growing demand for functional foods and beverages, fueled by rising disposable incomes and increased awareness of the benefits of preventative healthcare. The burgeoning popularity of dietary supplements, particularly those addressing specific health concerns like immunity and gut health, further propels market expansion. While challenges exist, such as stringent regulatory frameworks and concerns about product efficacy and safety, these are largely outweighed by the significant growth potential. The market segmentation highlights a diverse landscape, with functional foods and beverages dominating, and distribution channels ranging from specialty stores and supermarkets to the rapidly expanding online retail sector. Leading companies are strategically leveraging innovation, acquisitions, and strong brand recognition to solidify their positions within this competitive market. Geographical distribution reflects diverse regional growth patterns, with North America and Europe likely to maintain significant market share due to established health and wellness cultures and higher per capita spending. However, the Asia-Pacific region is anticipated to witness substantial growth driven by rapid economic development and rising middle-class populations adopting Westernized dietary habits.
Nutraceutical Products Market Market Size (In Million)
The success of individual players in the nutraceutical products market hinges on several factors including product differentiation, robust research and development efforts to substantiate efficacy claims, and effective marketing strategies targeting specific consumer segments. Furthermore, strategic partnerships, particularly within the supply chain, are essential for ensuring product quality and efficient distribution. Future market trends indicate a continued focus on personalized nutrition solutions, leveraging advancements in genomics and precision medicine. Sustainability concerns are also gaining traction, with consumers increasingly seeking products with eco-friendly packaging and ethically sourced ingredients. This necessitates manufacturers to adapt their production processes and marketing messages to reflect these evolving consumer preferences. The market's growth trajectory is projected to remain positive, offering significant opportunities for companies that effectively navigate the regulatory landscape, cater to evolving consumer demands, and demonstrate a strong commitment to product quality and transparency.
Nutraceutical Products Market Company Market Share
Nutraceutical Products Market: A Comprehensive Market Report (2019-2033)
This in-depth report provides a comprehensive analysis of the Nutraceutical Products Market, encompassing market dynamics, growth trends, regional dominance, product landscape, key players, and future outlook. The study period spans from 2019 to 2033, with 2025 serving as the base and estimated year. The report analyzes parent markets (Functional Foods & Beverages) and child markets (Dietary Supplements, Functional Foods, Functional Beverages) across various distribution channels. This report is crucial for industry professionals seeking strategic insights into this dynamic and rapidly evolving market projected to reach xx Million by 2033.
Nutraceutical Products Market Market Dynamics & Structure
The nutraceutical products market is characterized by a moderately concentrated landscape with key players like Alticor Inc (Amway Corporation), Herbalife International of America Inc, Abbott Laboratories, General Mills Inc, PepsiCo Inc, Red Bull GmbH, Danone S.A, Now Health Group Inc (NOW Foods), Kellogg Company, and Nestlé S.A. However, the market also features numerous smaller players and startups, leading to significant competition. Technological innovation, particularly in areas like personalized nutrition and advanced delivery systems, is a major driver. Regulatory frameworks vary considerably across regions, creating both opportunities and challenges for market expansion. The market also faces pressure from competitive product substitutes, such as traditional pharmaceuticals and home remedies. End-user demographics are shifting towards health-conscious consumers, driving demand for premium and specialized products. M&A activity has been moderate in recent years, with a focus on expanding product portfolios and market reach.
- Market Concentration: Moderately concentrated, with a few major players and numerous smaller companies. Market share of top 5 players: xx%
- Technological Innovation: Significant driver, focusing on personalized nutrition, targeted delivery systems, and natural ingredients.
- Regulatory Frameworks: Vary significantly across geographies, impacting market access and product development.
- Competitive Substitutes: Traditional medicines and home remedies exert competitive pressure.
- End-User Demographics: Increasing health awareness among consumers fuels market growth.
- M&A Trends: Moderate activity, driven by portfolio expansion and market reach. Estimated M&A deals (2019-2024): xx
Nutraceutical Products Market Growth Trends & Insights
The nutraceutical products market has demonstrated remarkable expansion, propelled by a confluence of factors including heightened consumer awareness of health and wellness, escalating disposable incomes globally, and a pronounced shift towards proactive and preventative healthcare strategies. This upward trajectory is expected to persist and accelerate through the forecast period. Technological advancements, such as the advent of personalized nutrition solutions tailored to individual genetic profiles and the development of sophisticated delivery mechanisms for enhanced bioavailability, are acting as significant catalysts for market growth. Concurrently, consumer preferences are evolving, leaning increasingly towards products that are natural, organic, and ethically sourced, reflecting a growing demand for sustainability. The integration of digital platforms, particularly the burgeoning e-commerce sector, is revolutionizing market accessibility, bringing a wider array of products to consumers irrespective of geographical limitations. While adoption rates for specific nutraceutical categories exhibit variance, the overall trend unequivocally points towards sustained and robust market expansion.
Dominant Regions, Countries, or Segments in Nutraceutical Products Market
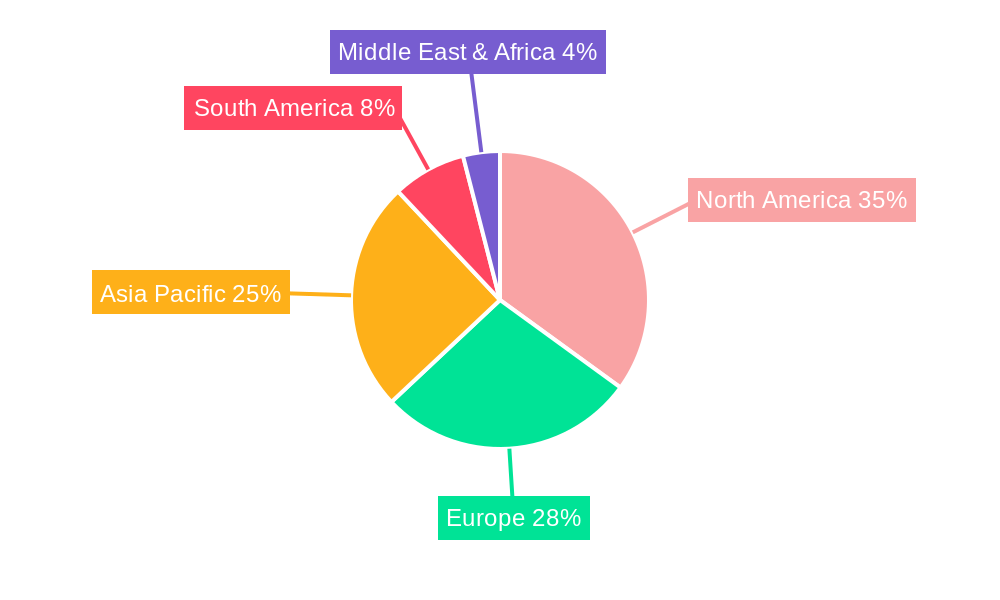
North America currently commands a substantial market share within the global nutraceutical products landscape, closely followed by the dynamic markets of Europe and the rapidly expanding Asia-Pacific region. Within the product segmentation, dietary supplements continue to reign supreme, fueled by an unceasing consumer demand for convenient and effective solutions to bolster overall health and well-being. Functional foods and beverages are also carving out significant growth potential, as consumers seek to integrate health benefits seamlessly into their daily diets. Regarding distribution channels, while traditional avenues such as supermarkets/hypermarkets and specialized health stores retain a strong presence, the meteoric rise of online retail stores is fundamentally reshaping how consumers access and purchase nutraceutical products.
- Leading Region: North America (Market share: [Insert specific percentage here])
- Key Drivers (North America): Pervasive health consciousness, supportive and evolving regulatory frameworks, and well-established, efficient distribution networks.
- Leading Product Type: Dietary Supplements (Market share: [Insert specific percentage here])
- Key Drivers (Dietary Supplements): A comprehensive spectrum of health benefits, unparalleled convenience in consumption, and a burgeoning consumer preference for natural and scientifically-backed health solutions.
- Leading Distribution Channel: Supermarkets/Hypermarkets (Market share: [Insert specific percentage here])
- Key Drivers (Supermarkets/Hypermarkets): Extensive consumer reach, robust and reliable logistical infrastructure, and unparalleled accessibility for a broad consumer base.
Nutraceutical Products Market Product Landscape
The nutraceutical products market is characterized by a wide range of products, including functional foods, dietary supplements, and functional beverages, each with its own unique applications and performance metrics. Recent innovations have focused on personalized nutrition, improved bioavailability, and enhanced taste and convenience. Companies are increasingly emphasizing natural ingredients, sustainable sourcing, and transparent labeling to enhance product appeal and build consumer trust. Key innovations include targeted delivery systems and products designed to address specific health concerns.
Key Drivers, Barriers & Challenges in Nutraceutical Products Market
Key Drivers:
- A pervasive and intensifying focus on personal health, well-being, and the proactive adoption of preventative healthcare measures.
- A sustained increase in disposable incomes, leading to greater consumer spending on premium wellness and health-enhancing products.
- Continuous technological innovation in product formulation, research and development, and sophisticated delivery systems to enhance efficacy and bioavailability.
- The establishment and evolution of favorable regulatory environments in key geographical markets, fostering innovation and market entry.
- Growing consumer demand for natural, organic, and plant-based ingredients, aligning with broader wellness trends.
Key Challenges:
- Navigating complex and often stringent regulatory landscapes, with significant variations in standards and approval processes across different regions, potentially leading to market fragmentation and delays.
- The substantial financial investment required for extensive research, rigorous clinical trials, and product development to ensure safety and efficacy.
- Intense market competition from a wide array of established global players and agile emerging companies vying for market share.
- Ongoing concerns and scrutiny regarding product safety, verifiable efficacy, and the consistent maintenance of high-quality control standards throughout the supply chain.
- Potential impact on market growth due to regulatory hurdles and consumer perception challenges, estimated to cause a [Insert specific percentage here] reduction in growth during the 2025-2033 period if not effectively managed.
Emerging Opportunities in Nutraceutical Products Market
- Growing demand for personalized nutrition solutions.
- Expansion into untapped markets in developing countries.
- Development of novel delivery systems, such as nanotechnology.
- Increased focus on sustainability and ethical sourcing of ingredients.
Growth Accelerators in the Nutraceutical Products Market Industry
Technological breakthroughs in personalized nutrition, advanced delivery systems, and ingredient standardization are key catalysts for long-term growth. Strategic partnerships between nutraceutical companies and healthcare providers can accelerate market penetration. Expansion into new markets and product categories, along with improved consumer education, will further propel market growth.
Key Players Shaping the Nutraceutical Products Market Market
Notable Milestones in Nutraceutical Products Market Sector
- June 2022: Kellogg's Special K strategically expanded its product portfolio with the launch of new protein snack bars, effectively capitalizing on the growing consumer demand for convenient and nutrient-dense snack options.
- February 2022: PepsiCo's Rockstar Energy brand innovated by introducing a hemp-infused energy drink, strategically tapping into the surging consumer interest in functional beverages with novel ingredients.
- April 2021: Nestlé's NIDO 3+ undertook a significant product reformulation, demonstrating a commitment to addressing the specific and evolving nutritional needs of a key demographic segment.
- [Insert Month/Year]: [Company Name] launched [Product Name], a groundbreaking [Product Type] that utilizes [Key Technology/Ingredient], further emphasizing the trend towards [Specific Market Trend].
In-Depth Nutraceutical Products Market Market Outlook
The future outlook for the nutraceutical products market is exceptionally promising, underpinned by a robust foundation of continuous innovation, escalating consumer demand for health-centric solutions, and the expanding global footprint of the industry. Strategic growth opportunities abound in the realms of personalized nutrition, the development of advanced and bioavailable delivery systems, and the increasing emphasis on sustainable and ethically sourced ingredients. Companies that prioritize distinct product offerings, invest in comprehensive consumer education initiatives, and forge strategic collaborations are optimally positioned to achieve sustained success and leadership within this dynamic and rapidly evolving marketplace. The market is poised for significant growth, driven by a deeper understanding of the intricate link between nutrition and overall health.
Nutraceutical Products Market Segmentation
-
1. Product Type
-
1.1. Functional Food
- 1.1.1. Cereal
- 1.1.2. Bakery and Confectionary
- 1.1.3. Dairy
- 1.1.4. Snack
- 1.1.5. Other Functional Foods
-
1.2. Functional Beverage
- 1.2.1. Energy Drink
- 1.2.2. Sports Drink
- 1.2.3. Fortified Juice
- 1.2.4. Dairy and Dairy Alternative Beverage
- 1.2.5. Other Functional Beverages
-
1.3. Dietary Supplements
- 1.3.1. Vitamins
- 1.3.2. Minerals
- 1.3.3. Botanicals
- 1.3.4. Enzyme
- 1.3.5. Fatty Acids
- 1.3.6. Proteins
- 1.3.7. Other Dietary Supplements
-
1.1. Functional Food
-
2. Distribution Channel
- 2.1. Specialty Stores
- 2.2. Supermarkets/Hypermarkets
- 2.3. Convenience Stores
- 2.4. Drug Stores/Pharmacies
- 2.5. Online Retail Stores
- 2.6. Other Distribution Channels
Nutraceutical Products Market Segmentation By Geography
-
1. North America
- 1.1. United States
- 1.2. Canada
- 1.3. Mexico
- 1.4. Rest of North America
-
2. Europe
- 2.1. Germany
- 2.2. United Kingdom
- 2.3. France
- 2.4. Sweden
- 2.5. Spain
- 2.6. Italy
- 2.7. Russia
- 2.8. Rest of Europe
-
3. Asia Pacific
- 3.1. China
- 3.2. Japan
- 3.3. India
- 3.4. Australia
- 3.5. Rest of Asia Pacific
-
4. South America
- 4.1. Brazil
- 4.2. Argentina
- 4.3. Rest of South America
- 5. Middle East
-
6. South Africa
- 6.1. United Arab Emirates
- 6.2. Rest of Middle East
Nutraceutical Products Market Regional Market Share
Geographic Coverage of Nutraceutical Products Market
Nutraceutical Products Market REPORT HIGHLIGHTS
| Aspects | Details |
|---|---|
| Study Period | 2020-2034 |
| Base Year | 2025 |
| Estimated Year | 2026 |
| Forecast Period | 2026-2034 |
| Historical Period | 2020-2025 |
| Growth Rate | CAGR of 5.09% from 2020-2034 |
| Segmentation |
|
Table of Contents
- 1. Introduction
- 1.1. Research Scope
- 1.2. Market Segmentation
- 1.3. Research Objective
- 1.4. Definitions and Assumptions
- 2. Executive Summary
- 2.1. Market Snapshot
- 3. Market Dynamics
- 3.1. Market Drivers
- 3.2. Market Restrains
- 3.3. Market Trends
- 3.4. Market Opportunities
- 4. Market Factor Analysis
- 4.1. Porters Five Forces
- 4.1.1. Bargaining Power of Suppliers
- 4.1.2. Bargaining Power of Buyers
- 4.1.3. Threat of New Entrants
- 4.1.4. Threat of Substitutes
- 4.1.5. Competitive Rivalry
- 4.2. PESTEL analysis
- 4.3. BCG Analysis
- 4.3.1. Stars (High Growth, High Market Share)
- 4.3.2. Cash Cows (Low Growth, High Market Share)
- 4.3.3. Question Mark (High Growth, Low Market Share)
- 4.3.4. Dogs (Low Growth, Low Market Share)
- 4.4. Ansoff Matrix Analysis
- 4.5. Supply Chain Analysis
- 4.6. Regulatory Landscape
- 4.7. Current Market Potential and Opportunity Assessment (TAM–SAM–SOM Framework)
- 4.8. VDR Analyst Note
- 4.1. Porters Five Forces
- 5. Market Analysis, Insights and Forecast 2021-2033
- 5.1. Market Analysis, Insights and Forecast - by Product Type
- 5.1.1. Functional Food
- 5.1.1.1. Cereal
- 5.1.1.2. Bakery and Confectionary
- 5.1.1.3. Dairy
- 5.1.1.4. Snack
- 5.1.1.5. Other Functional Foods
- 5.1.2. Functional Beverage
- 5.1.2.1. Energy Drink
- 5.1.2.2. Sports Drink
- 5.1.2.3. Fortified Juice
- 5.1.2.4. Dairy and Dairy Alternative Beverage
- 5.1.2.5. Other Functional Beverages
- 5.1.3. Dietary Supplements
- 5.1.3.1. Vitamins
- 5.1.3.2. Minerals
- 5.1.3.3. Botanicals
- 5.1.3.4. Enzyme
- 5.1.3.5. Fatty Acids
- 5.1.3.6. Proteins
- 5.1.3.7. Other Dietary Supplements
- 5.1.1. Functional Food
- 5.2. Market Analysis, Insights and Forecast - by Distribution Channel
- 5.2.1. Specialty Stores
- 5.2.2. Supermarkets/Hypermarkets
- 5.2.3. Convenience Stores
- 5.2.4. Drug Stores/Pharmacies
- 5.2.5. Online Retail Stores
- 5.2.6. Other Distribution Channels
- 5.3. Market Analysis, Insights and Forecast - by Region
- 5.3.1. North America
- 5.3.2. Europe
- 5.3.3. Asia Pacific
- 5.3.4. South America
- 5.3.5. Middle East
- 5.3.6. South Africa
- 5.1. Market Analysis, Insights and Forecast - by Product Type
- 6. Global Nutraceutical Products Market Analysis, Insights and Forecast, 2021-2033
- 6.1. Market Analysis, Insights and Forecast - by Product Type
- 6.1.1. Functional Food
- 6.1.1.1. Cereal
- 6.1.1.2. Bakery and Confectionary
- 6.1.1.3. Dairy
- 6.1.1.4. Snack
- 6.1.1.5. Other Functional Foods
- 6.1.2. Functional Beverage
- 6.1.2.1. Energy Drink
- 6.1.2.2. Sports Drink
- 6.1.2.3. Fortified Juice
- 6.1.2.4. Dairy and Dairy Alternative Beverage
- 6.1.2.5. Other Functional Beverages
- 6.1.3. Dietary Supplements
- 6.1.3.1. Vitamins
- 6.1.3.2. Minerals
- 6.1.3.3. Botanicals
- 6.1.3.4. Enzyme
- 6.1.3.5. Fatty Acids
- 6.1.3.6. Proteins
- 6.1.3.7. Other Dietary Supplements
- 6.1.1. Functional Food
- 6.2. Market Analysis, Insights and Forecast - by Distribution Channel
- 6.2.1. Specialty Stores
- 6.2.2. Supermarkets/Hypermarkets
- 6.2.3. Convenience Stores
- 6.2.4. Drug Stores/Pharmacies
- 6.2.5. Online Retail Stores
- 6.2.6. Other Distribution Channels
- 6.1. Market Analysis, Insights and Forecast - by Product Type
- 7. North America Nutraceutical Products Market Analysis, Insights and Forecast, 2021-2033
- 7.1. Market Analysis, Insights and Forecast - by Product Type
- 7.1.1. Functional Food
- 7.1.1.1. Cereal
- 7.1.1.2. Bakery and Confectionary
- 7.1.1.3. Dairy
- 7.1.1.4. Snack
- 7.1.1.5. Other Functional Foods
- 7.1.2. Functional Beverage
- 7.1.2.1. Energy Drink
- 7.1.2.2. Sports Drink
- 7.1.2.3. Fortified Juice
- 7.1.2.4. Dairy and Dairy Alternative Beverage
- 7.1.2.5. Other Functional Beverages
- 7.1.3. Dietary Supplements
- 7.1.3.1. Vitamins
- 7.1.3.2. Minerals
- 7.1.3.3. Botanicals
- 7.1.3.4. Enzyme
- 7.1.3.5. Fatty Acids
- 7.1.3.6. Proteins
- 7.1.3.7. Other Dietary Supplements
- 7.1.1. Functional Food
- 7.2. Market Analysis, Insights and Forecast - by Distribution Channel
- 7.2.1. Specialty Stores
- 7.2.2. Supermarkets/Hypermarkets
- 7.2.3. Convenience Stores
- 7.2.4. Drug Stores/Pharmacies
- 7.2.5. Online Retail Stores
- 7.2.6. Other Distribution Channels
- 7.1. Market Analysis, Insights and Forecast - by Product Type
- 8. Europe Nutraceutical Products Market Analysis, Insights and Forecast, 2021-2033
- 8.1. Market Analysis, Insights and Forecast - by Product Type
- 8.1.1. Functional Food
- 8.1.1.1. Cereal
- 8.1.1.2. Bakery and Confectionary
- 8.1.1.3. Dairy
- 8.1.1.4. Snack
- 8.1.1.5. Other Functional Foods
- 8.1.2. Functional Beverage
- 8.1.2.1. Energy Drink
- 8.1.2.2. Sports Drink
- 8.1.2.3. Fortified Juice
- 8.1.2.4. Dairy and Dairy Alternative Beverage
- 8.1.2.5. Other Functional Beverages
- 8.1.3. Dietary Supplements
- 8.1.3.1. Vitamins
- 8.1.3.2. Minerals
- 8.1.3.3. Botanicals
- 8.1.3.4. Enzyme
- 8.1.3.5. Fatty Acids
- 8.1.3.6. Proteins
- 8.1.3.7. Other Dietary Supplements
- 8.1.1. Functional Food
- 8.2. Market Analysis, Insights and Forecast - by Distribution Channel
- 8.2.1. Specialty Stores
- 8.2.2. Supermarkets/Hypermarkets
- 8.2.3. Convenience Stores
- 8.2.4. Drug Stores/Pharmacies
- 8.2.5. Online Retail Stores
- 8.2.6. Other Distribution Channels
- 8.1. Market Analysis, Insights and Forecast - by Product Type
- 9. Asia Pacific Nutraceutical Products Market Analysis, Insights and Forecast, 2021-2033
- 9.1. Market Analysis, Insights and Forecast - by Product Type
- 9.1.1. Functional Food
- 9.1.1.1. Cereal
- 9.1.1.2. Bakery and Confectionary
- 9.1.1.3. Dairy
- 9.1.1.4. Snack
- 9.1.1.5. Other Functional Foods
- 9.1.2. Functional Beverage
- 9.1.2.1. Energy Drink
- 9.1.2.2. Sports Drink
- 9.1.2.3. Fortified Juice
- 9.1.2.4. Dairy and Dairy Alternative Beverage
- 9.1.2.5. Other Functional Beverages
- 9.1.3. Dietary Supplements
- 9.1.3.1. Vitamins
- 9.1.3.2. Minerals
- 9.1.3.3. Botanicals
- 9.1.3.4. Enzyme
- 9.1.3.5. Fatty Acids
- 9.1.3.6. Proteins
- 9.1.3.7. Other Dietary Supplements
- 9.1.1. Functional Food
- 9.2. Market Analysis, Insights and Forecast - by Distribution Channel
- 9.2.1. Specialty Stores
- 9.2.2. Supermarkets/Hypermarkets
- 9.2.3. Convenience Stores
- 9.2.4. Drug Stores/Pharmacies
- 9.2.5. Online Retail Stores
- 9.2.6. Other Distribution Channels
- 9.1. Market Analysis, Insights and Forecast - by Product Type
- 10. South America Nutraceutical Products Market Analysis, Insights and Forecast, 2021-2033
- 10.1. Market Analysis, Insights and Forecast - by Product Type
- 10.1.1. Functional Food
- 10.1.1.1. Cereal
- 10.1.1.2. Bakery and Confectionary
- 10.1.1.3. Dairy
- 10.1.1.4. Snack
- 10.1.1.5. Other Functional Foods
- 10.1.2. Functional Beverage
- 10.1.2.1. Energy Drink
- 10.1.2.2. Sports Drink
- 10.1.2.3. Fortified Juice
- 10.1.2.4. Dairy and Dairy Alternative Beverage
- 10.1.2.5. Other Functional Beverages
- 10.1.3. Dietary Supplements
- 10.1.3.1. Vitamins
- 10.1.3.2. Minerals
- 10.1.3.3. Botanicals
- 10.1.3.4. Enzyme
- 10.1.3.5. Fatty Acids
- 10.1.3.6. Proteins
- 10.1.3.7. Other Dietary Supplements
- 10.1.1. Functional Food
- 10.2. Market Analysis, Insights and Forecast - by Distribution Channel
- 10.2.1. Specialty Stores
- 10.2.2. Supermarkets/Hypermarkets
- 10.2.3. Convenience Stores
- 10.2.4. Drug Stores/Pharmacies
- 10.2.5. Online Retail Stores
- 10.2.6. Other Distribution Channels
- 10.1. Market Analysis, Insights and Forecast - by Product Type
- 11. Middle East Nutraceutical Products Market Analysis, Insights and Forecast, 2021-2033
- 11.1. Market Analysis, Insights and Forecast - by Product Type
- 11.1.1. Functional Food
- 11.1.1.1. Cereal
- 11.1.1.2. Bakery and Confectionary
- 11.1.1.3. Dairy
- 11.1.1.4. Snack
- 11.1.1.5. Other Functional Foods
- 11.1.2. Functional Beverage
- 11.1.2.1. Energy Drink
- 11.1.2.2. Sports Drink
- 11.1.2.3. Fortified Juice
- 11.1.2.4. Dairy and Dairy Alternative Beverage
- 11.1.2.5. Other Functional Beverages
- 11.1.3. Dietary Supplements
- 11.1.3.1. Vitamins
- 11.1.3.2. Minerals
- 11.1.3.3. Botanicals
- 11.1.3.4. Enzyme
- 11.1.3.5. Fatty Acids
- 11.1.3.6. Proteins
- 11.1.3.7. Other Dietary Supplements
- 11.1.1. Functional Food
- 11.2. Market Analysis, Insights and Forecast - by Distribution Channel
- 11.2.1. Specialty Stores
- 11.2.2. Supermarkets/Hypermarkets
- 11.2.3. Convenience Stores
- 11.2.4. Drug Stores/Pharmacies
- 11.2.5. Online Retail Stores
- 11.2.6. Other Distribution Channels
- 11.1. Market Analysis, Insights and Forecast - by Product Type
- 12. South Africa Nutraceutical Products Market Analysis, Insights and Forecast, 2021-2033
- 12.1. Market Analysis, Insights and Forecast - by Product Type
- 12.1.1. Functional Food
- 12.1.1.1. Cereal
- 12.1.1.2. Bakery and Confectionary
- 12.1.1.3. Dairy
- 12.1.1.4. Snack
- 12.1.1.5. Other Functional Foods
- 12.1.2. Functional Beverage
- 12.1.2.1. Energy Drink
- 12.1.2.2. Sports Drink
- 12.1.2.3. Fortified Juice
- 12.1.2.4. Dairy and Dairy Alternative Beverage
- 12.1.2.5. Other Functional Beverages
- 12.1.3. Dietary Supplements
- 12.1.3.1. Vitamins
- 12.1.3.2. Minerals
- 12.1.3.3. Botanicals
- 12.1.3.4. Enzyme
- 12.1.3.5. Fatty Acids
- 12.1.3.6. Proteins
- 12.1.3.7. Other Dietary Supplements
- 12.1.1. Functional Food
- 12.2. Market Analysis, Insights and Forecast - by Distribution Channel
- 12.2.1. Specialty Stores
- 12.2.2. Supermarkets/Hypermarkets
- 12.2.3. Convenience Stores
- 12.2.4. Drug Stores/Pharmacies
- 12.2.5. Online Retail Stores
- 12.2.6. Other Distribution Channels
- 12.1. Market Analysis, Insights and Forecast - by Product Type
- 13. Competitive Analysis
- 13.1. Company Profiles
- 13.1.1 Alticor Inc (Amway Corporation)
- 13.1.1.1. Company Overview
- 13.1.1.2. Products
- 13.1.1.3. Company Financials
- 13.1.1.4. SWOT Analysis
- 13.1.2 Herbalife International of America Inc
- 13.1.2.1. Company Overview
- 13.1.2.2. Products
- 13.1.2.3. Company Financials
- 13.1.2.4. SWOT Analysis
- 13.1.3 Abbott Laboratories*List Not Exhaustive
- 13.1.3.1. Company Overview
- 13.1.3.2. Products
- 13.1.3.3. Company Financials
- 13.1.3.4. SWOT Analysis
- 13.1.4 General Mills Inc
- 13.1.4.1. Company Overview
- 13.1.4.2. Products
- 13.1.4.3. Company Financials
- 13.1.4.4. SWOT Analysis
- 13.1.5 PepsiCo Inc
- 13.1.5.1. Company Overview
- 13.1.5.2. Products
- 13.1.5.3. Company Financials
- 13.1.5.4. SWOT Analysis
- 13.1.6 Red Bull GmbH
- 13.1.6.1. Company Overview
- 13.1.6.2. Products
- 13.1.6.3. Company Financials
- 13.1.6.4. SWOT Analysis
- 13.1.7 Danone S A
- 13.1.7.1. Company Overview
- 13.1.7.2. Products
- 13.1.7.3. Company Financials
- 13.1.7.4. SWOT Analysis
- 13.1.8 Now Health Group Inc (NOW Foods)
- 13.1.8.1. Company Overview
- 13.1.8.2. Products
- 13.1.8.3. Company Financials
- 13.1.8.4. SWOT Analysis
- 13.1.9 Kellogg Company
- 13.1.9.1. Company Overview
- 13.1.9.2. Products
- 13.1.9.3. Company Financials
- 13.1.9.4. SWOT Analysis
- 13.1.10 Nestlé S A
- 13.1.10.1. Company Overview
- 13.1.10.2. Products
- 13.1.10.3. Company Financials
- 13.1.10.4. SWOT Analysis
- 13.1.1 Alticor Inc (Amway Corporation)
- 13.2. Market Entropy
- 13.2.1 Company's Key Areas Served
- 13.2.2 Recent Developments
- 13.3. Company Market Share Analysis 2025
- 13.3.1 Top 5 Companies Market Share Analysis
- 13.3.2 Top 3 Companies Market Share Analysis
- 13.4. List of Potential Customers
- 14. Research Methodology
List of Figures
- Figure 1: Global Nutraceutical Products Market Revenue Breakdown (Million, %) by Region 2025 & 2033
- Figure 2: North America Nutraceutical Products Market Revenue (Million), by Product Type 2025 & 2033
- Figure 3: North America Nutraceutical Products Market Revenue Share (%), by Product Type 2025 & 2033
- Figure 4: North America Nutraceutical Products Market Revenue (Million), by Distribution Channel 2025 & 2033
- Figure 5: North America Nutraceutical Products Market Revenue Share (%), by Distribution Channel 2025 & 2033
- Figure 6: North America Nutraceutical Products Market Revenue (Million), by Country 2025 & 2033
- Figure 7: North America Nutraceutical Products Market Revenue Share (%), by Country 2025 & 2033
- Figure 8: Europe Nutraceutical Products Market Revenue (Million), by Product Type 2025 & 2033
- Figure 9: Europe Nutraceutical Products Market Revenue Share (%), by Product Type 2025 & 2033
- Figure 10: Europe Nutraceutical Products Market Revenue (Million), by Distribution Channel 2025 & 2033
- Figure 11: Europe Nutraceutical Products Market Revenue Share (%), by Distribution Channel 2025 & 2033
- Figure 12: Europe Nutraceutical Products Market Revenue (Million), by Country 2025 & 2033
- Figure 13: Europe Nutraceutical Products Market Revenue Share (%), by Country 2025 & 2033
- Figure 14: Asia Pacific Nutraceutical Products Market Revenue (Million), by Product Type 2025 & 2033
- Figure 15: Asia Pacific Nutraceutical Products Market Revenue Share (%), by Product Type 2025 & 2033
- Figure 16: Asia Pacific Nutraceutical Products Market Revenue (Million), by Distribution Channel 2025 & 2033
- Figure 17: Asia Pacific Nutraceutical Products Market Revenue Share (%), by Distribution Channel 2025 & 2033
- Figure 18: Asia Pacific Nutraceutical Products Market Revenue (Million), by Country 2025 & 2033
- Figure 19: Asia Pacific Nutraceutical Products Market Revenue Share (%), by Country 2025 & 2033
- Figure 20: South America Nutraceutical Products Market Revenue (Million), by Product Type 2025 & 2033
- Figure 21: South America Nutraceutical Products Market Revenue Share (%), by Product Type 2025 & 2033
- Figure 22: South America Nutraceutical Products Market Revenue (Million), by Distribution Channel 2025 & 2033
- Figure 23: South America Nutraceutical Products Market Revenue Share (%), by Distribution Channel 2025 & 2033
- Figure 24: South America Nutraceutical Products Market Revenue (Million), by Country 2025 & 2033
- Figure 25: South America Nutraceutical Products Market Revenue Share (%), by Country 2025 & 2033
- Figure 26: Middle East Nutraceutical Products Market Revenue (Million), by Product Type 2025 & 2033
- Figure 27: Middle East Nutraceutical Products Market Revenue Share (%), by Product Type 2025 & 2033
- Figure 28: Middle East Nutraceutical Products Market Revenue (Million), by Distribution Channel 2025 & 2033
- Figure 29: Middle East Nutraceutical Products Market Revenue Share (%), by Distribution Channel 2025 & 2033
- Figure 30: Middle East Nutraceutical Products Market Revenue (Million), by Country 2025 & 2033
- Figure 31: Middle East Nutraceutical Products Market Revenue Share (%), by Country 2025 & 2033
- Figure 32: South Africa Nutraceutical Products Market Revenue (Million), by Product Type 2025 & 2033
- Figure 33: South Africa Nutraceutical Products Market Revenue Share (%), by Product Type 2025 & 2033
- Figure 34: South Africa Nutraceutical Products Market Revenue (Million), by Distribution Channel 2025 & 2033
- Figure 35: South Africa Nutraceutical Products Market Revenue Share (%), by Distribution Channel 2025 & 2033
- Figure 36: South Africa Nutraceutical Products Market Revenue (Million), by Country 2025 & 2033
- Figure 37: South Africa Nutraceutical Products Market Revenue Share (%), by Country 2025 & 2033
List of Tables
- Table 1: Global Nutraceutical Products Market Revenue Million Forecast, by Product Type 2020 & 2033
- Table 2: Global Nutraceutical Products Market Revenue Million Forecast, by Distribution Channel 2020 & 2033
- Table 3: Global Nutraceutical Products Market Revenue Million Forecast, by Region 2020 & 2033
- Table 4: Global Nutraceutical Products Market Revenue Million Forecast, by Product Type 2020 & 2033
- Table 5: Global Nutraceutical Products Market Revenue Million Forecast, by Distribution Channel 2020 & 2033
- Table 6: Global Nutraceutical Products Market Revenue Million Forecast, by Country 2020 & 2033
- Table 7: United States Nutraceutical Products Market Revenue (Million) Forecast, by Application 2020 & 2033
- Table 8: Canada Nutraceutical Products Market Revenue (Million) Forecast, by Application 2020 & 2033
- Table 9: Mexico Nutraceutical Products Market Revenue (Million) Forecast, by Application 2020 & 2033
- Table 10: Rest of North America Nutraceutical Products Market Revenue (Million) Forecast, by Application 2020 & 2033
- Table 11: Global Nutraceutical Products Market Revenue Million Forecast, by Product Type 2020 & 2033
- Table 12: Global Nutraceutical Products Market Revenue Million Forecast, by Distribution Channel 2020 & 2033
- Table 13: Global Nutraceutical Products Market Revenue Million Forecast, by Country 2020 & 2033
- Table 14: Germany Nutraceutical Products Market Revenue (Million) Forecast, by Application 2020 & 2033
- Table 15: United Kingdom Nutraceutical Products Market Revenue (Million) Forecast, by Application 2020 & 2033
- Table 16: France Nutraceutical Products Market Revenue (Million) Forecast, by Application 2020 & 2033
- Table 17: Sweden Nutraceutical Products Market Revenue (Million) Forecast, by Application 2020 & 2033
- Table 18: Spain Nutraceutical Products Market Revenue (Million) Forecast, by Application 2020 & 2033
- Table 19: Italy Nutraceutical Products Market Revenue (Million) Forecast, by Application 2020 & 2033
- Table 20: Russia Nutraceutical Products Market Revenue (Million) Forecast, by Application 2020 & 2033
- Table 21: Rest of Europe Nutraceutical Products Market Revenue (Million) Forecast, by Application 2020 & 2033
- Table 22: Global Nutraceutical Products Market Revenue Million Forecast, by Product Type 2020 & 2033
- Table 23: Global Nutraceutical Products Market Revenue Million Forecast, by Distribution Channel 2020 & 2033
- Table 24: Global Nutraceutical Products Market Revenue Million Forecast, by Country 2020 & 2033
- Table 25: China Nutraceutical Products Market Revenue (Million) Forecast, by Application 2020 & 2033
- Table 26: Japan Nutraceutical Products Market Revenue (Million) Forecast, by Application 2020 & 2033
- Table 27: India Nutraceutical Products Market Revenue (Million) Forecast, by Application 2020 & 2033
- Table 28: Australia Nutraceutical Products Market Revenue (Million) Forecast, by Application 2020 & 2033
- Table 29: Rest of Asia Pacific Nutraceutical Products Market Revenue (Million) Forecast, by Application 2020 & 2033
- Table 30: Global Nutraceutical Products Market Revenue Million Forecast, by Product Type 2020 & 2033
- Table 31: Global Nutraceutical Products Market Revenue Million Forecast, by Distribution Channel 2020 & 2033
- Table 32: Global Nutraceutical Products Market Revenue Million Forecast, by Country 2020 & 2033
- Table 33: Brazil Nutraceutical Products Market Revenue (Million) Forecast, by Application 2020 & 2033
- Table 34: Argentina Nutraceutical Products Market Revenue (Million) Forecast, by Application 2020 & 2033
- Table 35: Rest of South America Nutraceutical Products Market Revenue (Million) Forecast, by Application 2020 & 2033
- Table 36: Global Nutraceutical Products Market Revenue Million Forecast, by Product Type 2020 & 2033
- Table 37: Global Nutraceutical Products Market Revenue Million Forecast, by Distribution Channel 2020 & 2033
- Table 38: Global Nutraceutical Products Market Revenue Million Forecast, by Country 2020 & 2033
- Table 39: Global Nutraceutical Products Market Revenue Million Forecast, by Product Type 2020 & 2033
- Table 40: Global Nutraceutical Products Market Revenue Million Forecast, by Distribution Channel 2020 & 2033
- Table 41: Global Nutraceutical Products Market Revenue Million Forecast, by Country 2020 & 2033
- Table 42: United Arab Emirates Nutraceutical Products Market Revenue (Million) Forecast, by Application 2020 & 2033
- Table 43: Rest of Middle East Nutraceutical Products Market Revenue (Million) Forecast, by Application 2020 & 2033
Frequently Asked Questions
1. What is the projected Compound Annual Growth Rate (CAGR) of the Nutraceutical Products Market?
The projected CAGR is approximately 5.09%.
2. Which companies are prominent players in the Nutraceutical Products Market?
Key companies in the market include Alticor Inc (Amway Corporation), Herbalife International of America Inc, Abbott Laboratories*List Not Exhaustive, General Mills Inc, PepsiCo Inc, Red Bull GmbH, Danone S A, Now Health Group Inc (NOW Foods), Kellogg Company, Nestlé S A.
3. What are the main segments of the Nutraceutical Products Market?
The market segments include Product Type, Distribution Channel.
4. Can you provide details about the market size?
The market size is estimated to be USD 488.41 Million as of 2022.
5. What are some drivers contributing to market growth?
Popularity of On-the-Go Snacking Options; Trend Of Clean Label and Plant-Based Bars.
6. What are the notable trends driving market growth?
Increased Demand From Healthy & Functional Foods.
7. Are there any restraints impacting market growth?
Availability of Counterfeit Products.
8. Can you provide examples of recent developments in the market?
June 2022: Kellogg's Special K released new Protein Snack Bars containing 6 grams of protein and 90 calories. The snack bar is offered in two delectable flavors, sweet Berry Vanilla and rich chocolaty Brownie Sundae, and provides a simple on-the-go protein grab without compromising taste.
9. What pricing options are available for accessing the report?
Pricing options include single-user, multi-user, and enterprise licenses priced at USD 4750, USD 5250, and USD 8750 respectively.
10. Is the market size provided in terms of value or volume?
The market size is provided in terms of value, measured in Million.
11. Are there any specific market keywords associated with the report?
Yes, the market keyword associated with the report is "Nutraceutical Products Market," which aids in identifying and referencing the specific market segment covered.
12. How do I determine which pricing option suits my needs best?
The pricing options vary based on user requirements and access needs. Individual users may opt for single-user licenses, while businesses requiring broader access may choose multi-user or enterprise licenses for cost-effective access to the report.
13. Are there any additional resources or data provided in the Nutraceutical Products Market report?
While the report offers comprehensive insights, it's advisable to review the specific contents or supplementary materials provided to ascertain if additional resources or data are available.
14. How can I stay updated on further developments or reports in the Nutraceutical Products Market?
To stay informed about further developments, trends, and reports in the Nutraceutical Products Market, consider subscribing to industry newsletters, following relevant companies and organizations, or regularly checking reputable industry news sources and publications.
Methodology
Step 1 - Identification of Relevant Samples Size from Population Database


Step 2 - Approaches for Defining Global Market Size (Value, Volume* & Price*)

Note*: In applicable scenarios
Step 3 - Data Sources
Primary Research
- Web Analytics
- Survey Reports
- Research Institute
- Latest Research Reports
- Opinion Leaders
Secondary Research
- Annual Reports
- White Paper
- Latest Press Release
- Industry Association
- Paid Database
- Investor Presentations

Step 4 - Data Triangulation
Involves using different sources of information in order to increase the validity of a study
These sources are likely to be stakeholders in a program - participants, other researchers, program staff, other community members, and so on.
Then we put all data in single framework & apply various statistical tools to find out the dynamic on the market.
During the analysis stage, feedback from the stakeholder groups would be compared to determine areas of agreement as well as areas of divergence